地理空间可视化效果
可以使用 Kusto Desktop Explorer 中的 render 运算符或使用 Azure 数据资源管理器 Web UI 来可视化地理空间数据。 若要下载 Kusto Desktop Explorer,请参阅 Kusto.Explorer 安装和用户界面。
有关可视化选项的详细信息,请参阅使用 Azure 数据资源管理器进行数据可视化。 有关地理空间聚类的详细信息,请参阅地理空间聚类。
可视化地图上的点
可以使用 [经度, 纬度] 列或 GeoJSON 列将点可视化。 系列列是选用的。 每个点是由 [经度, 纬度](按这种顺序)定义的。
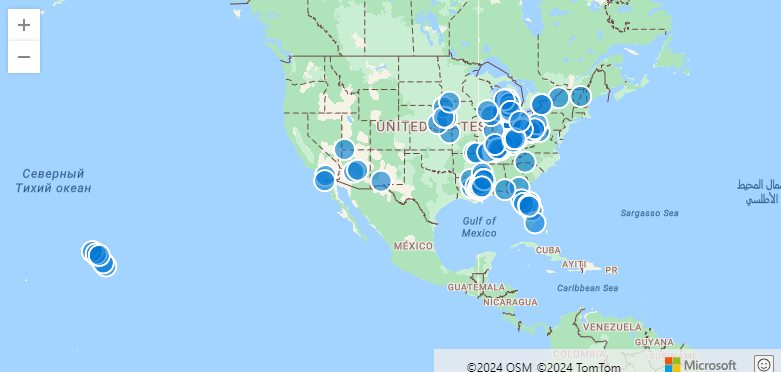
示例:可视化地图上的点
StormEvents
| take 100
| project BeginLon, BeginLat
| render scatterchart with (kind = map)
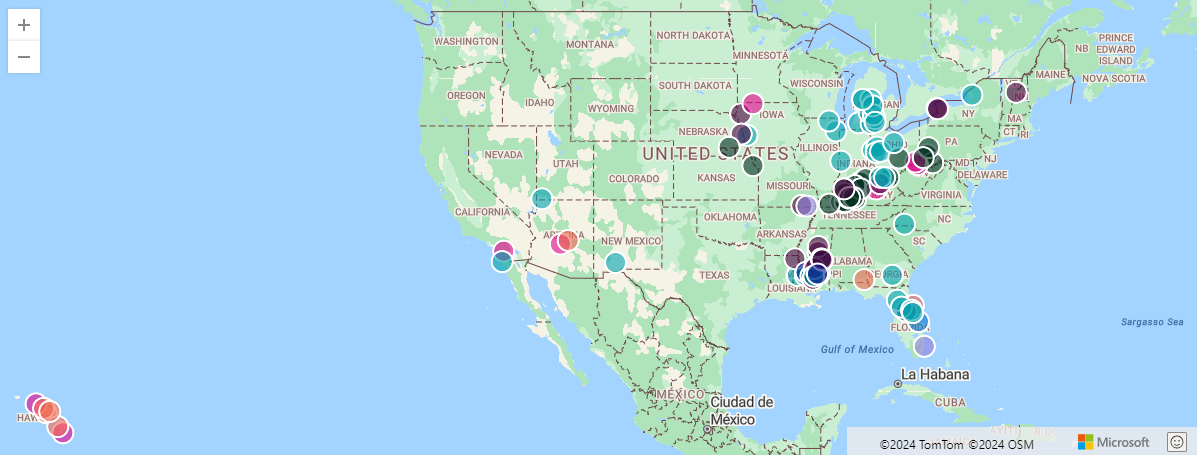
示例:可视化地图上的多个点系列
若要可视化多个点系列,每个点需要由 [经度, 纬度] 对定义,而系列需要由第三个列定义。 在此示例中,系列为 EventType。
StormEvents
| take 100
| project BeginLon, BeginLat, EventType
| render scatterchart with (kind = map)
示例:使用多个列可视化数据点系列
如果结果中有多个列,则必须指定要用于 xcolumn(经度)、ycolumn(纬度)和系列的列。
StormEvents
| take 100
| render scatterchart with (kind = map, xcolumn = BeginLon, ycolumns = BeginLat, series = EventType)
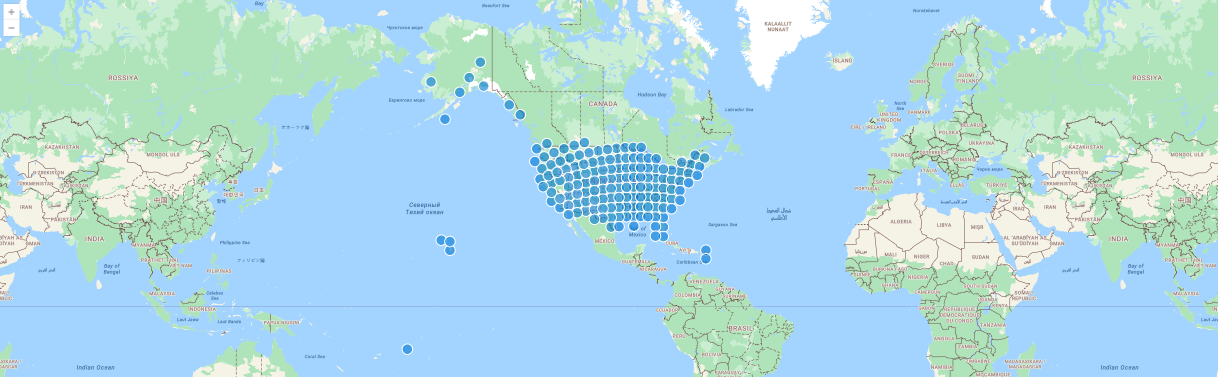
示例:可视化地图上由 GeoJSON 动态值定义的点
在此示例中,点由 GeoJSON 动态值定义。
StormEvents
| project BeginLon, BeginLat
| summarize by hash=geo_point_to_s2cell(BeginLon, BeginLat, 5)
| project geo_s2cell_to_central_point(hash)
| render scatterchart with (kind = map)
可视化地图上的饼图或气泡图
可以使用 [经度, 纬度] 列或 GeoJSON 列来可视化饼图或气泡图。 可以使用颜色或数值轴创建这些可视化效果。
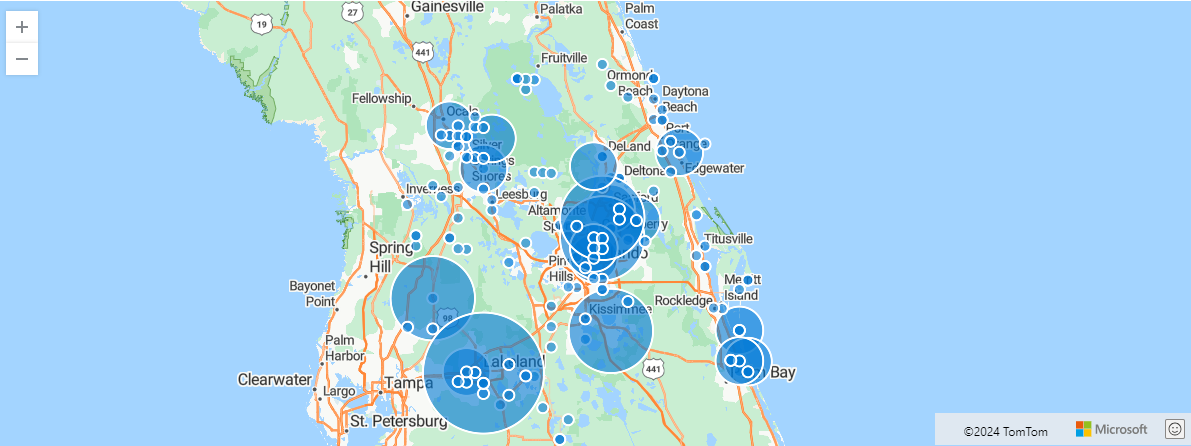
示例:按位置可视化饼图
以下示例显示由 s2 单元格聚合的风暴事件。 该图表在饼图中按位置聚合事件。
StormEvents
| project BeginLon, BeginLat, EventType
| where geo_point_in_circle(BeginLon, BeginLat, real(-81.3891), 28.5346, 1000 * 100)
| summarize count() by EventType, hash = geo_point_to_s2cell(BeginLon, BeginLat)
| project geo_s2cell_to_central_point(hash), EventType, count_
| render piechart with (kind = map) // pie map rendering available only in Kusto Explorer desktop
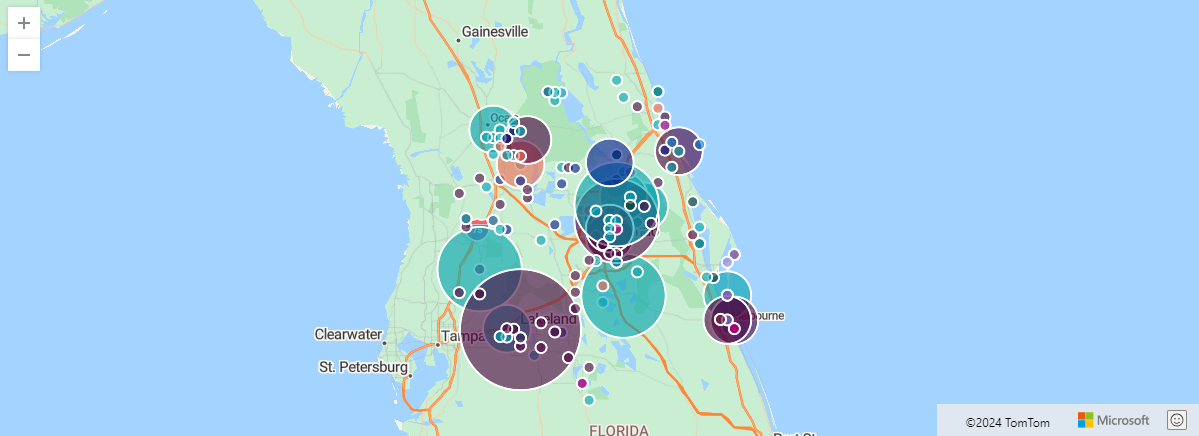
示例:使用颜色轴可视化气泡图
以下示例显示由 s2 单元格聚合的风暴事件。 该图表在气泡图中按位置聚合事件。 所有事件的颜色轴(“计数”)相同,正因如此,气泡是由 render 运算符生成的。
StormEvents
| project BeginLon, BeginLat, EventType
| where geo_point_in_circle(BeginLon, BeginLat, real(-81.3891), 28.5346, 1000 * 100)
| summarize count() by EventType, hash = geo_point_to_s2cell(BeginLon, BeginLat)
| project geo_s2cell_to_central_point(hash), count_
| extend Events = "count"
| render piechart with (kind = map) // pie map rendering available only in Kusto Explorer desktop
相关内容
- 地理空间聚类分析
- Render 运算符
- 查看地理空间聚类分析的用例:汽车测试车队的数据分析
- 了解用于地理空间数据处理和分析的 Azure 体系结构