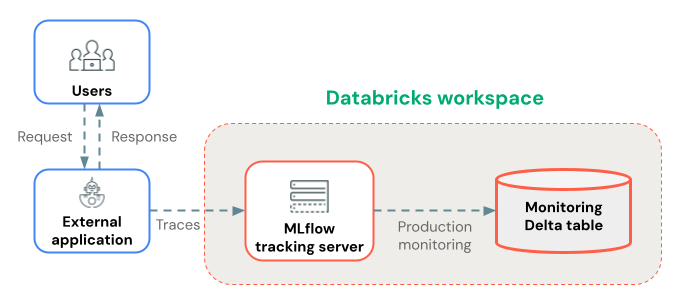
MLflow 追踪通过捕获执行详细信息并将其发送到您的 Databricks 工作区,为部署在 Databricks 外部的生产级 GenAI 代理提供全面的可观测性,您可以在 MLflow UI 中查看这些信息。
本页介绍如何在 Databricks 外部部署已启用跟踪的代理。 如果使用 Databricks 模型服务部署代理,请参阅使用自定义代理进行部署(建议)。
先决条件
安装所需程序包。 下表描述了你的选项:
| Package | 建议的用例 | 优点 |
|---|---|---|
mlflow-tracing
Python SDK 或 TypeScript SDK |
生产部署 | 为了精简和快速部署,依赖极小 针对性能进行了优化,以实现大批量跟踪 专注于用于生产监控的客户端跟踪 |
mlflow[databricks] |
开发和试验 | 完整的 MLflow 试验功能集(UI、以 LLM 为准、开发工具等) 包括所有开发工具和实用工具 |
## Install mlflow-tracing for production deployment tracing
%pip install --upgrade mlflow-tracing

## Install mlflow for experimentation and development
%pip install --upgrade "mlflow[databricks]>=3.1"
基本跟踪设置
将您的应用程序部署配置为连接到 Databricks 工作区,以便 Databricks 可以收集跟踪数据。
配置以下环境变量:
# Required: Set the Databricks workspace host and authentication token
export DATABRICKS_HOST="https://your-workspace.cloud.databricks.com"
export DATABRICKS_TOKEN="your-databricks-token"

# Required: Set MLflow Tracking URI to "databricks" to log to Databricks
export MLFLOW_TRACKING_URI=databricks

# Required: Configure the experiment name for organizing traces (must be a workspace path)
export MLFLOW_EXPERIMENT_NAME="/Shared/production-genai-app"
部署示例
设置环境变量后,将其传递给应用程序。 单击选项卡可了解如何将连接详细信息传递到不同的框架。
Docker
对于 Docker 部署,请通过容器配置传递环境变量:
# Dockerfile
FROM python:3.11-slim

# Install dependencies
COPY requirements.txt .
RUN pip install -r requirements.txt

# Copy application code
COPY . /app
WORKDIR /app

# Set default environment variables (can be overridden at runtime)
ENV DATABRICKS_HOST=""
ENV DATABRICKS_TOKEN=""
ENV MLFLOW_TRACKING_URI=databricks
ENV MLFLOW_EXPERIMENT_NAME="/Shared/production-genai-app"

CMD ["python", "app.py"]
使用环境变量运行容器:
docker run -d \
  -e DATABRICKS_HOST="https://your-workspace.cloud.databricks.com" \
  -e DATABRICKS_TOKEN="your-databricks-token" \
  -e MLFLOW_TRACKING_URI=databricks \
  -e MLFLOW_EXPERIMENT_NAME="/Shared/production-genai-app" \
  -e APP_VERSION="1.0.0" \
  your-app:latest
Kubernetes
对于 Kubernetes 部署,请使用 ConfigMaps 和 Secrets 传递环境变量:
# configmap.yaml
apiVersion: v1
kind: ConfigMap
metadata:
  name: databricks-config
data:
  DATABRICKS_HOST: 'https://your-workspace.cloud.databricks.com'
  MLFLOW_TRACKING_URI: databricks
  MLFLOW_EXPERIMENT_NAME: '/Shared/production-genai-app'

---
# secret.yaml
apiVersion: v1
kind: Secret
metadata:
  name: databricks-secrets
type: Opaque
stringData:
  DATABRICKS_TOKEN: 'your-databricks-token'

---
# deployment.yaml
apiVersion: apps/v1
kind: Deployment
metadata:
  name: genai-app
spec:
  template:
    spec:
      containers:
        - name: app
          image: your-app:latest
          envFrom:
            - configMapRef:
                name: databricks-config
            - secretRef:
                name: databricks-secrets
          env:
            - name: APP_VERSION
              value: '1.0.0'
验证收集到的跟踪数据
在部署应用后,请确认已正确收集跟踪信息:
import mlflow
from mlflow.client import MlflowClient
import os

# Ensure MLflow is configured for Databricks
mlflow.set_tracking_uri("databricks")

# Check connection to MLflow server
client = MlflowClient()
try:
    # List recent experiments to verify connectivity
    experiments = client.search_experiments()
    print(f"Connected to MLflow. Found {len(experiments)} experiments.")

    # Check if traces are being logged
    traces = mlflow.search_traces(
        experiment_names=[os.getenv("MLFLOW_EXPERIMENT_NAME", "/Shared/production-genai-app")],
        max_results=5
    )
    print(f"Found {len(traces)} recent traces.")
except Exception as e:
    print(f"Error connecting to MLflow: {e}")
    print(f"Check your authentication and connectivity")
使用生产监控长期存储跟踪数据
将跟踪记录到 MLflow 试验后,可以使用 生产环境监控(测试版)将它们长期存储在 Delta 表中。
生产监控在跟踪存储中的优点:
- 持久存储:在 Delta 表中存储跟踪,以便在 MLflow 试验项目生命周期之外长期保留。
- 无跟踪大小限制:与备用存储方法不同,生产监视处理任何大小的跟踪。
- 自动化质量评估:在生产跟踪上运行 MLflow 评分程序以持续监视应用程序质量。
- 快速同步:跟踪大约每 15 分钟同步到 Delta 表。
后续步骤
当您的代理部署到 Databricks MLflow 服务器并启用跟踪日志记录后,您可以查看、丰富和分析您的跟踪数据:
- 在 Databricks MLflow UI 中查看跟踪 - 在 MLflow UI 中查看跟踪。
- 生产监控 - 在 Delta 表中存储跟踪数据以实现长期保留,然后使用评分工具自动进行评估。
- 将上下文添加到跟踪,包括用户或会话 ID、自定义标记或用户反馈,以改进调试和见解。