Tutorial: Monitor a Windows virtual machine in Azure
Applies to: ✔️ Windows VMs ✔️ Flexible scale sets
Azure monitoring uses agents to collect boot and performance data from Azure VMs, store this data in Azure storage, and make it accessible through portal, the Azure PowerShell module, and Azure CLI. Advanced monitoring is delivered with Azure Monitor for VMs by collecting performance metrics, discover application components installed on the VM, and includes performance charts and dependency map.
In this tutorial, you learn how to:
- Enable boot diagnostics on a VM
- View boot diagnostics
- View VM host metrics
- Enable Azure Monitor for VMs
- View VM performance metrics
- Create an alert
The Azure Cloud Shell is a free interactive shell that you can use to run the steps in this article. It has common Azure tools preinstalled and configured to use with your account.
To open the Cloud Shell, just select Try it from the upper right corner of a code block. You can also launch Cloud Shell in a separate browser tab by going to https://shell.azure.com/powershell. Select Copy to copy the blocks of code, paste it into the Cloud Shell, and press enter to run it.
To configure Azure monitoring and update management in this tutorial, you need a Windows VM in Azure. First, set an administrator username and password for the VM with Get-Credential:
$cred = Get-Credential
Now create the VM with New-AzVM. The following example creates a VM named myVM in the EastUS location. If they do not already exist, the resource group myResourceGroupMonitorMonitor and supporting network resources are created:
New-AzVm `
    -ResourceGroupName "myResourceGroupMonitor" `
    -Name "myVM" `
    -Location "East US" `
    -Credential $cred
It takes a few minutes for the resources and VM to be created.
As Windows virtual machines boot up, the boot diagnostic agent captures screen output that can be used for troubleshooting purpose. This capability is enabled by default. The captured screenshots are stored in an Azure storage account, which is also created by default.
You can get the boot diagnostic data with the Get-AzureRmVMBootDiagnosticsData command. In the following example, boot diagnostics are downloaded to the root of the *c:* drive.
Get-AzVMBootDiagnosticsData -ResourceGroupName "myResourceGroupMonitor" -Name "myVM" -Windows -LocalPath "c:\"
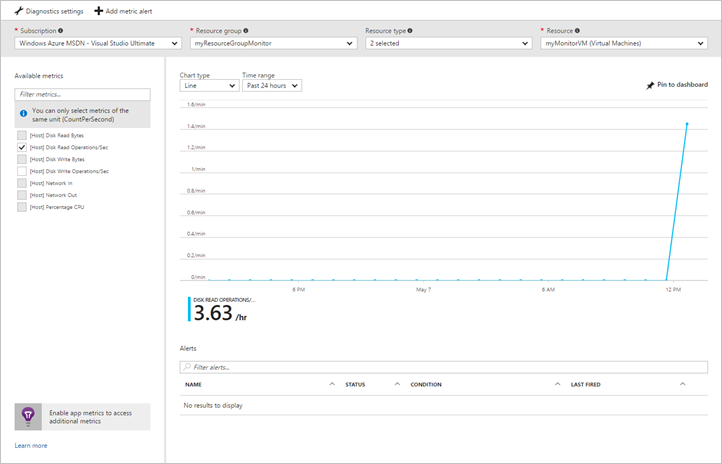
A Windows VM has a dedicated Host VM in Azure that it interacts with. Metrics are automatically collected for the Host and can be viewed in the Azure portal.
In the Azure portal, click Resource Groups, select myResourceGroupMonitor, and then select myVM in the resource list.
Click Metrics on the VM blade, and then select any of the Host metrics under Available metrics to see how the Host VM is performing.
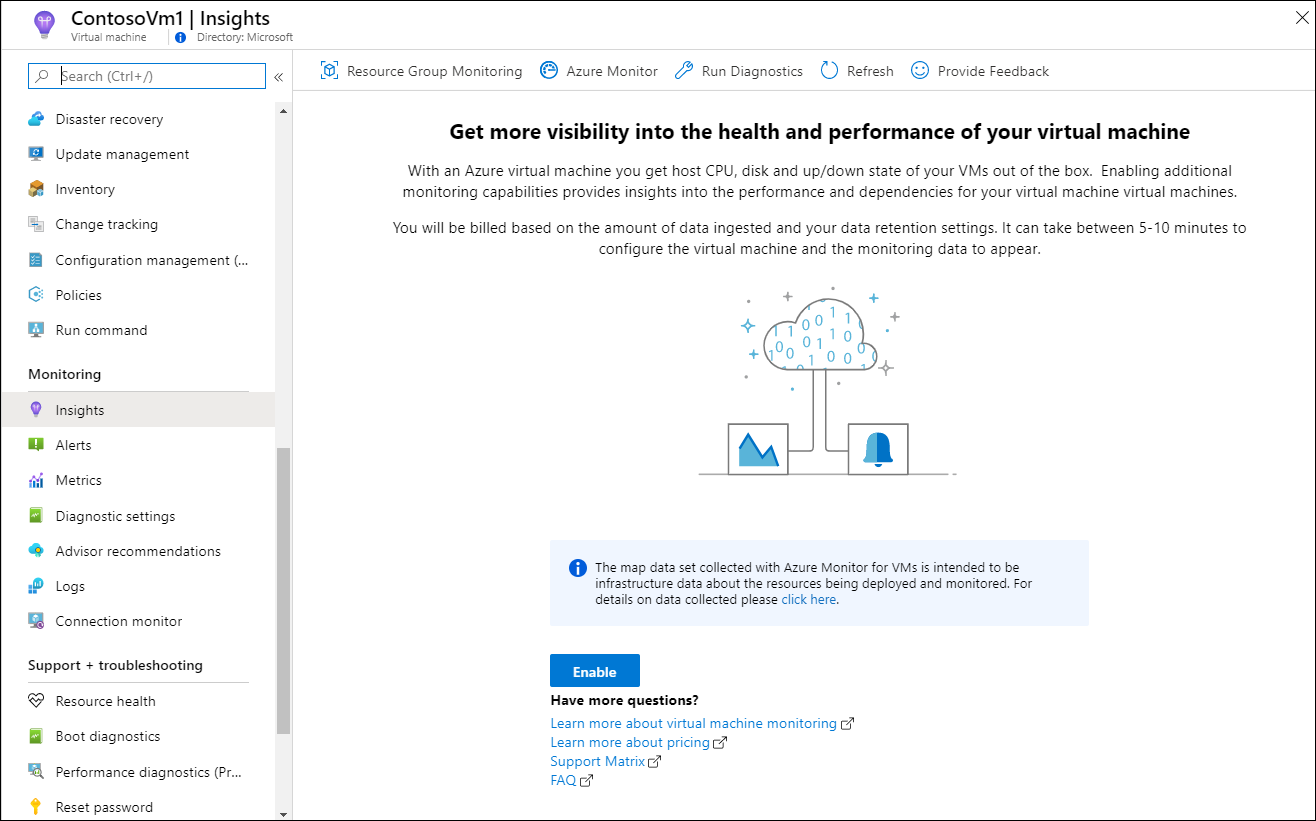
To enable monitoring of your Azure VM with Azure Monitor for VMs:
In the Azure portal, click Resource Groups, select myResourceGroupMonitor, and then select myVM in the resource list.
On the VM page, in the Monitoring section, select Insights (preview).
On the Insights (preview) page, select Try now.
On the Azure Monitor Insights Onboarding page, if you have an existing Log Analytics workspace in the same subscription, select it in the drop-down list.
The list preselects the default workspace and location where the VM is deployed in the subscription.
Note
To create a new Log Analytics workspace to store the monitoring data from the VM, see Create a Log Analytics workspace. The workspace must belong to one of the supported regions.
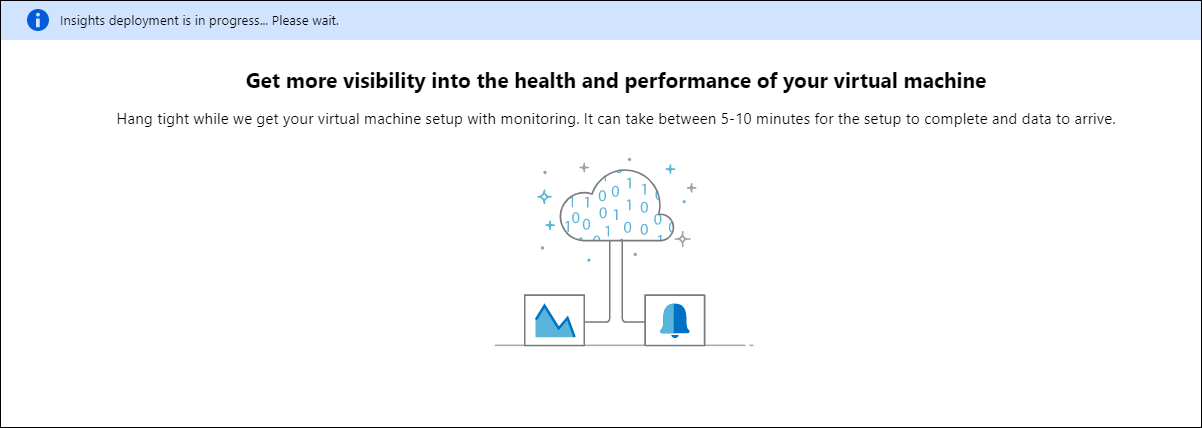
After you've enabled monitoring, you might need to wait several minutes before you can view the performance metrics for the VM.
Azure Monitor for VMs includes a set of performance charts that target several key performance indicators (KPIs) to help you determine how well a virtual machine is performing. To access from your VM, perform the following steps.
In the Azure portal, click Resource Groups, select myResourceGroupMonitor, and then select myVM in the resource list.
On the VM page, in the Monitoring section, select Insights (preview).
Select the Performance tab.
This page not only includes performance utilization charts, but also a table showing for each logical disk discovered, its capacity, utilization, and total average by each measure.
You can create alerts based on specific performance metrics. Alerts can be used to notify you when average CPU usage exceeds a certain threshold or available free disk space drops below a certain amount, for example. Alerts are displayed in the Azure portal or can be sent via email. You can also trigger Azure Automation runbooks or Azure Logic Apps in response to alerts being generated.
The following example creates an alert for average CPU usage.
In the Azure portal, click Resource Groups, select myResourceGroupMonitor, and then select myVM in the resource list.
Click Alert rules on the VM blade, then click Add metric alert across the top of the alerts blade.
Provide a Name for your alert, such as myAlertRule
To trigger an alert when CPU percentage exceeds 1.0 for five minutes, leave all the other defaults selected.
Optionally, check the box for Email owners, contributors, and readers to send email notification. The default action is to present a notification in the portal.
Click the OK button.
In this tutorial, you configured and viewed performance of your VM. You learned how to:
- Create a resource group and VM
- Enable boot diagnostics on the VM
- View boot diagnostics
- View host metrics
- Enable Azure Monitor for VMs
- View VM metrics
- Create an alert
Advance to the next tutorial to learn about Microsoft Defender for Cloud.