Note
Access to this page requires authorization. You can try signing in or changing directories.
Access to this page requires authorization. You can try changing directories.
In this article, you learn how to monitor a MongoDB cluster on Azure Kubernetes Service (AKS) using Percona Monitoring and Management (PMM). Monitoring is essential for ensuring the health and performance of your MongoDB cluster. By monitoring key metrics, you can identify issues early and take corrective actions to prevent downtime and data loss.
Set up Percona Monitoring and Management (PMM) for MongoDB
PMM operates as a client/server application, consisting of a PMM Server and multiple PMM Clients installed on each node of the database you want to monitor. The PMM Clients gather essential metrics and transmit this data to the PMM Server. You can then connect to the PMM Server to view database metrics across various dashboards.
Enable monitoring Percona Server for MongoDB with PMM
To enable monitoring for Percona Server for MongoDB, you need to make sure that the
pmm.enabledfield is set totruein the PerconaServerMongoDB custom resource. You can check this setting using thekubectl describecommand.kubectl describe PerconaServerMongoDB ${AKS_MONGODB_CLUSTER_NAME} -n ${AKS_MONGODB_NAMESPACE}Example output:
Name:         cluster-aks-mongodb
Namespace:    mongodb
...
Spec:
  ...
  Pmm:
    Enabled:      true
    Image:        <your-acr-name>.azurecr.cn/pmm-client:2.41.2
    Server Host:  monitoring-service
  ...
If the
pmm.enabledfield is set tofalse, you can enable it using thekubectl patchcommand.kubectl patch PerconaServerMongoDB ${AKS_MONGODB_CLUSTER_NAME} -n ${AKS_MONGODB_NAMESPACE} --type='merge' -p '{"spec":{"pmm":{"enabled":true}}}'
Create a node pool for PMM server
Create a dedicated node pool for the PMM server using the az aks nodepool add command.
az aks nodepool add \
--resource-group $MY_RESOURCE_GROUP_NAME \
--cluster-name $MY_CLUSTER_NAME \
--name pmmsrvpool \
--node-vm-size Standard_DS4_v2 \
--node-count 3 \
--zones 1 2 3 \
--mode User \
--output table
Create a dedicated node pool for the PMM server using terraform.
Run the following command to update the
mongodb.tfvarsfile created earlier with the following configuration:sed -i '/mongodbserver = {/,/}/s/^\( *}\)/ }, \ pmmserver = {\ name = "pmmsrvpool" \ vm_size = "Standard_D2ds_v4" \ node_count = 3 \ zones = [1, 2, 3] \ os_type = "Linux" \ }/' mongodb.tfvarsApply the terraform configuration to the target resource.
terraform fmt
terraform apply -var-file="mongodb.tfvars" -target module.default
Install PMM server
Add and update the Percona Helm repository using the
helm repo addandhelm repo updatecommands.helm repo add percona https://percona.github.io/percona-helm-charts/ helm repo updateInstall the PMM server using the
helm installcommand.helm install pmm --namespace mongodb \ --set nodeSelector."kubernetes\.azure\.com/agentpool"="pmmsrvpool" \ --set service.type="LoadBalancer" \ --version 1.3.13 \ percona/pmmGet the external IP address of the PMM server using the
kubectl get svccommand.export SERVICE_IP=$(kubectl get svc --namespace mongodb monitoring-service -o jsonpath="{.status.loadBalancer.ingress[0].ip}") echo https://$SERVICE_IP:Get the password for the admin user using the
kubectl get secretcommand.export ADMIN_PASS=$(kubectl get secret pmm-secret --namespace mongodb -o jsonpath='{.data.PMM_ADMIN_PASSWORD}' | base64 --decode)You can now access the PMM server by using the external IP address and the "admin" user password. You can also access the PMM server on your local machine using the
kubectl port-forwardcommand.kubectl port-forward svc/monitoring-service -n mongodb 8080:80Once port forwarding is enabled, you can access the PMM server by navigating to
http://localhost:8080.
Configure PMM server
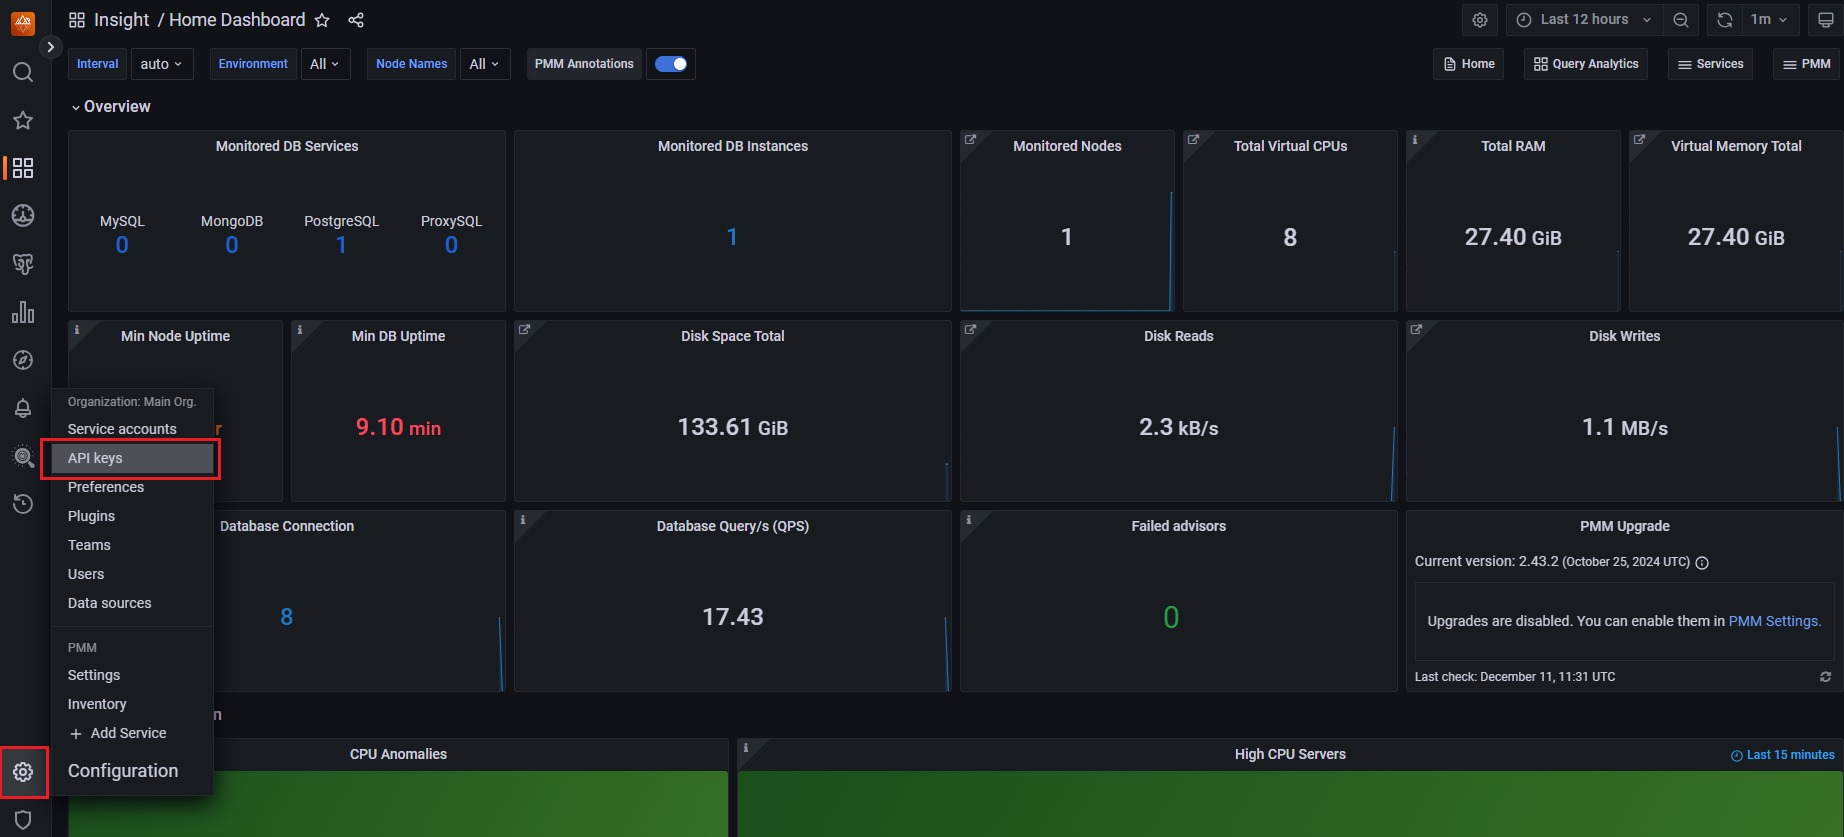
Access the PMM server using the admin user and the password you obtained earlier.
From the side menu, select Configuration > API keys.
On the Configuration page, select Add API Key.
Enter the following information:
- Key name (you can give any desired name)
- Select the Admin role from the drop-down
- Enter a value in the Time to live text box (hover on the tooltip for more information)
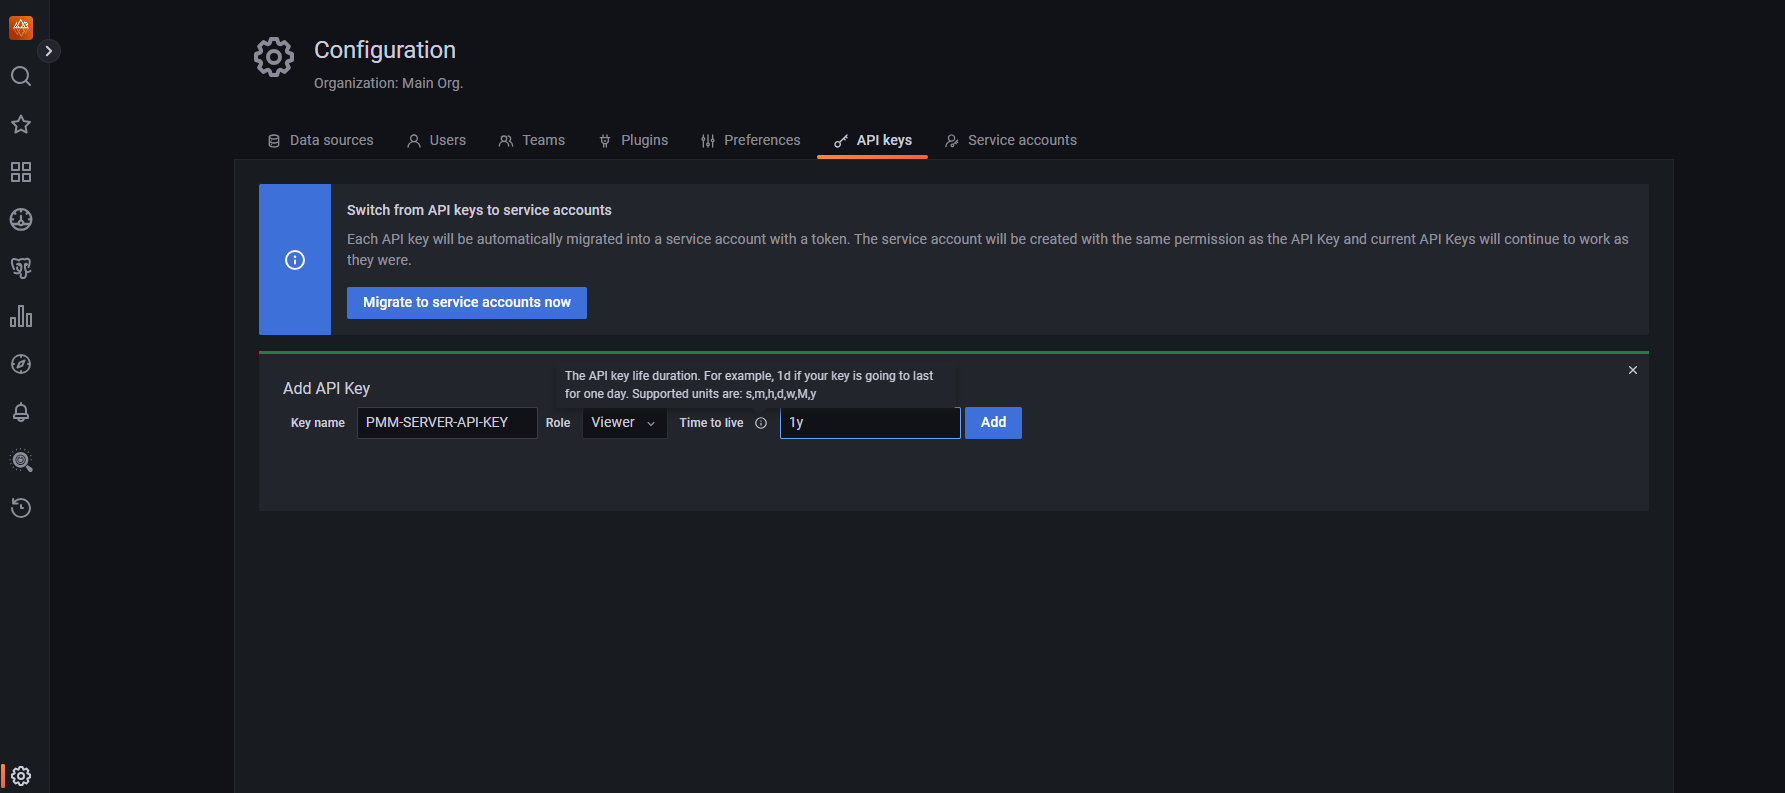
Select Add.
Copy your key from the API Key Created window and export it to the environment variable as shown below.
export API_KEY="Paste your API Key here"
Set API key as secret and refresh ExternalSecret resource with the new secret
Set the API key as a secret in Azure Key Vault using the following command.
az keyvault secret set --vault-name $MY_KEYVAULT_NAME --name PMM-SERVER-API-KEY --value $API_KEY --output none
- Run the following command to update the
mongodb.tfvarsfile created earlier and apply the terraform configuration to the target resource with the following commands:sed -i "/mongodb_kv_secrets = {/,/^ *}/s/\(PMM-SERVER-API-KEY *= *\"\)[^\"]*\"/\1$API_KEY\"/" mongodb.tfvars terraform fmt terraform apply -var-file="mongodb.tfvars" -target module.mongodb[0].azurerm_key_vault_secret.this
Refresh the secret in the ExternalSecret resource with the new secret key using the
kubectl annotatecommand.kubectl annotate es ${AKS_MONGODB_SECRETS_NAME} force-sync=$(date +%s) --overwrite -n ${AKS_MONGODB_NAMESPACE}
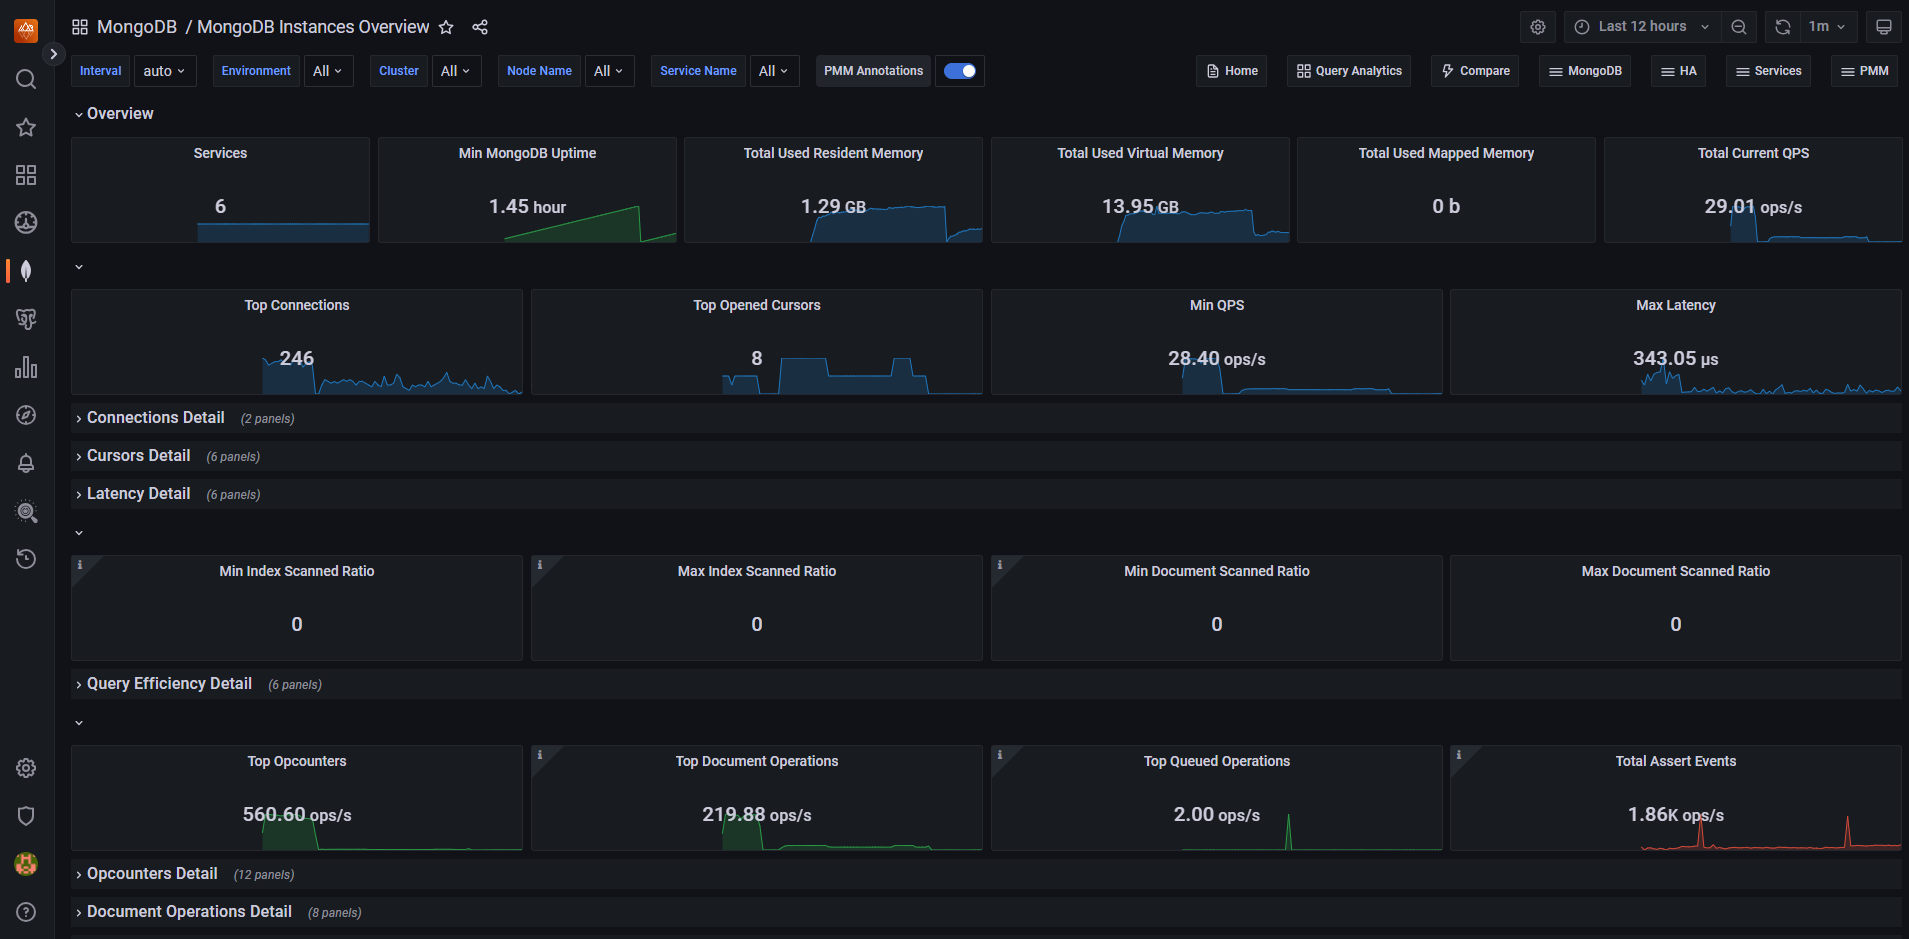
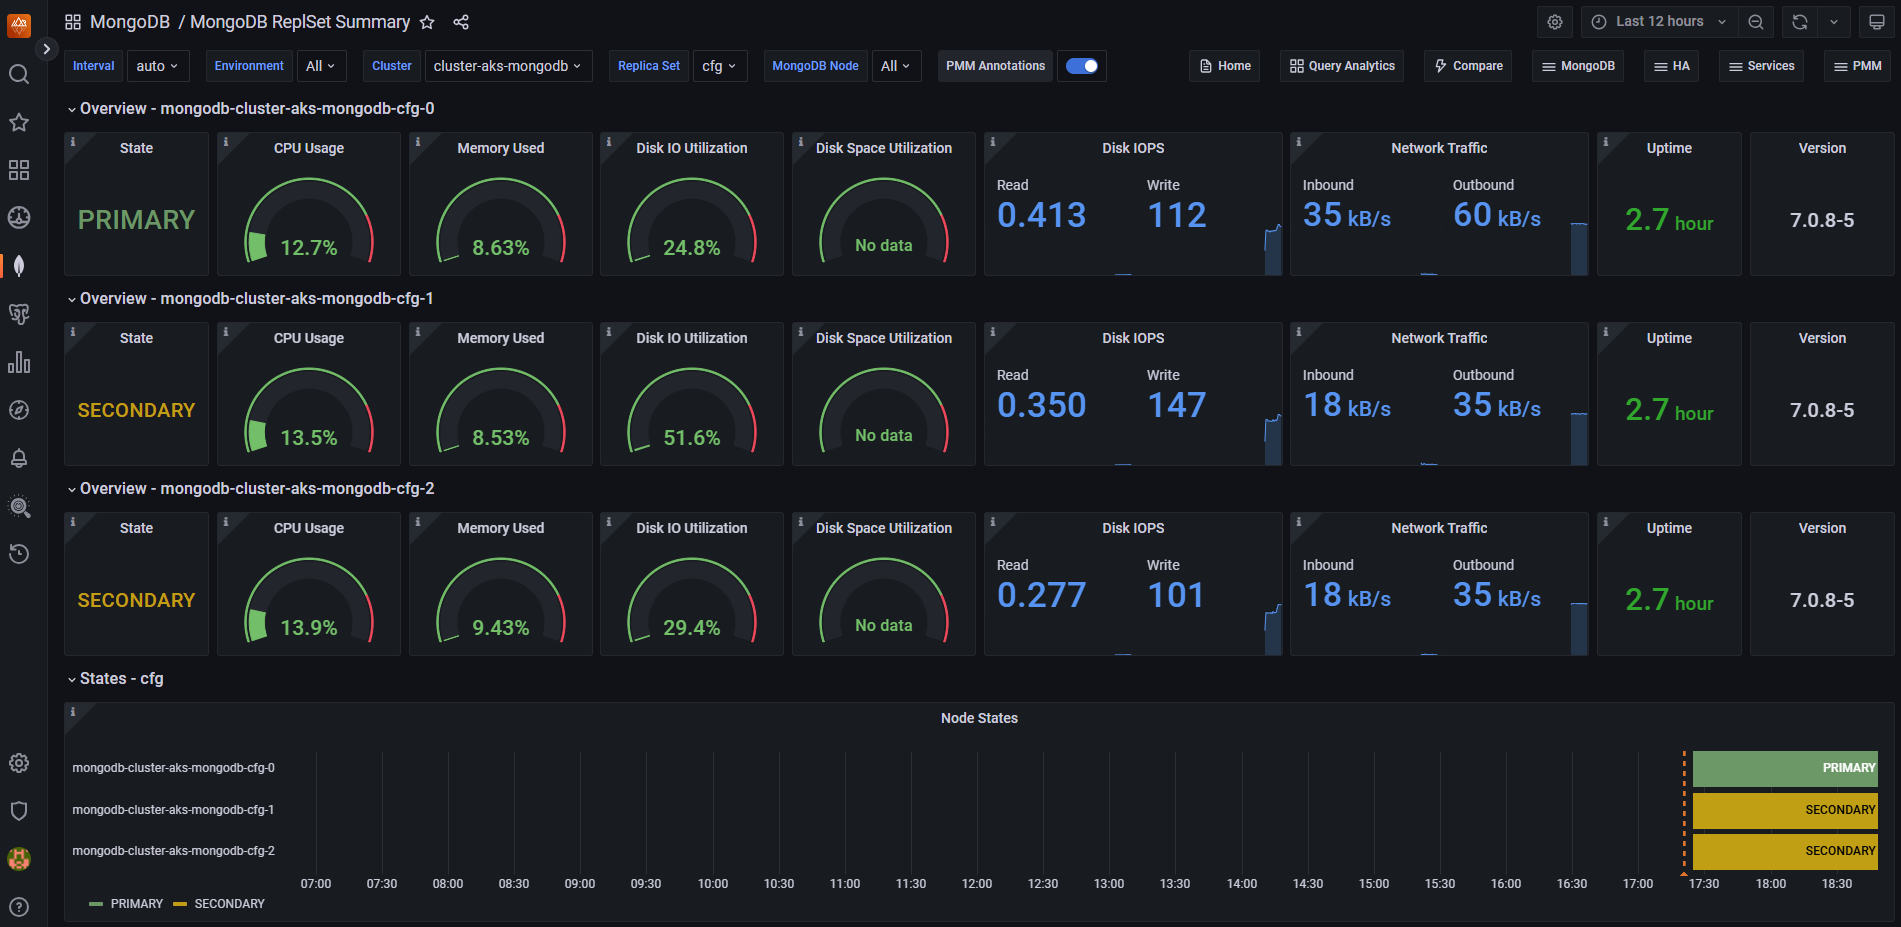
Test PMM server
Once you configure the PMM server, you can generate test data using Locust, as described in Validate resiliency of MongoDB cluster on Azure Kubernetes Service (AKS). After generating test data, you can monitor the performance of your MongoDB cluster on the PMM server.
Next steps
In this article, you learned how to monitor a MongoDB cluster on Azure Kubernetes Service (AKS) using Percona Monitoring and Management (PMM). To learn more about deploying stateful workloads on AKS, see the following articles: