Note
Access to this page requires authorization. You can try signing in or changing directories.
Access to this page requires authorization. You can try changing directories.
Note
This article describes a few suggested guidelines to help you set up your Application Gateway to handle extra traffic for any high traffic volume that may occur. The alert thresholds are purely suggestions and generic in nature. Users can determine alert thresholds based on their workload and utilization expectations.
You can use Application Gateway with Web Application Firewall (WAF) for a scalable and secure way to manage traffic to your web applications.
It's important that you scale your Application Gateway according to your traffic and with a bit of a buffer so that you're prepared for any traffic surges or spikes and minimizing the impact that it may have in your QoS. The following suggestions help you set up Application Gateway with WAF to handle extra traffic.
Please check the metrics documentation for the complete list of metrics offered by Application Gateway. See visualize metrics in the Azure portal.
Scaling for Application Gateway v1 SKU (Standard/WAF SKU)
Set your instance count based on your peak CPU usage
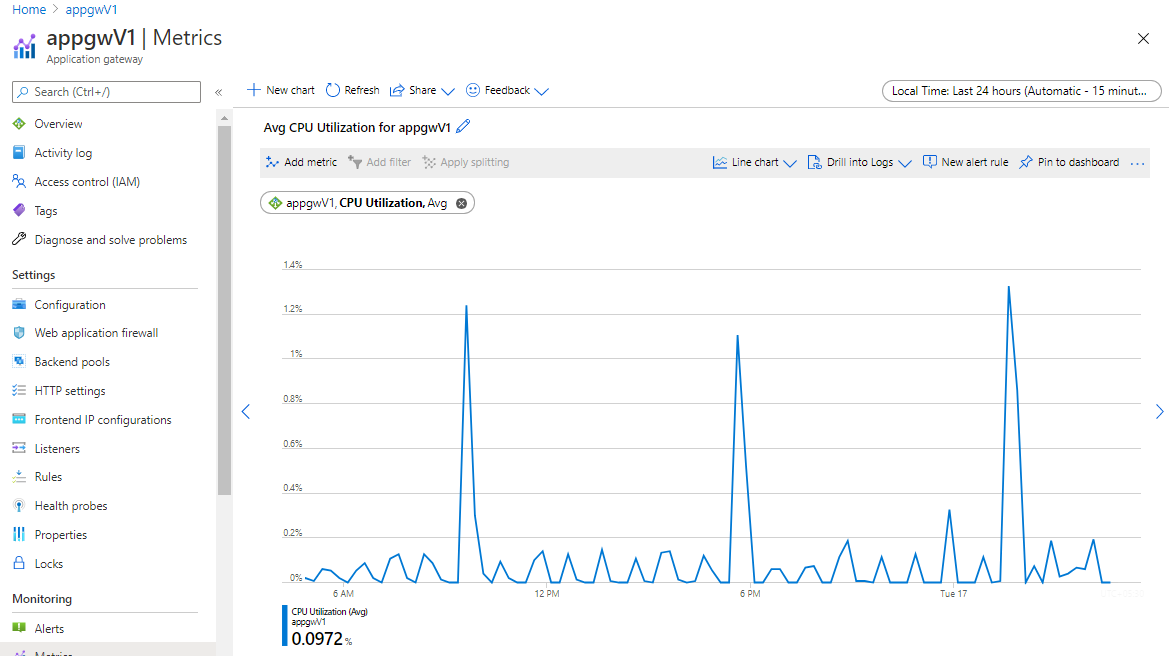
If you're using a v1 SKU gateway, you’ll have the ability to set your Application Gateway up to 32 instances for scaling. Check your Application Gateway’s CPU utilization in the past one month for any spikes above 80%, it's available as a metric for you to monitor. It's recommended that you set your instance count according to your peak usage and with a 10% to 20% additional buffer to account for any traffic spikes.
Use the v2 SKU over v1 for its autoscaling capabilities and performance benefits
The v2 SKU offers autoscaling to ensure that your Application Gateway can scale up as traffic increases. It also offers other significant performance benefits, such as 5x better TLS offload performance, quicker deployment and update times, zone redundancy, and more when compared to v1. For more information, see our v2 documentation and see our v1 to v2 migration documentation to learn how to migrate your existing v1 SKU gateways to v2 SKU.
Autoscaling for Application Gateway v2 SKU (Standard_v2/WAF_v2 SKU)
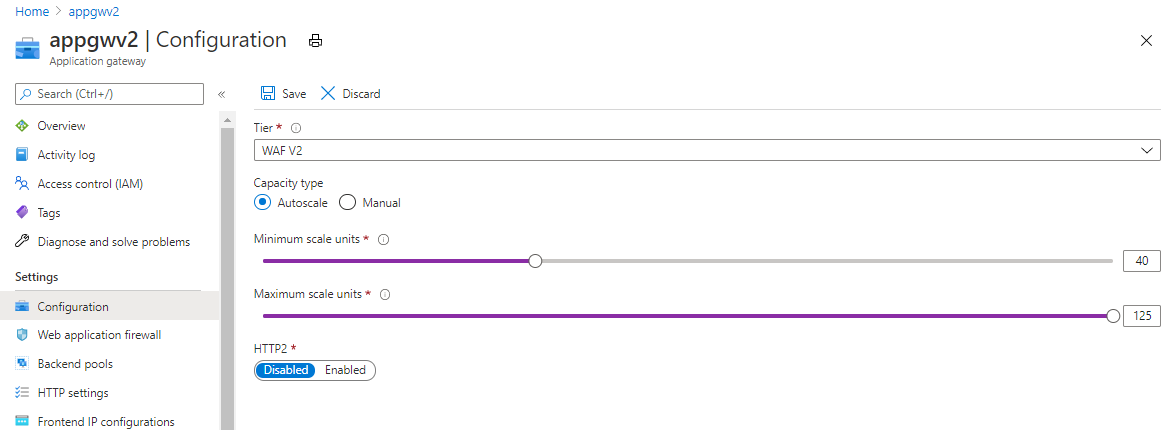
Set maximum instance count to the maximum possible (125)
For Application Gateway v2 SKU, setting the maximum instance count to the maximum possible value of 125 allows the Application Gateway to scale out as needed. This allows it to handle the possible increase in traffic to your applications. You are only be charged for the Capacity Units (CUs) you use.
Make sure to check your subnet size and available IP address count in your subnet and set your maximum instance count based on that. If your subnet doesn’t have enough space to accommodate, you must recreate your gateway in the same or different subnet which has enough capacity.
Set your minimum instance count based on your average Compute Unit usage
For Application Gateway v2 SKU, autoscaling takes three to five minutes to scale out and provision additional set of instances ready to take traffic. Until then, if there are short spikes in traffic, your existing gateway instances might get under stress and this may cause unexpected latency or loss of traffic.
It's recommended that you set your minimum instance count to an optimal level. For example, if you require 50 instances to handle the traffic at peak load, then setting the minimum 25 to 30 is a good idea rather than at <10 so that even when there are short bursts of traffic, Application Gateway would be able to handle it and give enough time for autoscaling to respond and take effect.
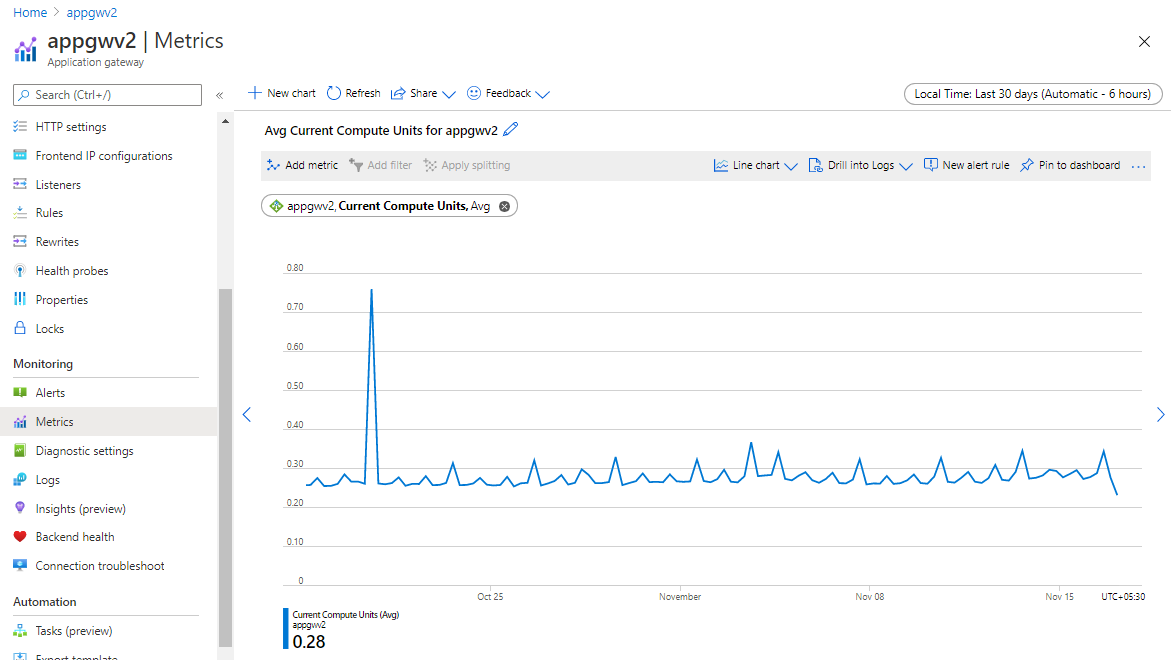
Check your Compute Unit metric for the past one month. Compute unit metric is a representation of your gateway's CPU utilization and based on your peak usage divided by 10, you can set the minimum number of instances required. Note that 1 application gateway instance can handle a minimum of 10 compute units
Manual scaling for Application Gateway v2 SKU (Standard_v2/WAF_v2)
Set your instance count based on your peak Compute Unit usage
Unlike autoscaling, in manual scaling, you must manually set the number of instances of your application gateway based on the traffic requirements. It's recommended that you set your instance count according to your peak usage and with a 10% to 20% additional buffer to account for any traffic spikes. For example, if your traffic requires 50 instances at peak, provision 55 to 60 instances to handle unexpected traffic spikes that may occur.
Check your Compute Unit metric for the past one month. Compute unit metric is a representation of your gateway's CPU utilization and based on your peak usage divided by 10, you can set the number of instances required, since 1 application gateway instance can handle a minimum of 10 compute units
Monitoring and alerting
To get notified of any traffic or utilization anomalies, you can set up alerts on certain metrics. See metrics documentation for the complete list of metrics offered by Application Gateway. See visualize metrics in the Azure portal.
To configure alerts using ARM templates, see Configure Azure Monitor alerts for Application Gateway.
Alerts for Application Gateway v1 SKU (Standard/WAF)
Alert if average CPU utilization crosses 80%
Under normal conditions, CPU usage should not regularly exceed 90%, as this may cause latency in the websites hosted behind the Application Gateway and disrupt the client experience. You can indirectly control or improve CPU utilization by modifying the configuration of the Application Gateway by increasing the instance count or by moving to a larger SKU size or doing both. Set an alert if the CPU utilization metric goes above 80% average.
Alert if Unhealthy host count crosses threshold
This metric indicates number of backend servers that application gateway is unable to probe successfully. This catches issues where Application gateway instances are unable to connect to the backend. Alert if this number goes above 20% of backend capacity. For example, if you have 30 backend servers in a backend pool, set an alert if the unhealthy host count goes above 6.
Alert if Response status (4xx, 5xx) crosses threshold
Create alert when Application Gateway response status is 4xx or 5xx. There could be occasional 4xx or 5xx response seen due to transient issues. You should observe the gateway in production to determine static threshold or use dynamic threshold for the alert.
Alert if Failed requests crosses threshold
Create alert when Failed requests metric crosses threshold. You should observe the gateway in production to determine static threshold or use dynamic threshold for the alert.
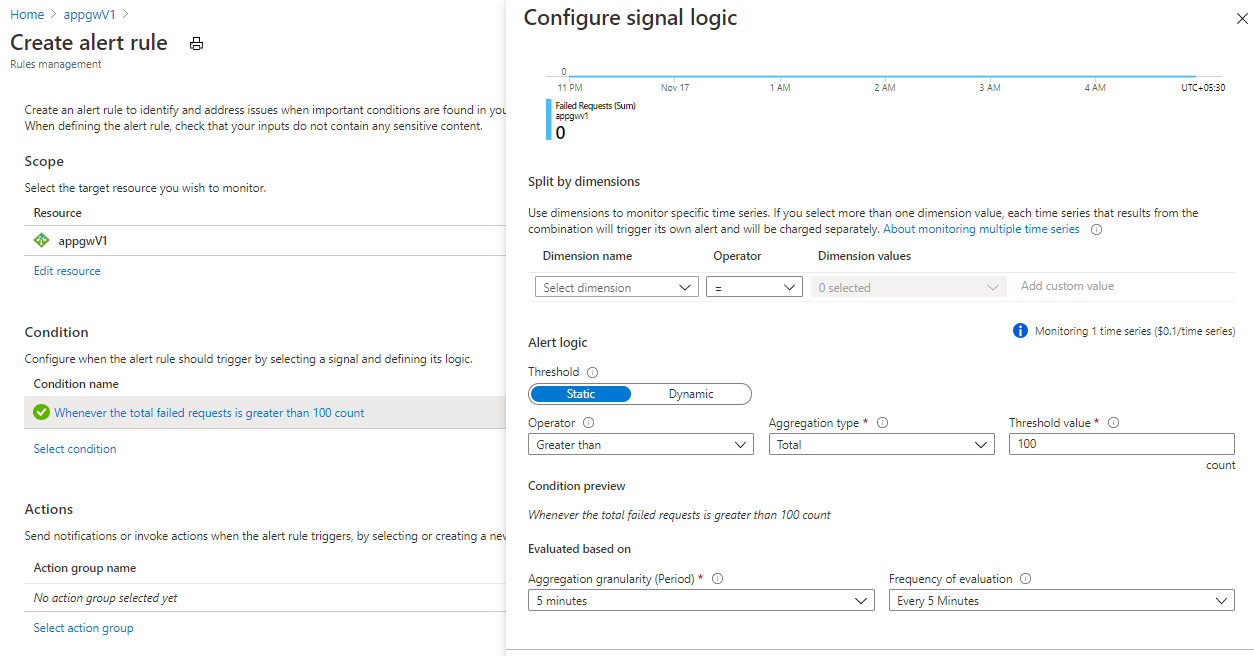
Example: Setting up an alert for more than 100 failed requests in the last 5 minutes
This example shows you how to use the Azure portal to set up an alert when the failed request count in the last 5 minutes is more than 100.
- Navigate to your Application Gateway.
- On the left panel, select Metrics under the Monitoring tab.
- Add a metric for Failed requests.
- Click on New alert rule and define your condition and actions
- Click on Create alert rule to create and enable the alert
Alerts for Application Gateway v2 SKU (Standard_v2/WAF_v2)
Alert if Compute Unit utilization crosses 75% of average usage
Compute unit's the measure of compute utilization of your Application Gateway. Check your average compute unit usage in the last one month and set alert if it crosses 75% of it. For example, if your average usage is 10 compute units, set an alert on 7.5 CUs. This alerts you if usage is increasing and gives you time to respond. You can raise the minimum if you think this traffic will be sustained to alert you that traffic may be increasing. Follow the scaling suggestions above to scale out as necessary.
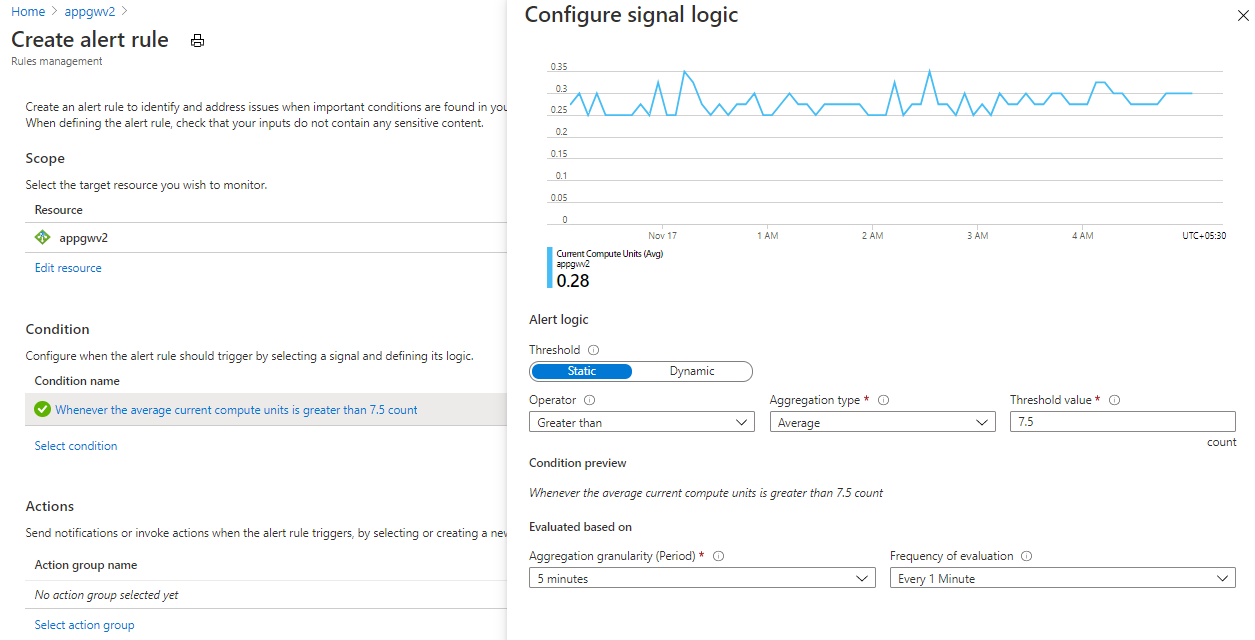
Example: Setting up an alert on 75% of average CU usage
This example shows you how to use the Azure portal to set up an alert when 75% of average CU usage is reached.
- Navigate to your Application Gateway.
- On the left panel, select Metrics under the Monitoring tab.
- Add a metric for Average Current Compute Units.
- If you've set your minimum instance count to be your average CU usage, go ahead and set an alert when 75% of your minimum instances are in use. For example, if your average usage is 10 CUs, set an alert on 7.5 CUs. This alerts you if usage is increasing and gives you time to respond. You can raise the minimum if you think this traffic will be sustained to alert you that traffic may be increasing.
Note
You can set the alert to occur at a lower or higher CU utilization percentage depending on how sensitive you want to be to potential traffic spikes.
Alert if Capacity Unit utilization crosses 75% of peak usage
Capacity units represent overall gateway utilization in terms of throughput, compute, and connection count. Check your maximum capacity unit usage in the last one month and set alert if it crosses 75% of it. For example, if your maximum usage is 100 capacity units, set an alert on 75 CUs. Follow the above two suggestions to scale out, as necessary.
Alert if Unhealthy host count crosses threshold
This metric indicates number of backend servers that application gateway is unable to probe successfully. This catches issues where Application gateway instances are unable to connect to the backend. Alert if this number goes above 20% of backend capacity. For example, if you have 30 backend servers in a backend pool, set an alert if the unhealthy host count goes above 6.
Alert if Response status (4xx, 5xx) crosses threshold
Create alert when Application Gateway response status is 4xx or 5xx. There could be occasional 4xx or 5xx response seen due to transient issues. You should observe the gateway in production to determine static threshold or use dynamic threshold for the alert.
Alert if Failed requests crosses threshold
Create alert when Failed requests metric crosses threshold. You should observe the gateway in production to determine static threshold or use dynamic threshold for the alert.
Alert if Backend last byte response time crosses threshold
This metric indicates the time interval between start of establishing a connection to backend server and receiving the last byte of the response body. Create an alert if the backend response latency is more that certain threshold from usual. For example, set this to be alerted when backend response latency increases by more than 30% from the usual value.
Alert if Application Gateway total time crosses threshold
This is the interval from the time when Application Gateway receives the first byte of the HTTP request to the time when the last response byte has been sent to the client. Should create an alert if the backend response latency is more that certain threshold from usual. For example, they can set this to be alerted when total time latency increases by more than 30% from the usual value.
Set up WAF with geo filtering and bot protection to stop attacks
If you want an extra layer of security in front of your application, use the Application Gateway WAF_v2 SKU for WAF capabilities. You can configure the v2 SKU to only allow access to your applications from a given country/region or countries/regions. You set up a WAF custom rule to explicitly allow or block traffic based on the geo location. For more information, see geo filtering custom rules and how to configure custom rules on Application Gateway WAF_v2 SKU through PowerShell.
Enable bot protection to block known bad bots. This should reduce the amount of traffic getting to your application. For more information, see bot protection with set up instructions.
Turn on diagnostics on Application Gateway and WAF
Diagnostic logs allow you to view firewall logs, performance logs, and access logs. You can use these logs in Azure to manage and troubleshoot Application Gateways. For more information, see our diagnostics documentation.
Set up a TLS policy for extra security
Ensure you're using the latest TLS policy version (AppGwSslPolicy20220101) or higher. These support a minimum TLS version of 1.2 with stronger ciphers. For more information, see configuring TLS policy versions and cipher suites via PowerShell.
