Note
Access to this page requires authorization. You can try signing in or changing directories.
Access to this page requires authorization. You can try changing directories.
Important
Azure Cache for Redis announced its retirement timeline for all SKUs. We recommend moving your existing Azure Cache for Redis instances to Azure Managed Redis as soon as you can.
Migration guidance:
For more details about the retirement:
Azure Cache for Redis offers two monitoring options in Diagnostic settings:
- Cache metrics log Azure Monitor metrics about cache operations.
- Connection logs log connections to the cache. Azure captures these logs, also called data plane logs, per request. The contents of the connection logs vary by resource type.
For an overview of Azure Monitor monitoring and logging functionality, see Diagnostic settings in Azure Monitor.
Scope of availability
| Tier | Basic, Standard, and Premium |
|---|---|
| Cache Metrics | Yes |
| Connection Logs | Yes |
Cache metrics
Azure Redis emits many useful metrics, such as Server Load and Connections per Second. For a complete listing of Azure Redis metrics, see Metrics.
To log cache metrics, enable the AllMetrics option in your cache Diagnostic settings according to the instructions for your tier. You can configure how long metrics are retained. For more information about logging and exporting metrics, see Azure Cache for Redis metrics.
Connection logs
Azure Cache for Redis uses Azure diagnostic settings to log client connection information about your cache. Logging and analyzing this information in diagnostic settings helps you understand who connects to your cache and when. You can use the log data for security auditing purposes, or to identify the scope of security issues.
Note
You can always use the redis-cli INFO or CLIENT LIST commands to check who is connected to a cache instance on-demand.
The connection log implementation and the logs produced are similar among Azure Redis tiers.
Important
- In the Basic, Standard, and Premium tiers, connection logging polls the current client connections in the cache. The same client IP addresses can appear repeatedly as long as their connections last.
Requirements and limitations
Important
When you select logs, you can choose either Categories or Category groups, which are predefined groupings of logs across Azure services. If you use Category groups, you can't configure retention settings. If you need to set retention duration for your connection logs, select the item in Categories instead. For more information, see Category groups.
Log destinations
When you enable diagnostic settings for your Azure Redis instance, you can send resource logs to the following destinations:
Send to Log Analytics workspace. The workspace doesn't need to be in the same region as the resource being monitored.
Archive to a storage account. The storage account must be in the same region as the cache.
Stream to an event hub. The event hub must be in the same region as the cache.
Diagnostic settings can't access event hub resources if virtual networks are enabled. Enable the Allow trusted Microsoft services to bypass this firewall setting in Azure Event Hubs to grant access to event hub resources.
When you send diagnostic logs to a storage account or event hub, you're charged normal data rates for either destination. You're billed under Azure Monitor, not Azure Cache for Redis. When you send logs to Log Analytics, you're charged only for Log Analytics data ingestion. For more pricing information, see Azure Monitor pricing.
Enable diagnostic settings using the Azure portal
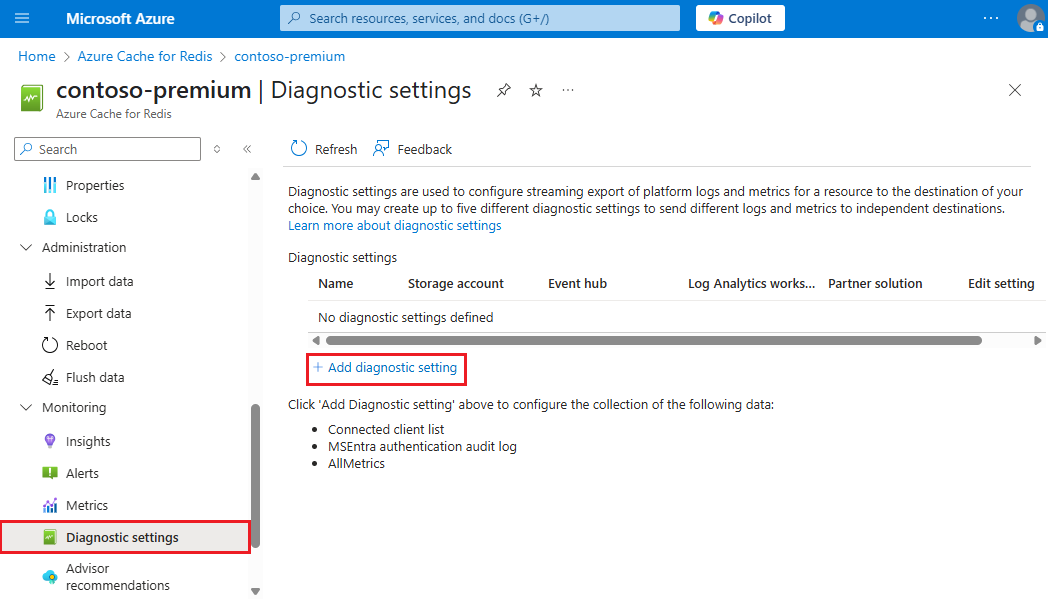
On the Azure portal page for your cache, select Diagnostic settings under Monitoring in the left navigation pane.
On the Diagnostic settings page, select Add diagnostic setting.
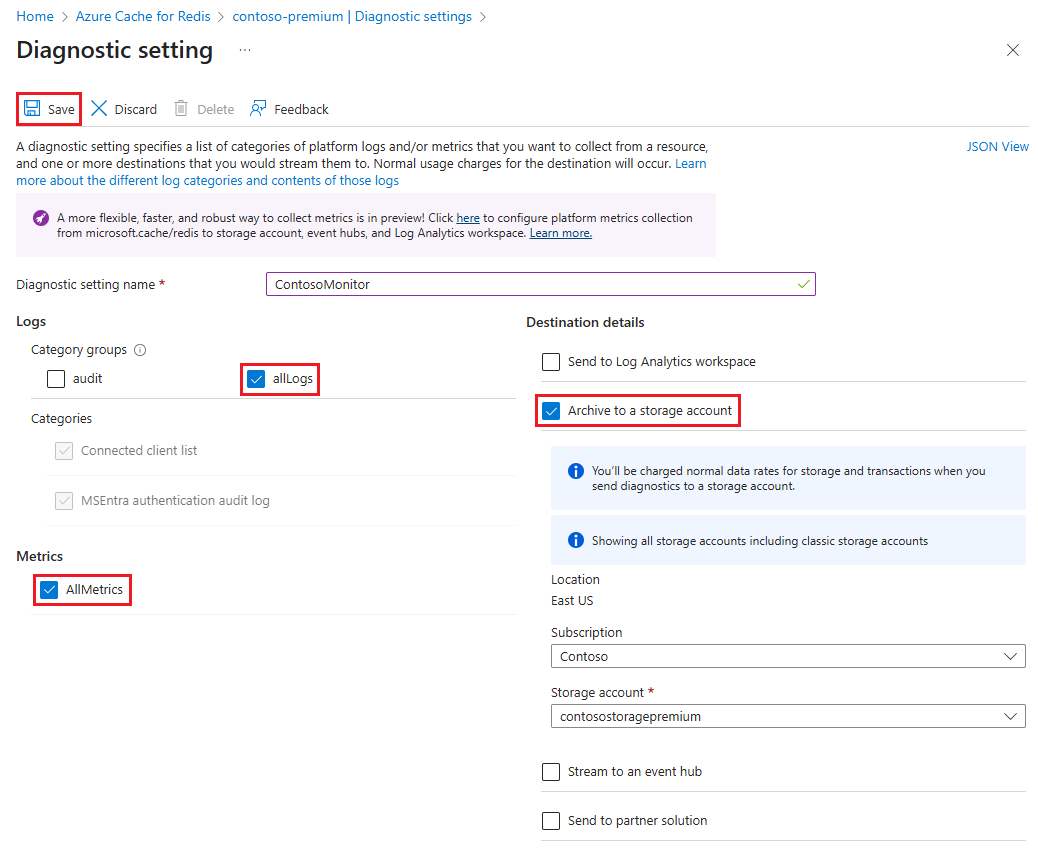
On the Diagnostic setting page, enter a name for your diagnostic setting, and then select the monitoring options you want. For example, select AllMetrics to log all metrics and allLogs to log both Connected client list and MSEntra authentication audit log.
Select one or more destinations and your destination details, and then select Save.
Enable connection logging using the REST API
To create a diagnostic setting, use the Azure Monitor REST API in an interactive console as follows. For more information, see Diagnostic Settings - Create or update.
Enable connection logging using Azure CLI
Use the Azure CLI az monitor diagnostic-settings create command to create a diagnostic setting. For more information on command and parameter descriptions, see Create diagnostic settings to send platform logs and metrics to different destinations.
The following example shows how to use the Azure CLI to stream data to four different endpoints:
Connection log contents
Related content
For detailed information about how to create a diagnostic setting by using the Azure portal, Azure CLI, or Azure PowerShell, see Create diagnostic settings to collect platform logs and metrics in Azure.