Note
Access to this page requires authorization. You can try signing in or changing directories.
Access to this page requires authorization. You can try changing directories.
This article shows you how to estimate plan costs for both the Flex Consumption plan and the legacy Consumption plan.
Choose the hosting option that best supports the feature, performance, and cost requirements for your function executions. For more information, see Azure Functions scale and hosting.
This article focuses on the two consumption plans because billing in these plans depends on active periods of executions inside each instance.
Provides fast horizontal scaling, with flexible compute options, virtual network integration, and full support for connections using Microsoft Entra ID authentication. In this plan, instances dynamically scale out based on configured per-instance concurrency, incoming events, and per-function workloads for optimal efficiency. Flex Consumption is the recommended plan for serverless hosting. For more information, see Azure Functions Flex Consumption plan hosting.
Durable Functions can also run in both of these plans. For more information about the cost considerations when using Durable Functions, see Durable Functions billing.
Consumption-based costs
The way that consumption-based costs are calculated, including free grants, depends on the specific plan. For the most current cost and grant information, see the Azure Functions pricing page.
There are two modes by which your costs are determined when running your apps in the Flex Consumption plan. Each mode is determined on a per-instance basis.
| Billing mode | Description |
|---|---|
| On Demand | When running in on demand mode, you are billed only for the amount of time your function code is executing on your available instances. In on demand mode, no minimum instance count is required. You're billed for: • The total amount of memory provisioned while each on demand instance is actively executing functions (in GB-seconds), minus a free grant of GB-s per month. • The total number of executions, minus a free grant (number) of executions per month. |
| Always ready | You can configure one or more instances, assigned to specific trigger types (HTTP/Durable/Blob) and individual functions, that are always available to handle requests. When you have any always ready instances enabled, you're billed for: • The total amount of memory provisioned across all of your always ready instances, known as the baseline (in GB-seconds). • The total amount of memory provisioned during the time each always ready instance is actively executing functions (in GB-seconds). • The total number of executions. In always ready billing, there are no free grants. |
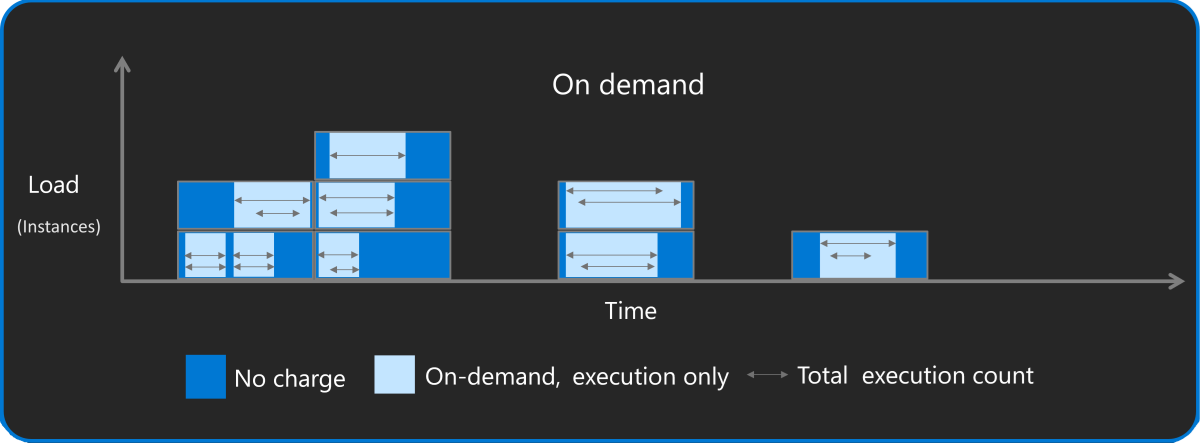
This diagram shows how on-demand costs are determined in this plan:

In addition to execution time, when you use one or more always ready instances, you pay a lower, baseline rate for the number of always ready instances you maintain. Execution time for always ready instances might be cheaper than execution time on instances with on demand execution.
Important
This article uses on-demand pricing to help you understand example calculations. Always check the current costs on the Azure Functions pricing page when estimating costs you might incur while running your functions in the Flex Consumption plan.
Consider a function app that has only HTTP triggers with these basic facts:
- HTTP triggers handle 40 constant requests per second.
- HTTP triggers handle 10 concurrent requests.
- The instance memory size is 2,048 MB.
- You configure no always ready instances, which means the app can scale to zero.
In a situation like this, pricing depends more on the kind of work done during code execution. Let's look at two workload scenarios:
CPU-bound workload: In a CPU-bound workload, there's no advantage to processing multiple requests in parallel in the same instance. This limitation means that you're better off distributing each request to its own instance so requests complete as quickly as possible without contention. In this scenario, set a low HTTP trigger concurrency of
1. With 10 concurrent requests, the app scales to a steady state of roughly 10 instances, and each instance is continuously active processing one request at a time.Because the size of each instance is ~2 GB, the consumption for a single continuously active instance is
2 GB * 3600 s = 7200 GB-s. Assuming an on-demand execution rate of $0.000026 GB-s (without any free grants applied), the cost becomes¥1.33 CNYper hour per instance. Because the CPU-bound app scales to 10 instances, the total hourly rate for execution time is¥13.33 CNY.Similarly, the on-demand per-execution charge (without any free grants) of 40 requests per second is equal to
40 * 3600 = 144,000or0.144 millionexecutions per hour. Assuming an on-demand rate of¥2.85per million executions, the total (grant-free) hourly cost of executions is0.144 * ¥2.85, which is¥0.41per hour.In this scenario, the total hourly cost of running on-demand on 10 instances is
¥13.33 + ¥0.41s = ¥13.74 CNY.IO bound workload: In an IO-bound workload, most of the application time is spent waiting on incoming request, which might be limited by network throughput or other upstream factors. Because of the limited inputs, the code can process multiple operations concurrently without negative impacts. In this scenario, assume you can process all 10 concurrent requests on the same instance.
Because consumption charges are based only on the memory of each active instance, the consumption charge calculation is simply
2 GB * 3600 s = 7200 GB-s, which at the assumed on-demand execution rate (without any free grants applied) is¥1.33 CNYper hour for the single instance.As in the CPU-bound scenario, the on-demand per-execution charge (without any free grants) of 40 requests per second is equal to
40 * 3600 = 144,000or 0.144 million executions per hour. In this case, the total (grant-free) hourly cost of executions0.144 * ¥2.85, which is¥0.41per hour.In this scenario, the total hourly cost of running on-demand a single instance is
¥1.33 + ¥0.41 = ¥1.74 CNY.
Behaviors affecting execution time
The following behaviors of your functions can affect the execution time:
Triggers and bindings: The time taken to read input from and write output to your function bindings counts as execution time. For example, when your function uses an output binding to write a message to an Azure storage queue, your execution time includes the time taken to write the message to the queue, which is included in the calculation of the function cost.
Asynchronous execution: The time that your function waits for the results of an async request (
awaitin C#) counts as execution time. The GB-second calculation is based on the start and end time of the function and the memory usage over that period. What happens over that time in terms of CPU activity isn't factored into the calculation. You might be able to reduce costs during asynchronous operations by using Durable Functions. You're not billed for time spent at awaits in orchestrator functions.
Viewing and estimating costs from metrics
In your invoice, you can view the cost-related data along with the actual billed costs. However, this invoice data is a monthly aggregate for a past invoice period.
This section shows you how to use metrics, both app-level and function executions, to estimate costs for running your function apps.
Function app-level metrics
Use Azure Monitor metrics explorer to view cost-related data for your Consumption plan function apps in a graphical format.
In the Azure portal, go to your function app.
In the left panel, scroll down to Monitoring and select Metrics.
From Metric, select Function Execution Count and Sum for Aggregation. This selection adds the sum of the execution counts during the chosen period to the chart.

Select Add metric and repeat steps 2-4 to add Function Execution Units to the chart.
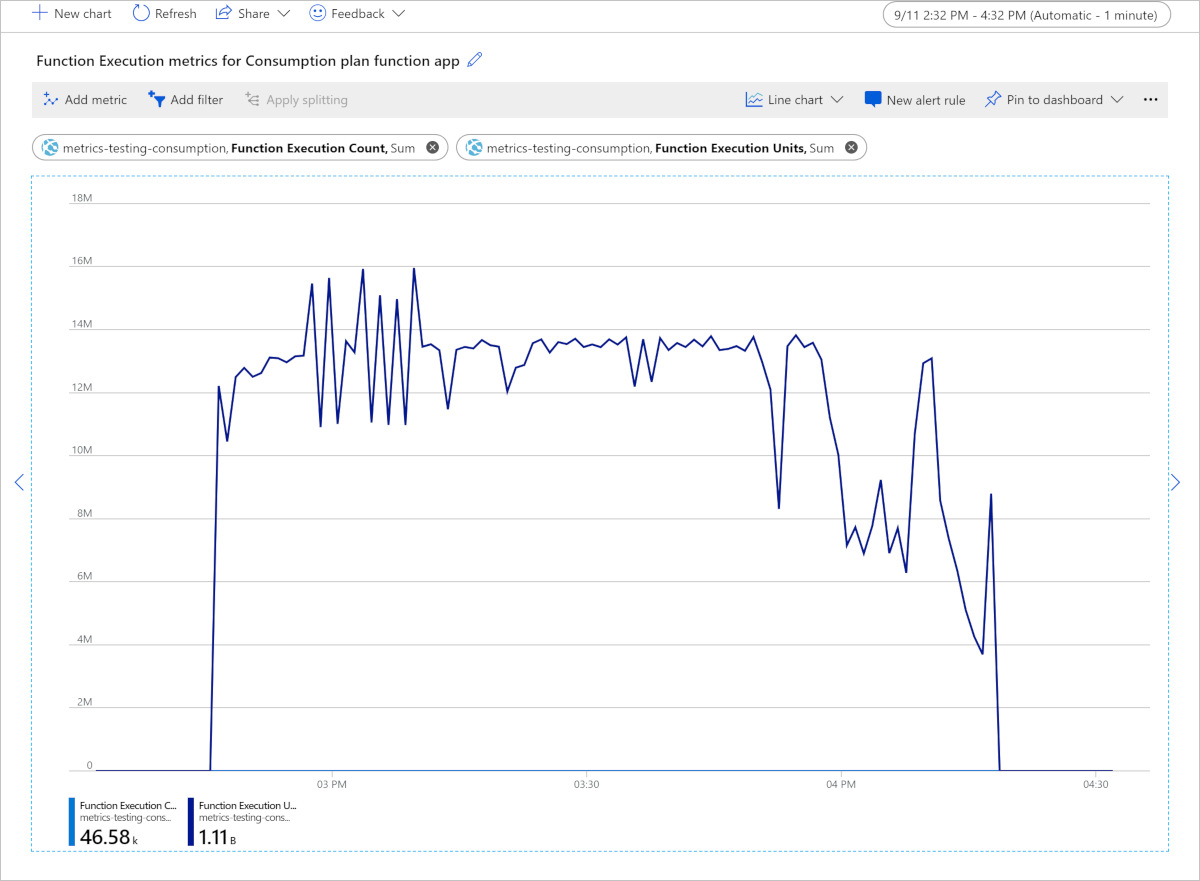
The resulting chart contains the totals for both execution metrics in the chosen time range, which in this case is two hours.

Because the number of execution units is much greater than the execution count, the chart shows only execution units.
This chart shows a total of 1.11 billion Function Execution Units consumed in a two-hour period, measured in MB-milliseconds. To convert to GB-seconds, divide by 1,024,000. In this example, the function app consumed 1,110,000,000 / 1,024,000 = 1,083.98 GB-seconds. Multiply this value by the current price of execution time on the Functions pricing page, which gives you the cost of these two hours, assuming you already used any free grants of execution time.
Function-level metrics
Memory usage is important when estimating costs of your function executions. However, the way memory usage impacts your costs depends on the specific plan type:
In the Flex Consumption plan, you pay for the time the instance runs based on your chosen instance size, which has a set memory limit. For more information, see Billing.
If you haven't already done so, enable Application Insights in your function app. With this integration enabled, you can query this telemetry data in the portal.
You can use either Azure Monitor metrics explorer in the Azure portal or REST APIs to get Monitor Metrics data.
Determine memory usage
Under Monitoring, select Logs (Analytics), then copy the following telemetry query and paste it into the query window and select Run. This query returns the total memory usage at each sampled time.
performanceCounters
| where name == "Private Bytes"
| project timestamp, name, value
The results look like the following example:
| timestamp [UTC] | name | value |
|---|---|---|
| 9/12/2019, 1:05:14.947 AM | Private Bytes | 209,932,288 |
| 9/12/2019, 1:06:14.994 AM | Private Bytes | 212,189,184 |
| 9/12/2019, 1:06:30.010 AM | Private Bytes | 231,714,816 |
| 9/12/2019, 1:07:15.040 AM | Private Bytes | 210,591,744 |
| 9/12/2019, 1:12:16.285 AM | Private Bytes | 216,285,184 |
| 9/12/2019, 1:12:31.376 AM | Private Bytes | 235,806,720 |
Determine duration
Azure Monitor tracks metrics at the resource level, which for Functions is the function app. Application Insights integration emits metrics on a per-function basis. Here's an example analytics query to get the average duration of a function:
customMetrics
| where name contains "Duration"
| extend averageDuration = valueSum / valueCount
| summarize averageDurationMilliseconds=avg(averageDuration) by name
| name | averageDurationMilliseconds |
|---|---|
| QueueTrigger AvgDurationMs | 16.087 |
| QueueTrigger MaxDurationMs | 90.249 |
| QueueTrigger MinDurationMs | 8.522 |
Other related costs
When estimating the overall cost of running your functions in any plan, remember that the Functions runtime uses several other Azure services, which are each billed separately. When you estimate pricing for function apps, any triggers and bindings you have that integrate with other Azure services require you to create and pay for those other services.
For functions running in a Consumption plan, the total cost is the execution cost of your functions, plus the cost of bandwidth and other services.
When estimating the overall costs of your function app and related services, use the Azure pricing calculator.
| Related cost | Description |
|---|---|
| Storage account | Each function app requires that you have an associated General Purpose Azure Storage account, which is billed separately. This account is used internally by the Functions runtime, but you can also use it for Storage triggers and bindings. If you don't have a storage account, one is created for you when the function app is created. To learn more, see Storage account requirements. |
| Application Insights | Functions relies on Application Insights to provide a high-performance monitoring experience for your function apps. While not required, you should enable Application Insights integration. A free grant of telemetry data is included every month. To learn more, see the Azure Monitor pricing page. |
| Network bandwidth | You can incur costs for data transfer depending on the direction and scenario of the data movement. To learn more, see Bandwidth pricing details. |