Note
Access to this page requires authorization. You can try signing in or changing directories.
Access to this page requires authorization. You can try changing directories.
The Custom Logs data source for the Log Analytics agent in Azure Monitor allows you to collect events from text files on both Windows and Linux computers. Many applications log information to text files instead of standard logging services, such as Windows Event log or Syslog. After the data is collected, you can either parse it into individual fields in your queries or extract it during collection to individual fields.
Important
This article describes how to collect a text log with the Log Analytics agent. If you're using the Azure Monitor agent, then see Collect text logs with Azure Monitor Agent.
Important
The legacy Log Analytics agent is deprecated as of August 31, 2024. Microsoft will no longer provide any support for the Log Analytics agent. If you use the Log Analytics agent to ingest data to Azure Monitor, migrate now to Azure Monitor agent.
The log files to be collected must match the following criteria:
The log must either have a single entry per line or use a timestamp matching one of the following formats at the start of each entry:
YYYY-MM-DD HH:MM:SS
M/D/YYYY HH:MM:SS AM/PM
Mon DD, YYYY HH:MM:SS
yyMMdd HH:mm:ss
ddMMyy HH:mm:ss
MMM d hh:mm:ss
dd/MMM/yyyy:HH:mm:ss zzz
yyyy-MM-ddTHH:mm:ssKThe log file must not allow circular logging. This behavior is log rotation where the file is overwritten with new entries or the file is renamed and the same file name is reused for continued logging.
The log file must use ASCII or UTF-8 encoding. Other formats such as UTF-16 aren't supported.
For Linux, time zone conversion isn't supported for time stamps in the logs.
As a best practice, the log file should include the date and time that it was created to prevent log rotation overwriting or renaming.
Note
If there are duplicate entries in the log file, Azure Monitor will collect them. The query results that are generated will be inconsistent. The filter results will show more events than the result count. You must validate the log to determine if the application that creates it is causing this behavior. Address the issue, if possible, before you create the custom log collection definition.
A Log Analytics workspace supports the following limits:
- Only 500 custom logs can be created.
- A table only supports up to 500 columns.
- The maximum number of characters for the column name is 500.
Important
Custom log collection requires that the application writing the log file flushes the log content to the disk periodically. This is because the custom log collection relies on filesystem change notifications for the log file being tracked.
Use the following procedure to define a custom log table. Scroll to the end of this article for a walkthrough of a sample of adding a custom log.
The Custom Log wizard runs in the Azure portal and allows you to define a new custom log to collect.
In the Azure portal, select Log Analytics workspaces > your workspace > Tables.
Select Create and then New custom log (MMA-based).
By default, all configuration changes are automatically pushed to all agents. For Linux agents, a configuration file is sent to the Fluentd data collector.
To start, upload a sample of the custom log. The wizard will parse and display the entries in this file for you to validate. Azure Monitor will use the delimiter that you specify to identify each record.
New Line is the default delimiter and is used for log files that have a single entry per line. If the line starts with a date and time in one of the available formats, you can specify a Timestamp delimiter, which supports entries that span more than one line.
If a timestamp delimiter is used, the TimeGenerated property of each record stored in Azure Monitor will be populated with the date and time specified for that entry in the log file. If a new line delimiter is used, TimeGenerated is populated with the date and time when Azure Monitor collected the entry.
Select Browse and browse to a sample file. This button might be labeled Choose File in some browsers.
Select Next.
The Custom Log wizard uploads the file and lists the records that it identifies.
Change the delimiter that's used to identify a new record. Select the delimiter that best identifies the records in your log file.
Select Next.
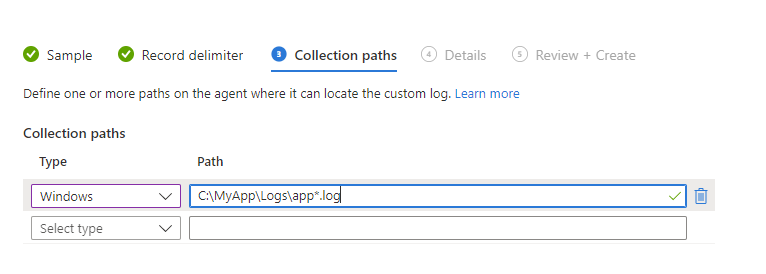
You must define one or more paths on the agent where it can locate the custom log. You can either provide a specific path and name for the log file or you can specify a path with a wildcard for the name. This step supports applications that create a new file each day or when one file reaches a certain size. You can also provide multiple paths for a single log file.
For example, an application might create a log file each day with the date included in the name as in log20100316.txt. A pattern for such a log might be log*.txt, which would apply to any log file following the application's naming scheme.
The following table provides examples of valid patterns to specify different log files.
| Description | Path |
|---|---|
| All files in C:\Logs with .txt extension on the Windows agent | C:\Logs\*.txt |
| All files in C:\Logs with a name starting with log and a .txt extension on the Windows agent | C:\Logs\log*.txt |
| All files in /var/log/audit with .txt extension on the Linux agent | /var/log/audit/*.txt |
| All files in /var/log/audit with a name starting with log and a .txt extension on the Linux agent | /var/log/audit/log*.txt |
- Select Windows or Linux to specify which path format you're adding.
- Enter the path and select the + button.
- Repeat the process for any more paths.
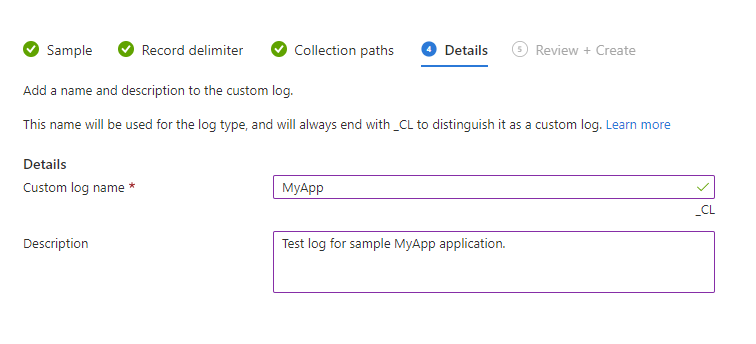
The name that you specify will be used for the log type as described. It will always end with _CL to distinguish it as a custom log.
- Enter a name for the log. The _CL suffix is automatically provided.
- Add an optional Description.
- Select Next to save the custom log definition.
It might take up to an hour for the initial data from a new custom log to appear in Azure Monitor. Azure Monitor will start collecting entries from the logs found in the path you specified from the point that you defined the custom log. It won't retain the entries that you uploaded during the custom log creation. It will collect already existing entries in the log files that it locates.
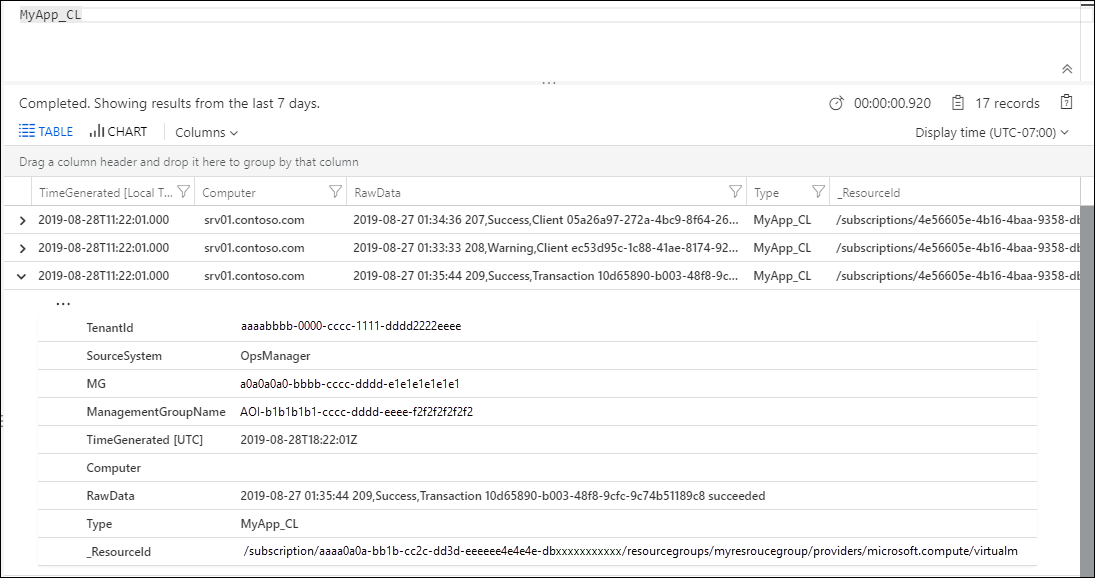
After Azure Monitor starts collecting from the custom log, its records will be available with a log query. Use the name that you gave the custom log as the Type in your query.
Note
If the RawData property is missing from the query, you might need to close and reopen your browser.
The entire log entry will be stored in a single property called RawData. You'll most likely want to separate the different pieces of information in each entry into individual properties for each record. For options on parsing RawData into multiple properties, see Parse text data in Azure Monitor.
See Delete a table.
Azure Monitor collects new entries from each custom log approximately every 5 minutes. The agent records its place in each log file that it collects from. If the agent goes offline for a period of time, Azure Monitor collects entries from where it last left off, even if those entries were created while the agent was offline.
The entire contents of the log entry are written to a single property called RawData. For methods to parse each imported log entry into multiple properties, see Parse text data in Azure Monitor.
Custom log records have a type with the log name that you provide and the properties in the following table.
| Property | Description |
|---|---|
| TimeGenerated | Date and time that the record was collected by Azure Monitor. If the log uses a time-based delimiter, this is the time collected from the entry. |
| SourceSystem | Type of agent the record was collected from. OpsManager - Windows agent, either direct connect or System Center Operations Manager Linux - All Linux agents |
| RawData | Full text of the collected entry. You'll most likely want to parse this data into individual properties. |
| ManagementGroupName | Name of the management group for System Center Operations Manager agents. For other agents, this name is AOI-<workspace ID>. |
The following section walks through an example of creating a custom log. The sample log being collected has a single entry on each line starting with a date and time and then comma-delimited fields for code, status, and message. Several sample entries are shown.
2019-08-27 01:34:36 207,Success,Client 05a26a97-272a-4bc9-8f64-269d154b0e39 connected
2019-08-27 01:33:33 208,Warning,Client ec53d95c-1c88-41ae-8174-92104212de5d disconnected
2019-08-27 01:35:44 209,Success,Transaction 10d65890-b003-48f8-9cfc-9c74b51189c8 succeeded
2019-08-27 01:38:22 302,Error,Application could not connect to database
2019-08-27 01:31:34 303,Error,Application lost connection to database
We provide one of the log files and can see the events that it will be collecting. In this case, New line is a sufficient delimiter. If a single entry in the log could span multiple lines though, a timestamp delimiter would need to be used.
The log files will be located in C:\MyApp\Logs. A new file will be created each day with a name that includes the date in the pattern appYYYYMMDD.log. A sufficient pattern for this log would be C:\MyApp\Logs\*.log.
We use a name of MyApp_CL and type in a Description.
We use a simple query of MyApp_CL to return all records from the collected log.
While custom logs are useful if your data fits the criteria listed, there are cases where you need another strategy:
- The data doesn't fit the required structure, such as having the timestamp in a different format.
- The log file doesn't adhere to requirements such as file encoding or an unsupported folder structure.
- The data requires preprocessing or filtering before collection.
In the cases where your data can't be collected with custom logs, consider the following alternate strategies:
- Use a custom script or other method to write data to Windows Events or Syslog, which are collected by Azure Monitor.
- Send the data directly to Azure Monitor by using HTTP Data Collector API.
- See Parse text data in Azure Monitor for methods to parse each imported log entry into multiple properties.
- Learn about log queries to analyze the data collected from data sources and solutions.


