Note
Access to this page requires authorization. You can try signing in or changing directories.
Access to this page requires authorization. You can try changing directories.
Use live metrics from Application Insights to monitor web applications. Select and filter metrics and performance counters to watch in real time and inspect stack traces from sample failed requests and exceptions.
With live metrics, you can:
- Validate a fix while it's released by watching performance and failure counts.
- Watch the effect of test loads and diagnose issues live.
- Focus on particular test sessions or filter out known issues by selecting and filtering the metrics you want to watch.
- Get exception traces as they happen.
- Experiment with filters to find the most relevant KPIs.
- Monitor any Windows performance counter live.
- Easily identify a server that's having issues and filter all the KPI/live feed to just that server.
Get started
Enable live metrics with Azure Monitor OpenTelemetry by following language-specific guidelines:
- ASP.NET: Not supported.
- ASP.NET Core: Enabled by default.
- Java: Enabled by default.
- Node.js: Enabled by default.
- Python: Enabled by default.
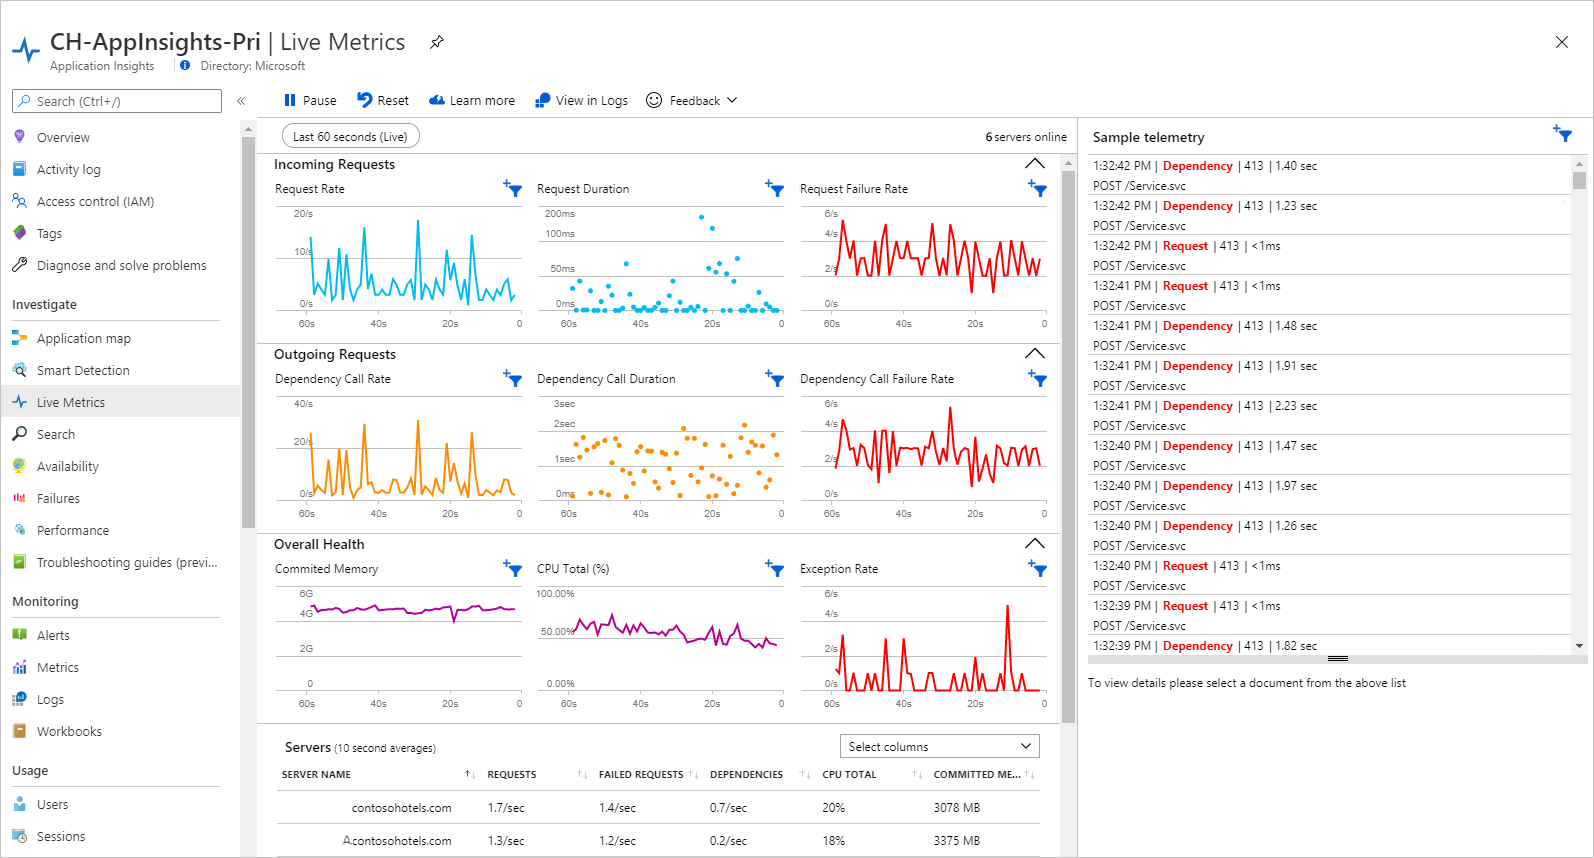
Open the Application Insights resource for your application in the Azure portal. Select Live metrics, which is listed under Investigate in the left hand menu.
Secure the control channel by enabling Microsoft Entra authentication if you use custom filters.
How do live metrics differ from metrics explorer and Log Analytics?
| Capabilities | Live Stream | Metrics explorer and Log Analytics |
|---|---|---|
| Latency | Data displayed within one second. | Aggregated over minutes. |
| No retention | Data persists while it's on the chart and is then discarded. | Data retained for 90 days. |
| On demand | Data is only streamed while the live metrics pane is open. | Data is sent whenever the SDK is installed and enabled. |
| Free | There's no charge for Live Stream data. | Subject to pricing. |
| Sampling | All selected metrics and counters are transmitted. Failures and stack traces are sampled. | Events can be sampled. |
| Control channel | Filter control signals are sent to the SDK. We recommend you secure this channel. | Communication is one way, to the portal. |
Select and filter your metrics
These capabilities are available with ASP.NET, ASP.NET Core, and Azure Functions (v2).
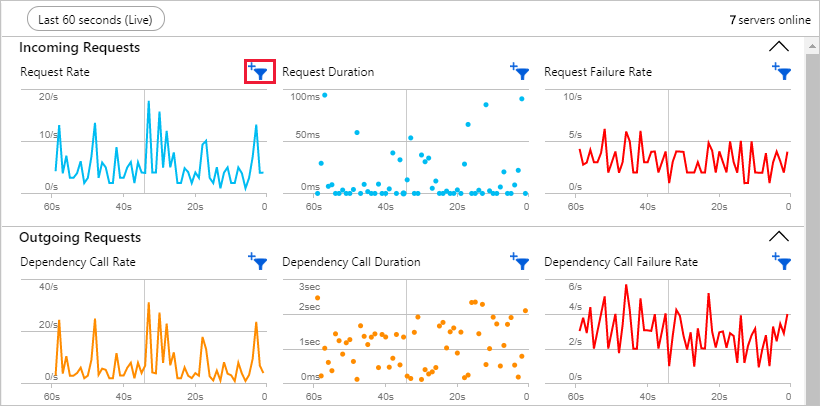
You can monitor custom performance indicators live by applying arbitrary filters on any Application Insights telemetry from the portal. Select the filter control that shows when you mouse-over any of the charts. The following chart plots a custom Request count KPI with filters on URL and Duration attributes. Validate your filters with the stream preview section that shows a live feed of telemetry that matches the criteria you've specified at any point in time.
You can monitor a value different from Count. The options depend on the type of stream, which could be any Application Insights telemetry like requests, dependencies, exceptions, traces, events, or metrics. It can also be your own custom measurement.
Along with Application Insights telemetry, you can also monitor any Windows performance counter. Select it from the stream options and provide the name of the performance counter.
Live metrics are aggregated at two points: locally on each server and then across all servers. You can change the default at either one by selecting other options in the respective dropdown lists.
Sample telemetry: custom live diagnostic events
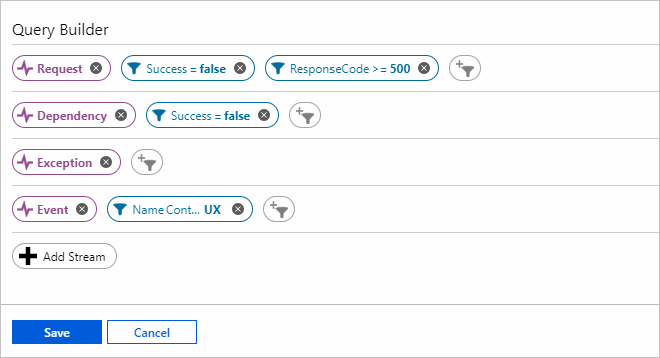
By default, the live feed of events shows samples of failed requests and dependency calls, exceptions, events, and traces. Select the filter icon to see the applied criteria at any point in time.
As with metrics, you can specify any arbitrary criteria to any of the Application Insights telemetry types. In this example, we're selecting specific request failures and events.
Note
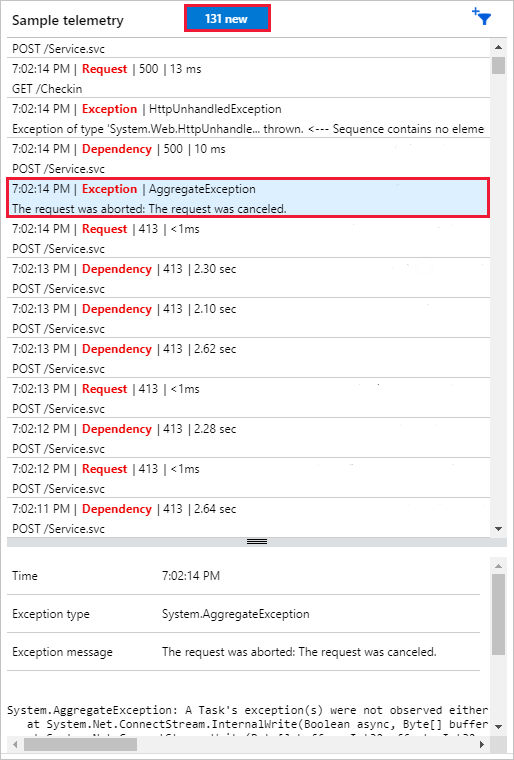
Currently, for exception message-based criteria, use the outermost exception message. In the preceding example, to filter out the benign exception with an inner exception message (follows the "<--" delimiter) "The client disconnected," use a message not-contains "Error reading request content" criteria.
To see the details of an item in the live feed, select it. You can pause the feed either by selecting Pause or by scrolling down and selecting an item. Live feed resumes after you scroll back to the top, or when you select the counter of items collected while it was paused.
Filter by server instance
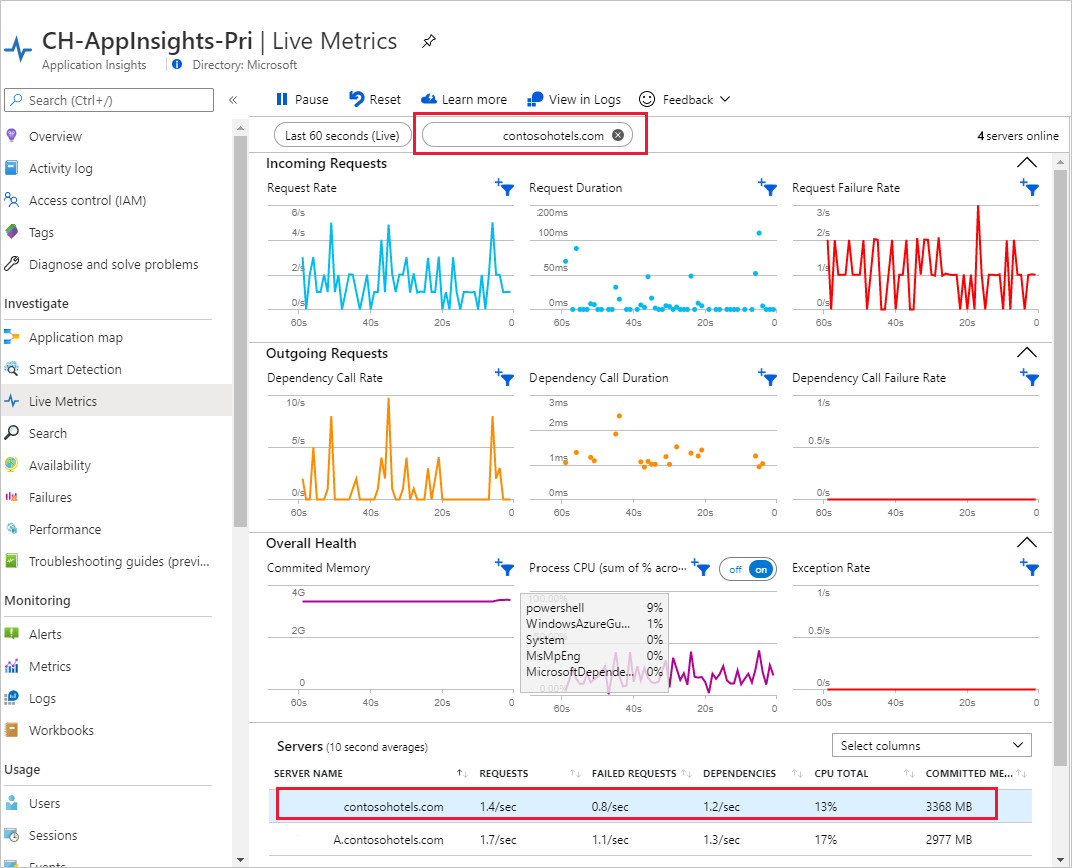
If you want to monitor a particular server role instance, you can filter by server. To filter, select the server name under Servers.
Secure the control channel
Secure the live metrics control channel by enabling Microsoft Entra authentication, which prevents unauthorized disclosure of potentially sensitive information entered into custom filters.
Note
On September 30, 2025, API keys used to stream live metrics telemetry into Application Insights will be retired. After that date, applications that use API keys won't be able to send live metrics data to your Application Insights resource. Authenticated telemetry ingestion for live metrics streaming to Application Insights will need to be done with Microsoft Entra authentication for Application Insights.
Supported features table
| Language | Basic metrics | Performance metrics | Custom filtering | Sample telemetry |
|---|---|---|---|---|
| .NET | Supported | Supported | Supported | Supported |
| Azure Functions v2 | Supported | Supported | Supported | Supported |
| Java | Supported | Supported | Not supported | Supported (V3.2.0+) |
| Node.js | Supported (V1.3.0+) | Supported (V1.3.0+) | Supported (V1.3.0+) | Supported (V1.3.0+) |
| Python | Supported (Distro version 1.6.0) | Supported (Distro version 1.8.2+) | Supported (Distro version 1.0.0+) | Supported (Distro version 1.5.0+) |
Basic metrics include request, dependency, and exception rate. Performance metrics (performance counters) include memory and CPU. Sample telemetry shows a stream of detailed information for failed requests and dependencies, exceptions, events, and traces.
PerfCounters support varies slightly across versions of .NET Core that don't target the .NET Framework:
- PerfCounters metrics are supported when running in Azure App Service for Windows (ASP.NET Core SDK version 2.4.1 or higher).
- PerfCounters are supported when the app is running on any Windows machine for apps that target .NET Core LTS or higher.
- PerfCounters are supported when the app is running anywhere (such as Linux, Windows, app service for Linux, or containers) in the latest versions, but only for apps that target .NET Core LTS or higher.
Troubleshooting
See the dedicated troubleshooting article.
