Note
Access to this page requires authorization. You can try signing in or changing directories.
Access to this page requires authorization. You can try changing directories.
This article describes how to enable and configure OpenTelemetry-based data collection within Azure Monitor Application Insights using the Azure Monitor OpenTelemetry Distro. OpenTelemetry is the open-source CNCF observability standard; the Azure Monitor OpenTelemetry Distro is Microsoft's distribution of that standard, optimized for Azure Monitor. The distro:
- Provides an OpenTelemetry distribution, which includes support for features specific to Azure Monitor.
- Enables automatic telemetry collection by including OpenTelemetry instrumentation libraries for collecting traces, metrics, logs, and exceptions.
- Allows collecting custom telemetry.
- Supports Live Metrics to monitor and collect telemetry from live, in-production web applications.
For more information about the advantages of using the Azure Monitor OpenTelemetry Distro, see Why should I use the Azure Monitor OpenTelemetry Distro.
To learn more about collecting data using OpenTelemetry, check out the Application Insights overview or the OpenTelemetry FAQ.
Follow the steps in this article to install the distro, connect it to your Application Insights resource, and verify that telemetry data flows to Azure Monitor.
Tip
For a conceptual overview of OpenTelemetry options in Azure Monitor — native OTLP ingestion, the Microsoft OpenTelemetry distro, and end-to-end observability experiences — see OpenTelemetry with Azure Monitor.
OpenTelemetry release status
OpenTelemetry offerings are available for .NET, Node.js, Python, and Java applications. For a feature-by-feature release status, see the FAQ.
Note
For Azure Function Apps, see Use OpenTelemetry with Azure Functions.
Enable OpenTelemetry with Application Insights
Follow the steps in this section to instrument your application with OpenTelemetry. Select a tab for language-specific instructions.
The following table summarizes the packages and install commands for each supported language:
| Language | Package | Install command |
|---|---|---|
| ASP.NET Core | Azure.Monitor.OpenTelemetry.AspNetCore |
dotnet add package Azure.Monitor.OpenTelemetry.AspNetCore |
| .NET | Azure.Monitor.OpenTelemetry.Exporter |
dotnet add package Azure.Monitor.OpenTelemetry.Exporter |
| Java | applicationinsights-agent-3.7.8.jar |
Download from GitHub |
| Node.js | @azure/monitor-opentelemetry |
npm install @azure/monitor-opentelemetry |
| Python | azure-monitor-opentelemetry |
pip install azure-monitor-opentelemetry |
Note
.NET covers multiple scenarios, including classic ASP.NET, console apps, Windows Forms (WinForms), and more.
Prerequisites
- Azure subscription: Create an Azure subscription for trial
- Application Insights resource: Create an Application Insights resource
- ASP.NET Core Application using an officially supported version of .NET
Tip
If you're migrating from older Application Insights SDKs, see our migration documentation.
Install the client library
Install the latest Azure.Monitor.OpenTelemetry.AspNetCore NuGet package:
dotnet add package Azure.Monitor.OpenTelemetry.AspNetCore
Modify your application
Import the Azure.Monitor.OpenTelemetry.AspNetCore namespace, add OpenTelemetry, and configure it to use Azure Monitor in your program.cs class:
// Import the Azure.Monitor.OpenTelemetry.AspNetCore namespace.
using Azure.Monitor.OpenTelemetry.AspNetCore;

var builder = WebApplication.CreateBuilder(args);

// Add OpenTelemetry and configure it to use Azure Monitor.
builder.Services.AddOpenTelemetry().UseAzureMonitor();

var app = builder.Build();

app.Run();
Copy the connection string from your Application Insights resource
The connection string is unique and specifies where the Azure Monitor OpenTelemetry Distro sends the telemetry it collects.
Tip
If you don't already have an Application Insights resource, create one following this guide. We recommend you create a new resource rather than using an existing one.
To copy the connection string:
- Go to the Overview pane of your Application Insights resource.
- Find your connection string.
- Hover over the connection string and select the Copy to clipboard icon.

Paste the connection string in your environment
To paste your connection string, use one of the following methods:
| Method | Supported languages | Recommended for |
|---|---|---|
| Environment variable | All | Production |
Configuration file (applicationinsights.json) |
Java only | Production (Java) |
| Code | ASP.NET Core, Node.js, Python | Local dev/test only |
Important
We recommend setting the connection string through code only in local development and test environments.
For production, use an environment variable or configuration file (Java only).
Set the Application Insights connection string as an environment variable (recommended for production)
Replace
<Your connection string>in the following command with your connection string.APPLICATIONINSIGHTS_CONNECTION_STRING=<Your connection string>Set the Application Insights connection string in a configuration file - Java only
Create a configuration file named
applicationinsights.json, and place it in the same directory asapplicationinsights-agent-3.7.8.jarwith the following content:{ "connectionString": "<Your connection string>" }Replace
<Your connection string>in the preceding JSON with your unique connection string.Set the Application Insights connection string in code - ASP.NET Core, Node.js, and Python only
See connection string configuration for an example of setting connection string via code.
Note
If you set the connection string in multiple places, it's resolved in the following precedence order (highest to lowest):
- Code
- Environment variable
- Configuration file
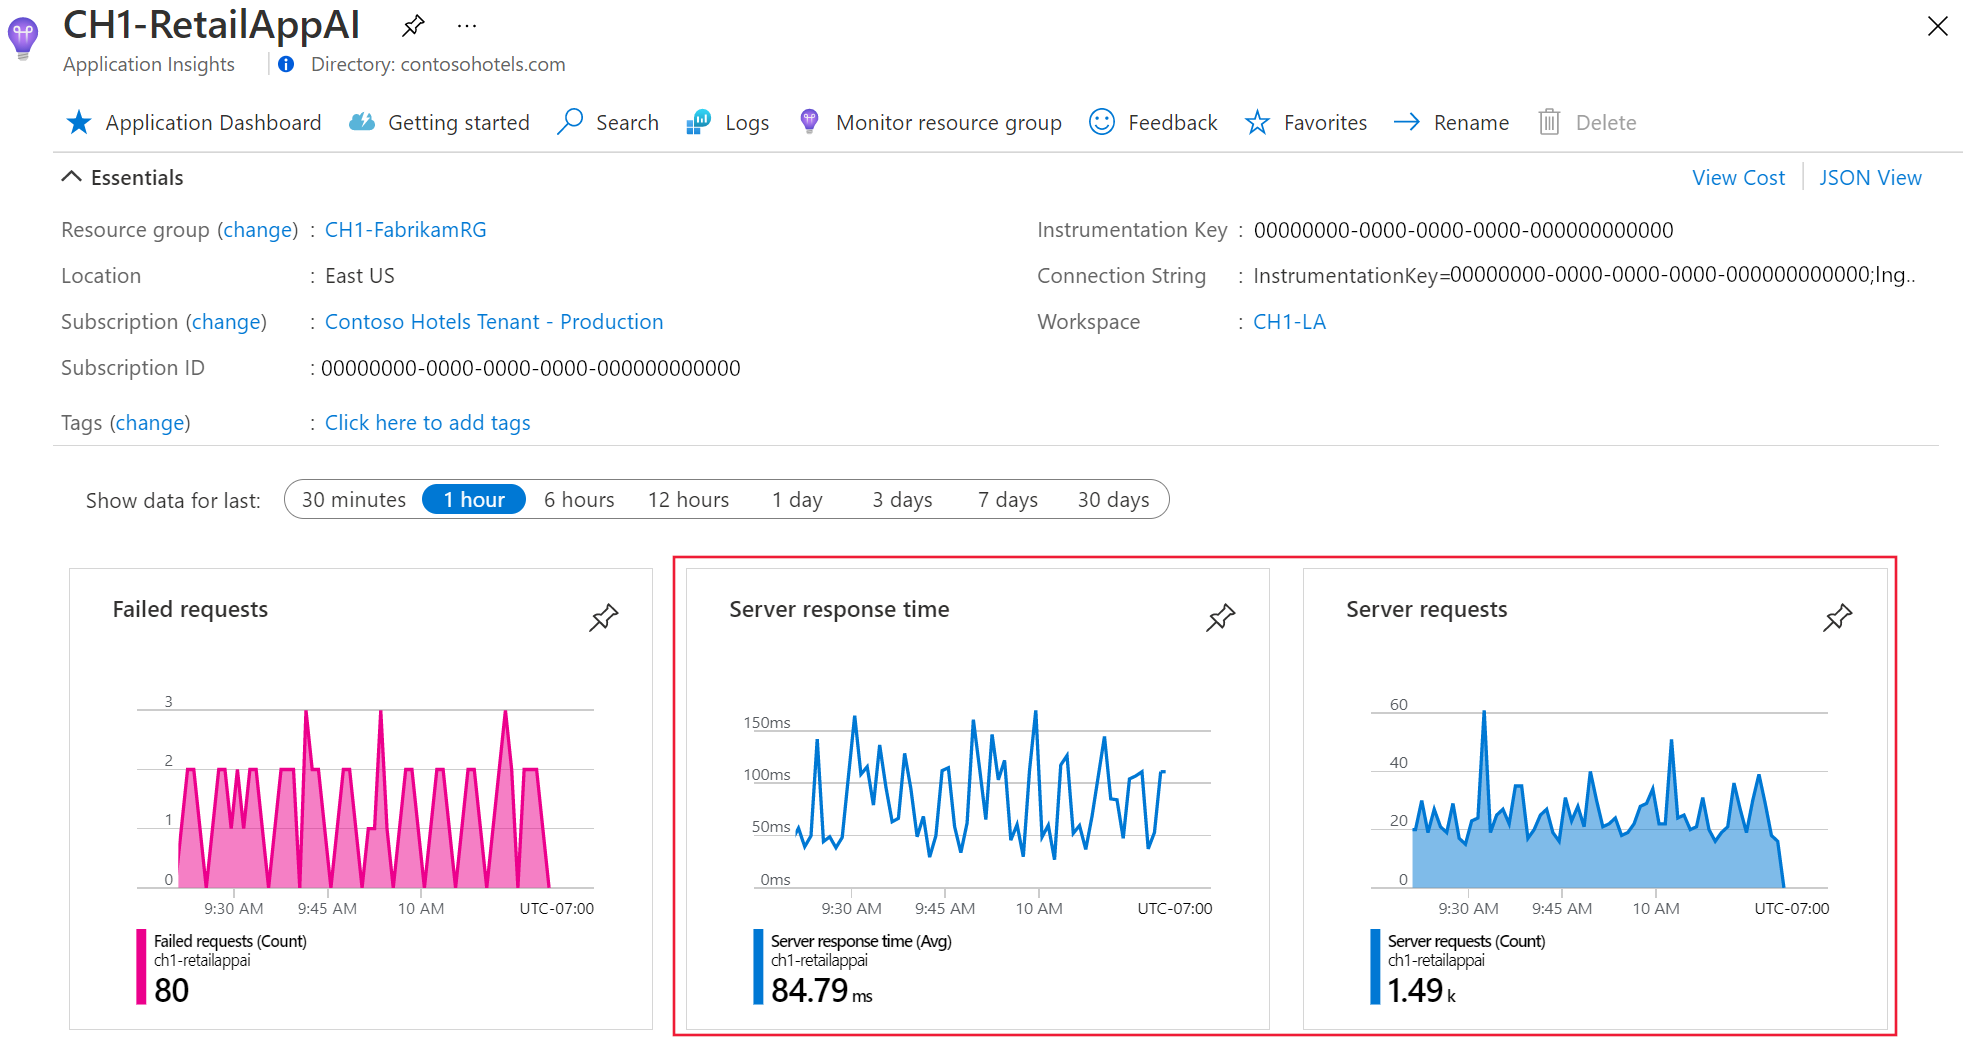
Confirm data is flowing
After you configure the Azure Monitor OpenTelemetry Distro and set the connection string, run your application and open your Application Insights resource in the Azure portal to verify that traces, metrics, and logs appear. It might take a few minutes for data to show up.
Application Insights is now enabled for your application. The following steps are optional and allow for further customization.
Note
As part of using Application Insights instrumentation, we collect and send diagnostic data to Microsoft. This data helps us run and improve Application Insights. Learn more in the Application Insights FAQ.
Important
If you have two or more services that emit telemetry to the same Application Insights resource, you're required to set Cloud Role Names to represent them properly on the Application Map.
Troubleshooting, feedback, and support
Tip
The following sections are available across all OpenTelemetry Distro articles.
Troubleshooting
For troubleshooting information, see Troubleshoot OpenTelemetry issues in .NET and Troubleshoot missing application telemetry in Azure Monitor Application Insights.
OpenTelemetry Feedback
To provide feedback:
- Tell Microsoft about yourself by joining the OpenTelemetry Early Adopter Community.
- Engage with other Azure Monitor users in the Microsoft Tech Community.
- Make a feature request at the Azure Feedback Forum.
Support
Select a tab for the language of your choice to discover support options.
- For Azure support issues, open an Azure support ticket.
- For OpenTelemetry issues, contact the OpenTelemetry .NET community directly.
- For a list of open issues related to Azure Monitor Exporter, see the GitHub Issues Page.
Next steps
- To review the source code, see the Azure Monitor ASP.NET Core GitHub repository.
- To review a sample application, see Azure Monitor OpenTelemetry for ASP.NET Core.
- To install the NuGet package, check for updates, or view release notes, see the Azure Monitor AspNetCore NuGet Package page.
- To learn more about OpenTelemetry and its community, see the OpenTelemetry .NET GitHub repository.
- To enable usage experiences, enable web or browser user monitoring.