Note
Access to this page requires authorization. You can try signing in or changing directories.
Access to this page requires authorization. You can try changing directories.
Alerting is a critical part of monitoring workloads on Azure Kubernetes Service (AKS). Advanced alerting requires Analytics-tier logs in your Log Analytics workspace, but this can be cost-prohibitive for high-volume environments or certain types of logs such as audit logs.
You can significantly reduce your data ingestion costs by converting tables holding container logs to Basic logs and leveraging other cost effective strategies of the Log Analytics platform. Azure Monitor provides options for event-driven and summary-based alerting on these tables, giving you more control over costs without sacrificing visibility into the health and behavior of your AKS workloads.
This article describes multiple strategies for alerting on AKS workloads being monitored with cost effective log configurations. These recommendations help you balance cost and performance while still meeting your operational needs and service-level objectives (SLOs).
The following table summarizes the strategies discussed in this article, including when to use them and which tables they're most applicable to:
| Strategy | When to use |
|---|---|
| Managed Prometheus alerts | When metrics are available, especially for pod, node, or container status. Metrics should be your first choice for alerting whenever possible. These alerts are real-time, scalable, and cost-effective. Only use log alerts when metrics aren't available. |
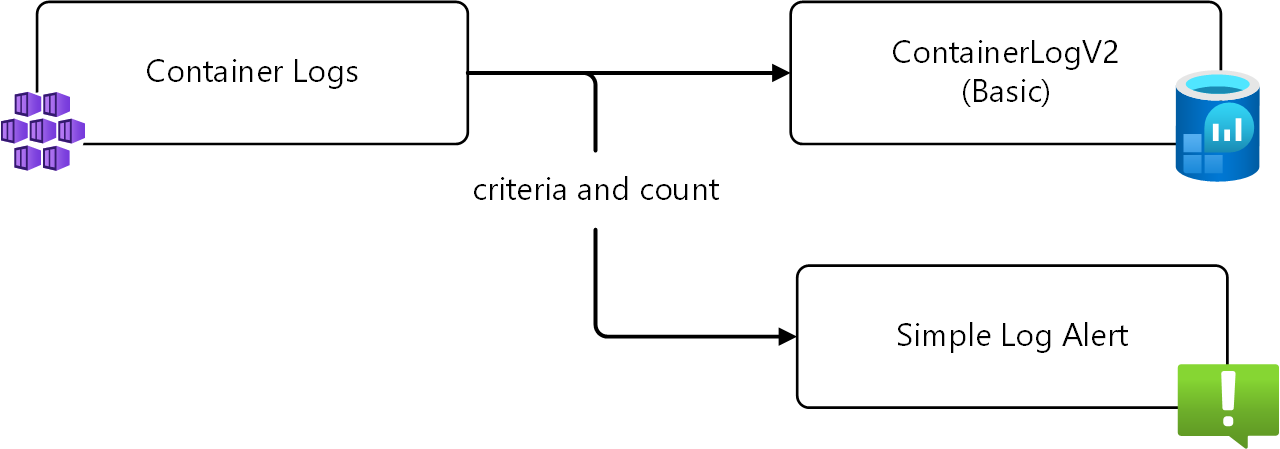
| Simple log search alert rules (preview) | When you need to monitor specific messages or patterns that aren't available with metrics. These are quick, per-occurrence log-based alerts with low complexity, such as alerting on unauthorized access errors or agent errors. They're most effective when log content carries clear critical context for a failure. |
| Analytics tier with transformations | Use for near real-time alerting on high-value log data when other methods like Summary Rules are too slow or not granular enough. Transformations allow filtering and shaping of logs before sending them to Analytics tier, reducing costs while enabling detailed alerts and dashboards. Ideal for mission-critical insights where timeliness matters. |
Managed Prometheus alerts
Whenever possible, you should prioritize alerting on metrics rather than logs, as this is typically more scalable and cost-efficient, especially in large AKS environments. Metrics are compact, purpose-built for fast evaluation, and incur lower ingestion, storage, and query costs compared to logs.
Azure Managed Prometheus enables near real-time metric ingestion and alerting without the overhead of managing your own Prometheus infrastructure. It integrates directly with your AKS clusters and supports Kubernetes-native metrics scraping using Prometheus format. Alert rules can be visualized and analyzed in Azure Managed Grafana or integrated into Azure Monitor for alert routing.
Start by enabling recommended alert rules. This includes platform metric alerts such as firing when CPU of a node exceeds a threshold. You can also enable different levels of Prometheus alerts for a variety of scenarios. In addition to the built-in alert rules, create your own custom alert rules using Prometheus metrics.
Managed Prometheus alerts can commonly be used to replace alerts from the following tables:
Simple log search alert rules (preview)
Simple log search alerts in Azure Monitor are designed to provide a simpler and faster alternative to traditional log search alerts, and they're supported on Basic Logs tables. Unlike log search alerts that aggregate rows over a defined period, simple log alerts evaluate each row individually and allow a single-condition log search. They're ideal for scenarios such as watching for a specific error event or status change.
For example, you may set a rule to fire on every occurrence of a specific error message from a cloud-based application have a cloud-based application, or you may choose to fire on any message with an error level severity.
In addition to firing on every occurrence of a message, you can also set a threshold for the number of occurrences within a specified time window. For example, you may have a message indicating a failed login and want to be alerted when the number of failed login attempts in their application in a minute exceeds a threshold. Once identified, you can use a log query on the table itself to identify the failed login attempts
Simple log search alerts are commonly used for alerting from the following tables:
Analytics tier with transformations
Summary rules may not be responsive enough if you need near-real time alerting on container logs. In operationally sensitive scenarios where near real-time log alerting is required, use a transformation to route high-value logs (such as error and critical events) to an Analytics Logs table while sending other logs to a Basic Logs or Auxiliary Logs table. Using this strategy, you can perform advanced alerting on the table in the Analytics tier while routing other data to a lower cost tier for cost-effective storage and occasional analysis.
Detailed configuration for this transformation is provided in Data transformations in Container insights.
This strategy is commonly used for alerting from the following tables:

