Note
Access to this page requires authorization. You can try signing in or changing directories.
Access to this page requires authorization. You can try changing directories.
When you enable logs-based monitoring experience for your Azure virtual machines, a default set of performance counters are collected. This set can't be modified, but you can create a data collection rule (DCR) to collect additional performance counters from the virtual machine and send them to a Log Analytics workspace.
Details for creating the DCR are provided in Collect guest log data from virtual machines with Azure Monitor. This article provides additional details for the Performance Counters data source type.
Configure data source
Create the DCR using the process in Collect guest log data from virtual machines with Azure Monitor. On the Collect and deliver tab of the DCR, select Performance Counters from the Data source type dropdown. Select from a predefined set of objects to collect and their sampling rate. The lower the sampling rate, the more frequently the value is collected.
Select Custom to specify an XPath to collect any performance counters not available with the Basic selection. Use the format \PerfObject(ParentInstance/ObjectInstance#InstanceIndex)\Counter.
Tip
If the counter name contains an ampersand (&), replace it with &. For example, \Memory\Free & Zero Page List Bytes.
Warning
Be careful when manually defining counters for DCRs that are associated with both Windows and Linux machines, since some Windows and Linux style counter names can resolve to the same metric and cause duplicate collection. For example, specifying both \LogicalDisk(*)\Disk Transfers/sec (Windows) and Logical Disk(*)\Disk Transfers/sec (Linux) in the same DCR will cause the Disk Transfers metric to be collected twice per sampling period.
This behavior can be avoided by not collecting performance counters in DCRs that don't specify a platform type. Ensure that Windows counters are only included in DCRs associated with Windows machines, and Linux counters are only included in DCRs associated with Linux machines.
Note
Microsoft.HybridCompute (Azure Arc-enabled servers) resources can't currently be viewed in Metrics Explorer, but their metric data can be acquired via the Metrics REST API (Metric Namespaces - List, Metric Definitions - List, and Metrics - List pointing to azure.vm.windows.guestmetrics as Namespace.
Add destination
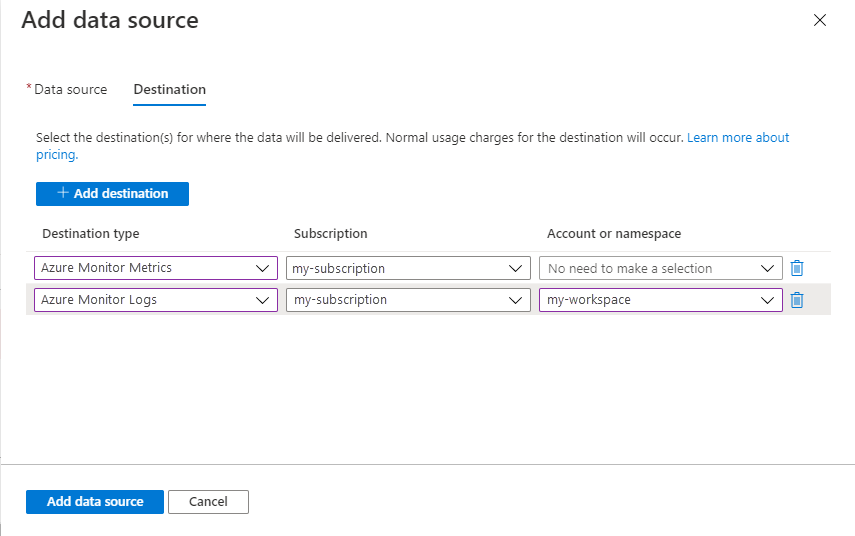
Performance counters can be sent to a Log Analytics workspace where they're stored in the Perf table and/or Azure Monitor Metrics (preview) where they're available in Metrics explorer. Add a destination of type Azure Monitor Logs and select a Log Analytics workspace. While you can add multiple workspaces, be aware that this will send duplicate data to each which will result in additional cost. No further details are required for Azure Monitor Metrics (preview) since this is stored at the subscription level for the monitored resource.
Verify data collection
To verify performance counters are being collected in the Log Analytics workspace, check for records in the Perf table. From the virtual machine or from the Log Analytics workspace in the Azure portal, select Logs and then click the Tables button. Under the Virtual machines category, click Run next to Perf.
To verify performance counters are being collected in Azure Monitor Metrics, select Metrics from the virtual machine in the Azure portal. Select Virtual Machine Guest (Windows) or azure.vm.linux.guestmetrics for the namespace and then select a metric to add to the view.
Related content
- Collect guest log data from virtual machines with Azure Monitor - Create and manage data collection rules for VM log and event data.
- Azure Monitor Agent overview - Review how Azure Monitor Agent collects data from virtual machines.


