Note
Access to this page requires authorization. You can try signing in or changing directories.
Access to this page requires authorization. You can try changing directories.
This article describes:
- The types of monitoring data you can collect for this service.
- Ways to analyze that data.
Note
If you're already familiar with this service and/or Azure Monitor and just want to know how to analyze monitoring data, see the Analyze section near the end of this article.
When you have critical applications and business processes that rely on Azure resources, you need to monitor and get alerts for your system. The Azure Monitor service collects and aggregates metrics and logs from every component of your system. Azure Monitor provides you with a view of availability, performance, and resilience, and notifies you of issues. You can use the Azure portal, PowerShell, Azure CLI, REST API, or client libraries to set up and view monitoring data.
- For more information on Azure Monitor, see the Azure Monitor overview.
- For more information on how to monitor Azure resources in general, see Monitor Azure resources with Azure Monitor.
Insights
Some services in Azure have a built-in monitoring dashboard in the Azure portal that provides a starting point for monitoring your service. These dashboards are called insights, and you can find them in the Insights Hub of Azure Monitor in the Azure portal.
For more information, see Monitor Azure Monitor Resource Group insights.
Resource types
Azure uses the concept of resource types and IDs to identify everything in a subscription. Azure Monitor similarly organizes core monitoring data into metrics and logs based on resource types, also called namespaces. Different metrics and logs are available for different resource types. Your service might be associated with more than one resource type.
Resource types are also part of the resource IDs for every resource running in Azure. For example, one resource type for a virtual machine is Microsoft.Compute/virtualMachines. For a list of services and their associated resource types, see Resource providers.
For more information about the resource types for Resource Manager, see Azure Resource Manager monitoring data reference.
Data storage
For Azure Monitor:
- Metrics data is stored in the Azure Monitor metrics database.
- Log data is stored in the Azure Monitor logs store. Log Analytics is a tool in the Azure portal that can query this store.
- The Azure activity log is a separate store with its own interface in the Azure portal.
You can optionally route metric and activity log data to the Azure Monitor logs store. You can then use Log Analytics to query the data and correlate it with other log data.
Many services can use diagnostic settings to send metric and log data to other storage locations outside Azure Monitor. Examples include Azure Storage, and non-Azure partner systems, by using Event Hubs.
For detailed information on how Azure Monitor stores data, see Azure Monitor data platform.
Azure Monitor platform metrics
Azure Monitor provides platform metrics for most services. These metrics are:
- Individually defined for each namespace.
- Stored in the Azure Monitor time-series metrics database.
- Lightweight and capable of supporting near real-time alerting.
- Used to track the performance of a resource over time.
Collection: Azure Monitor collects platform metrics automatically. No configuration is required.
Routing: You can also usually route platform metrics to Azure Monitor Logs / Log Analytics so you can query them with other log data. For more information, see the Metrics diagnostic setting. For how to configure diagnostic settings for a service, see Create diagnostic settings in Azure Monitor.
For a list of all metrics it's possible to gather for all resources in Azure Monitor, see Supported metrics in Azure Monitor.
For a list of available metrics for Resource Manager, see Azure Resource Manager monitoring data reference.
When you create and manage resources in Azure, Azure Resource Manager orchestrates your requests through Azure's control plane. This article describes how to monitor the volume and latency of control plane requests made to Azure.
With these metrics, you can observe traffic and latency for control plane requests throughout your subscriptions. For example, you can figure out when your requests are throttled by examining throttled requests. Determine if they failed by filtering for specific status codes and examining server errors.
The metrics are available for up to three months (93 days) and only track synchronous requests. For a scenario like a virtual machine creation, the metrics don't represent the performance or reliability of the long-running asynchronous operation.
Accessing Azure Resource Manager metrics
Azure Resource Manager offers enhanced integration with Azure Monitor Metrics for your subscriptions. You can have deeper visibility and more granular monitoring capabilities for your Resource Manager operations.
You can access control plane metrics by using the Azure Monitor REST APIs, SDKs, and the Azure portal by selecting the Azure Resource Manager metric. For an overview on Azure Monitor, see Azure Monitor Metrics.
There's no opt-in or sign-up process to access control plane metrics.
Dimensions Available: You can analyze and filter your metrics using the following new dimensions:
- Operation type: By high customer demand, you can now distinguish between different operation categories (read, write, delete)!
- ARM request region: Identify where requests originate and monitor regional trends.
- HTTP method: Break down metrics by request type (GET, POST, etc.).
- HTTP status code: Track specific response codes for better troubleshooting.
- HTTP status code class: Group responses by class (2xx, 4xx, 5xx) for high-level insights.
- Resource type: Filter metrics by the type of Azure resource.
- RP namespace: Analyze metrics by resource provider namespace. These dimensions empower you to create more targeted alerts, dashboards, and reports, helping you optimize performance and quickly identify issues across your Azure environment.
For guidance on how to retrieve a bearer token and make requests to Azure, see Azure REST API reference.
Metric definition
The definition for Azure Resource Manager metrics in Azure Monitor is only accessible through the 2017-12-01-preview API version. To retrieve the definition, run the following snippet. Replace 00000000-0000-0000-0000-000000000000 with your subscription ID.
curl --location --request GET 'https://management.chinacloudapi.cn/subscriptions/ffff5f5f-aa6a-bb7b-cc8c-dddddd9d9d9d/providers/microsoft.insights/metricDefinitions?api-version=2017-12-01-preview&metricnamespace=microsoft.resources/subscriptions' \
--header 'Authorization: bearer {{bearerToken}}'
This snippet returns the definition for the metrics schema. Notably, this schema includes the dimensions you can filter on with the Monitor API.
Metrics examples
Here are some scenarios that can help you explore Azure Resource Manager metrics.
Query traffic and latency control plane metrics with Azure portal
First, navigate to the Azure Monitor page within the portal:
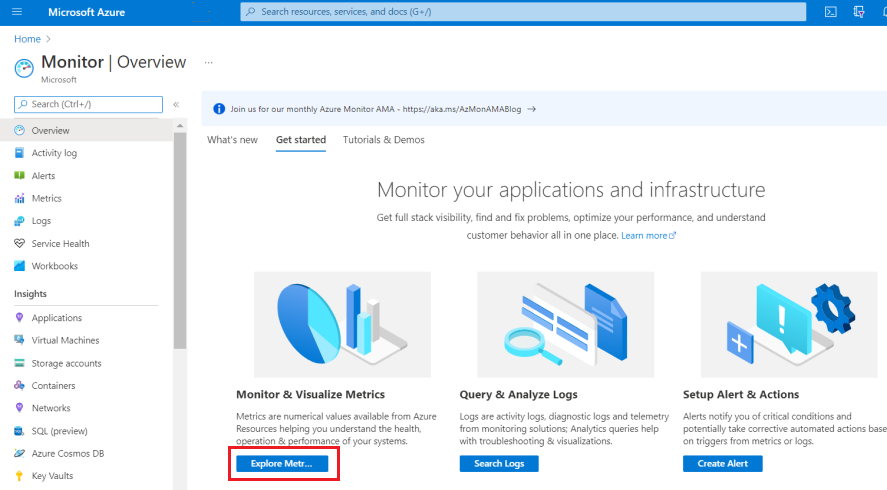
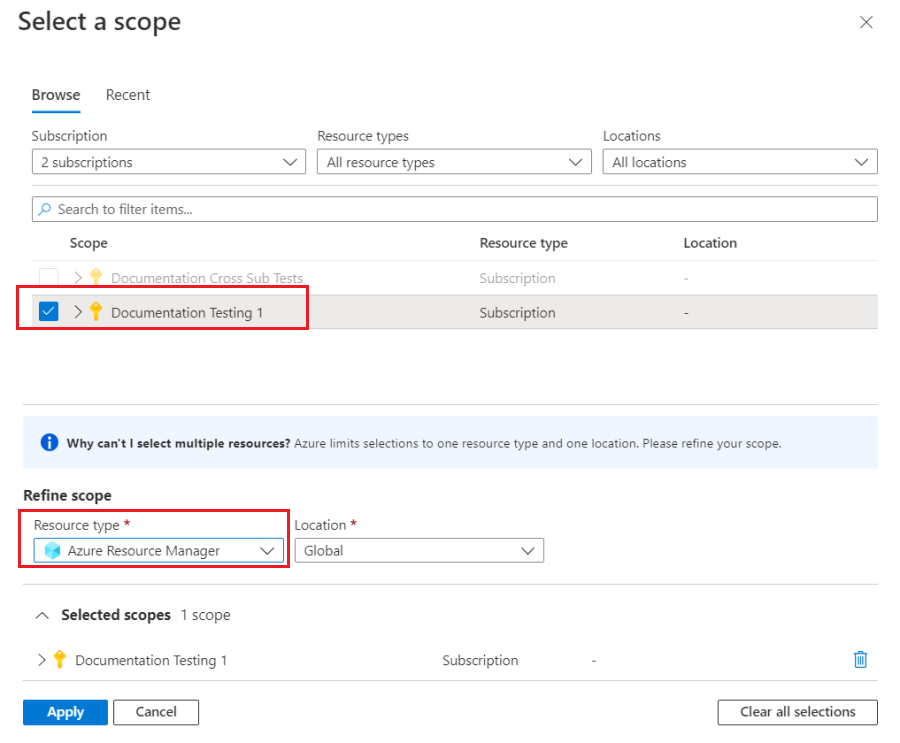
After selecting Explore Metrics, select a single subscription and then select the Azure Resource Manager metric:
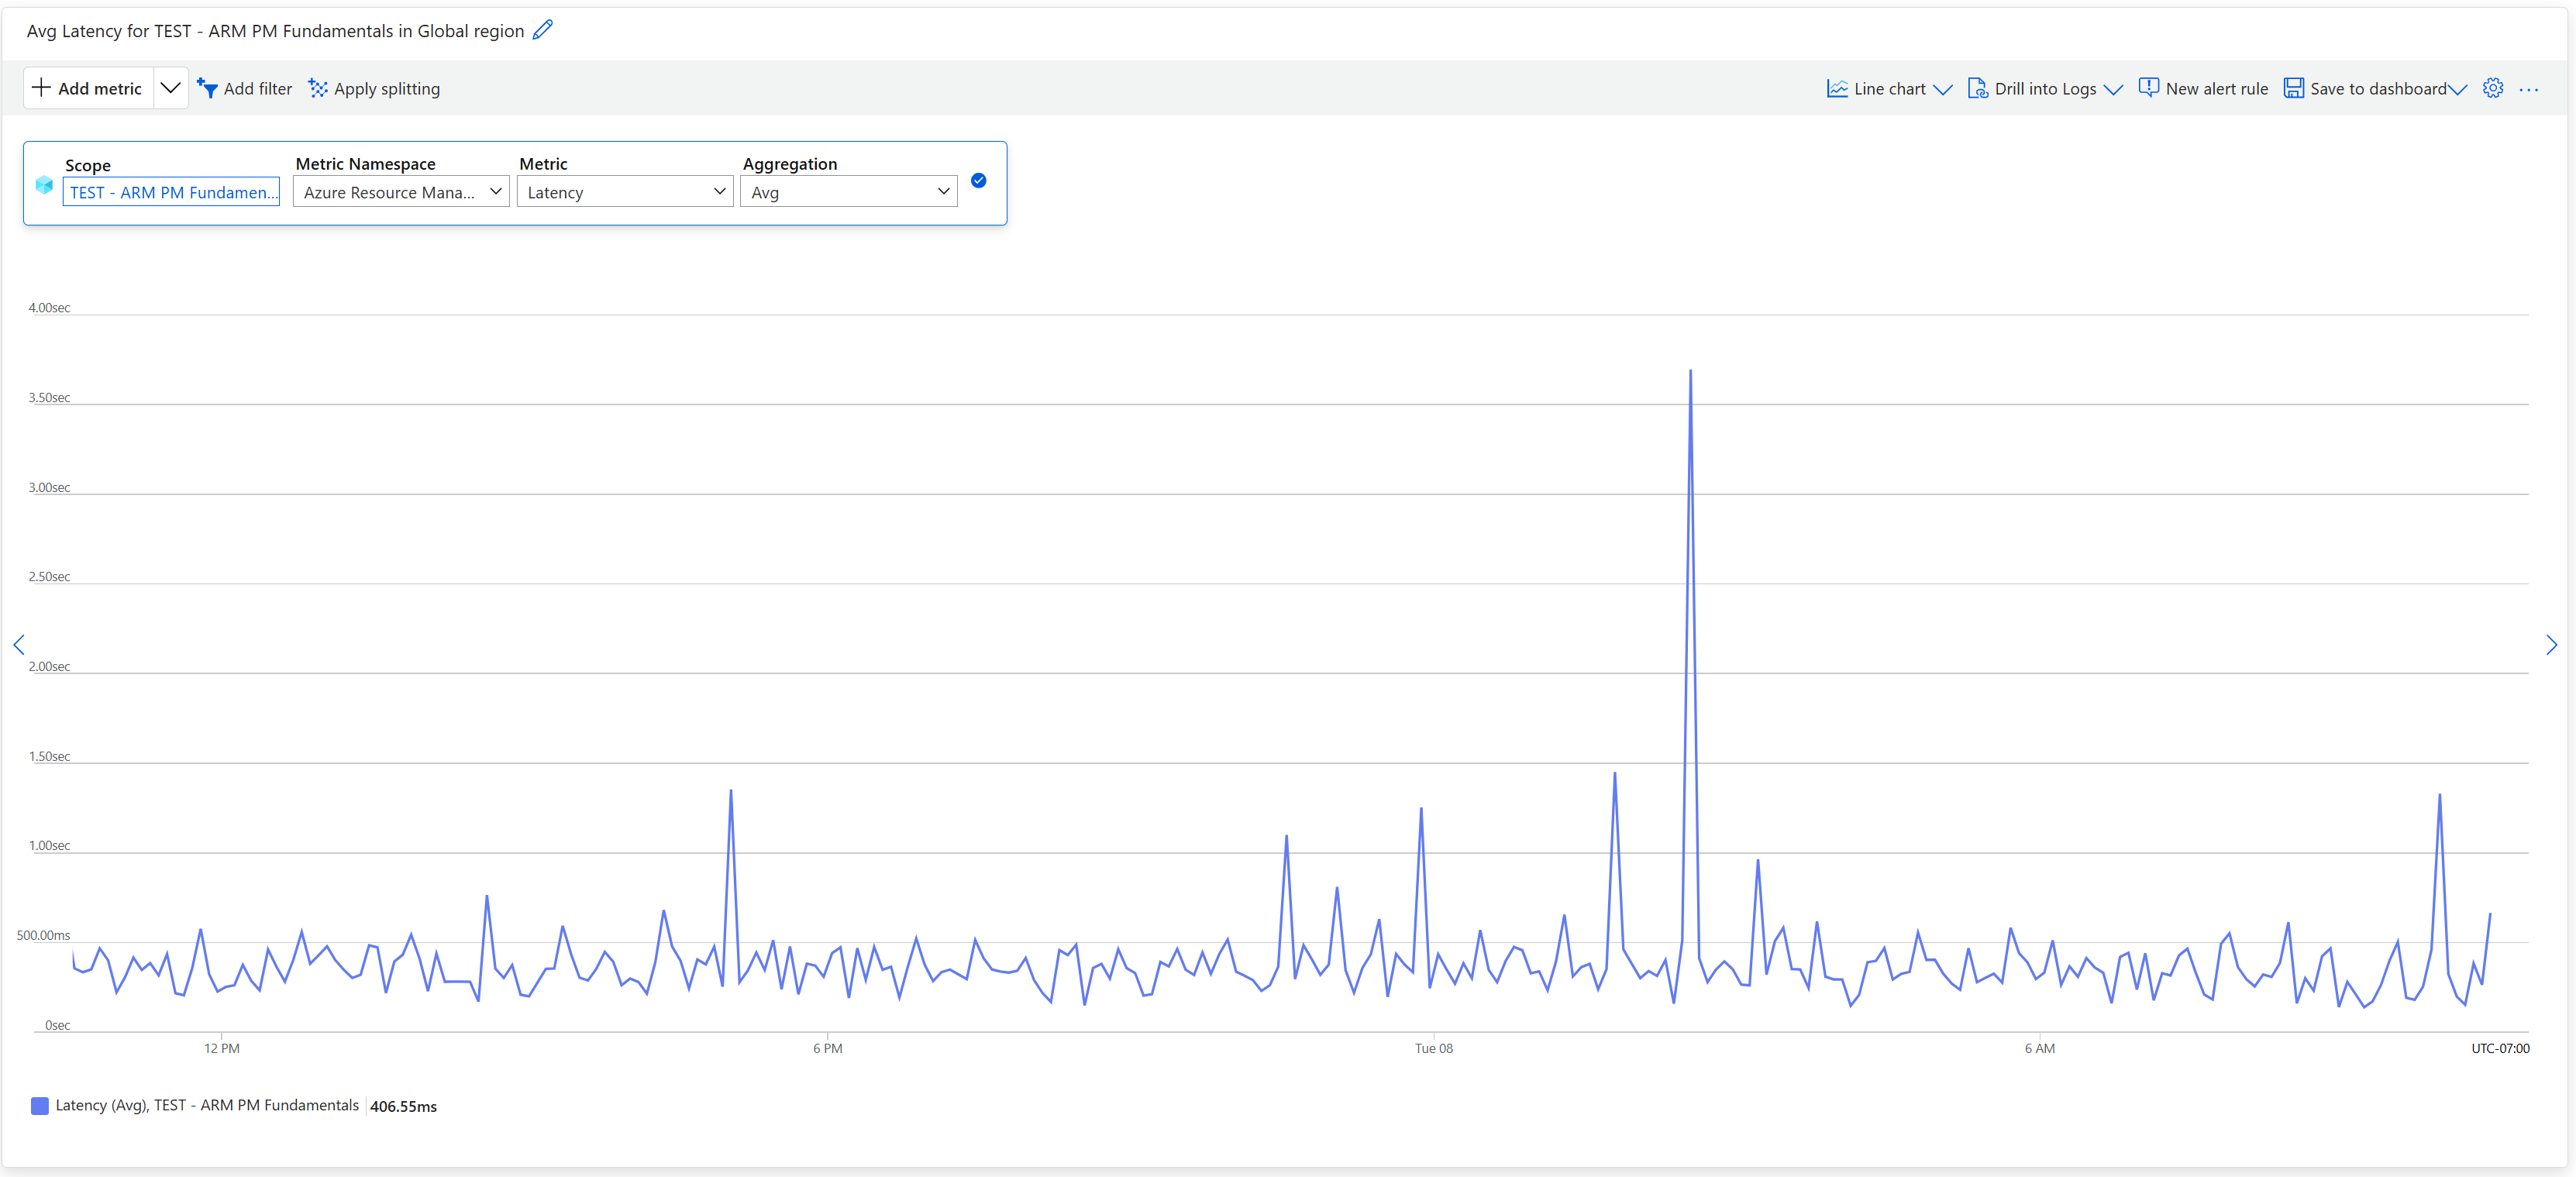
Then, after selecting Apply, you can visualize your Traffic or Latency control plane metrics with custom filtering and splitting:
Select Latency as your Metric:
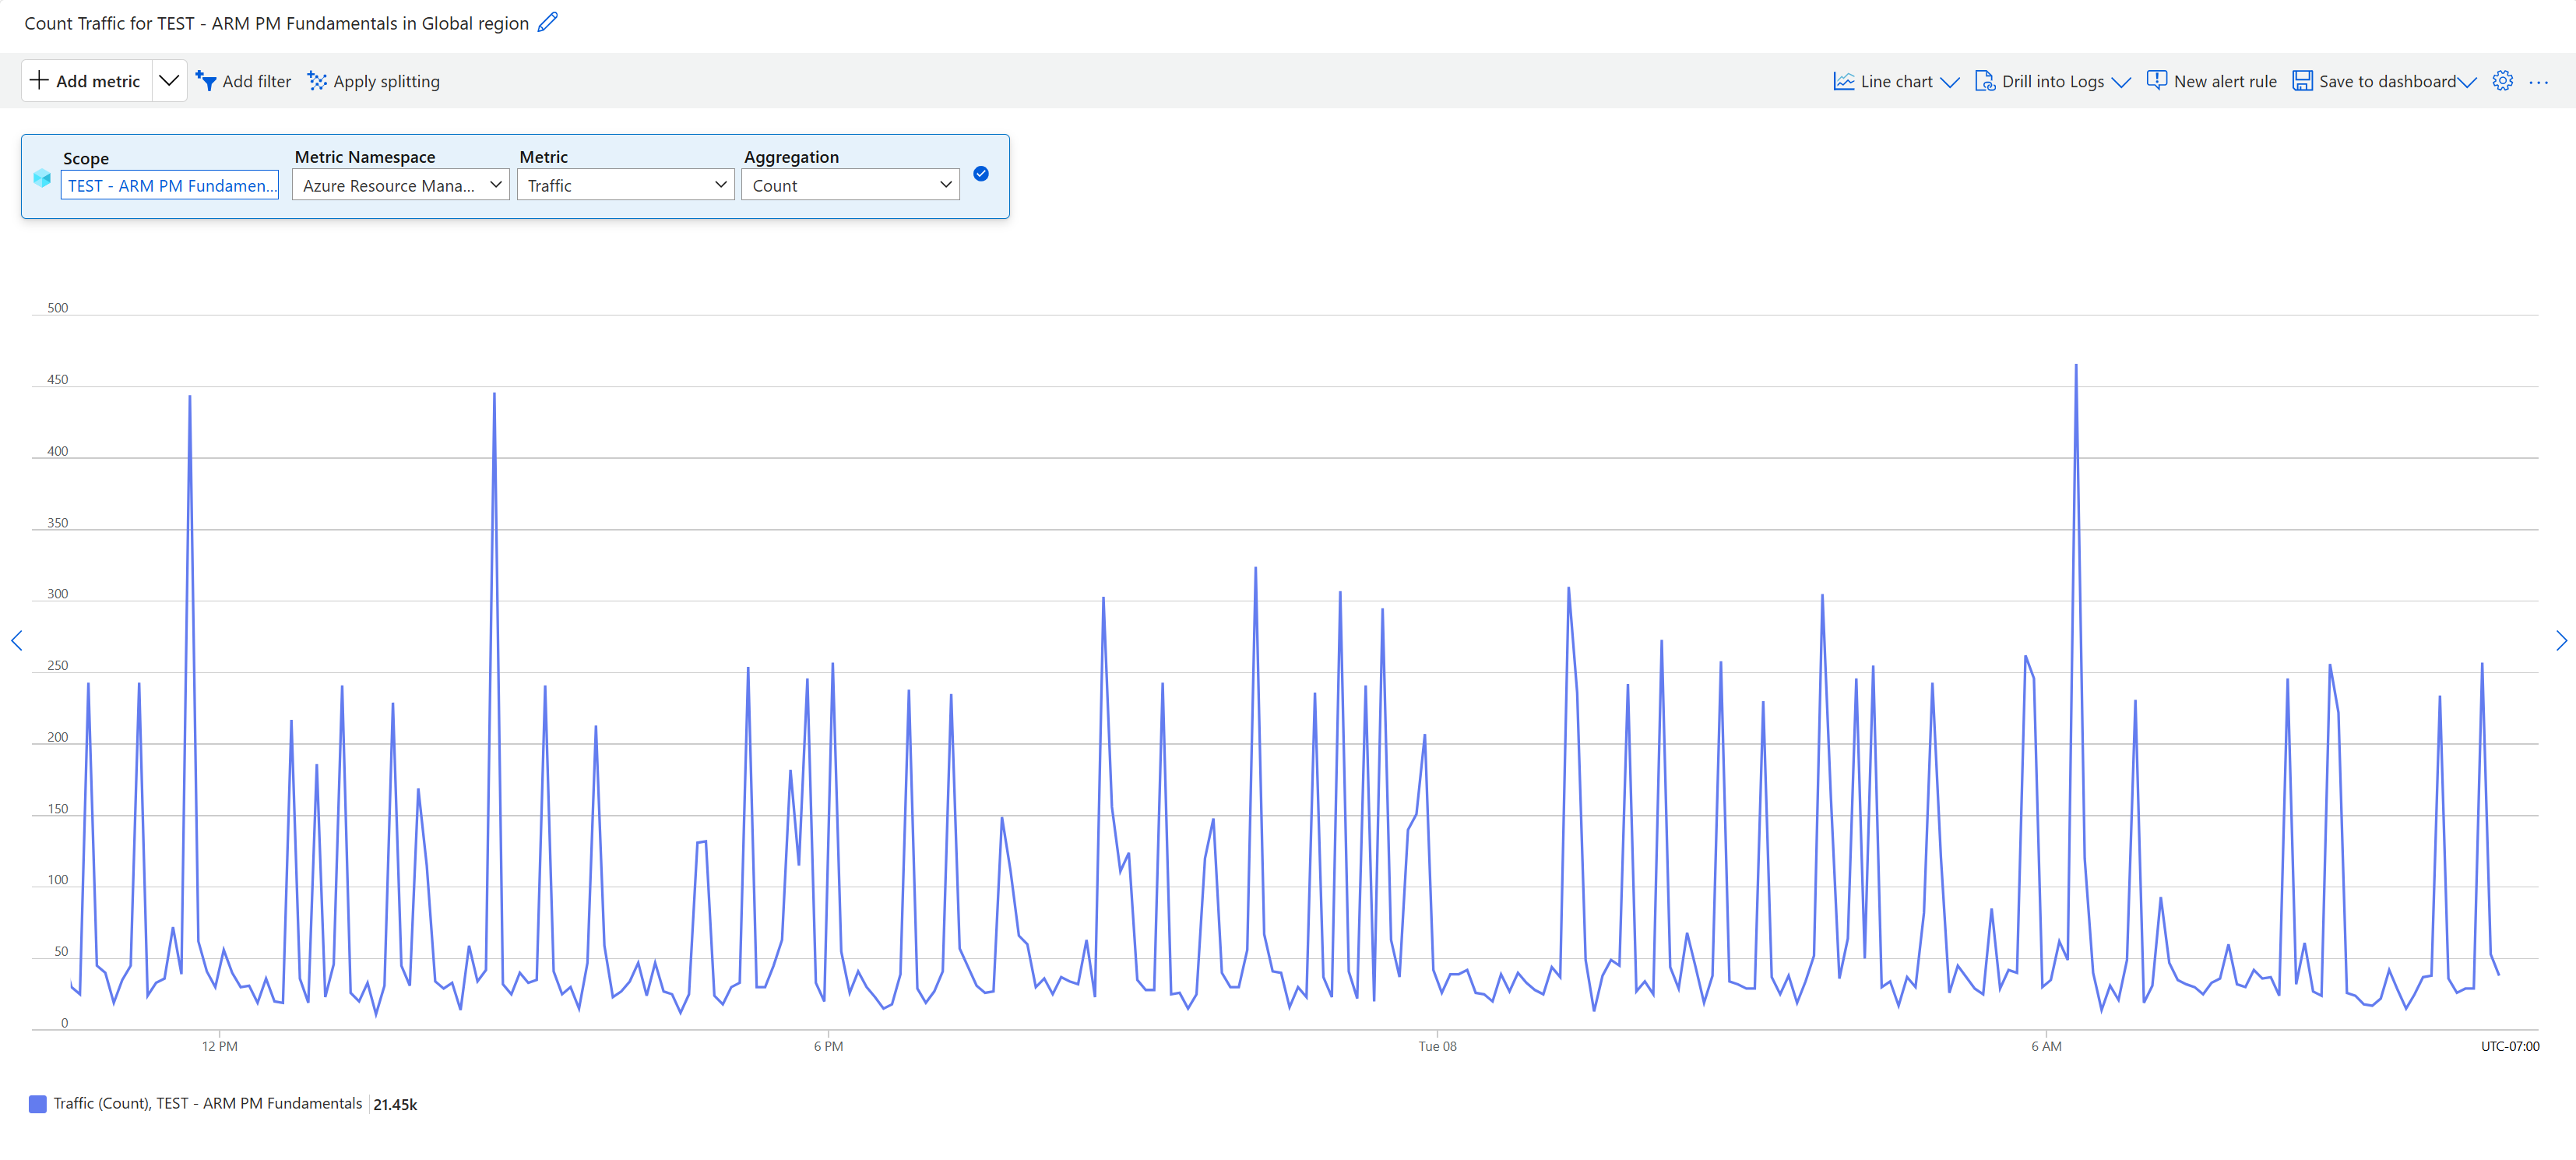
View Traffic:
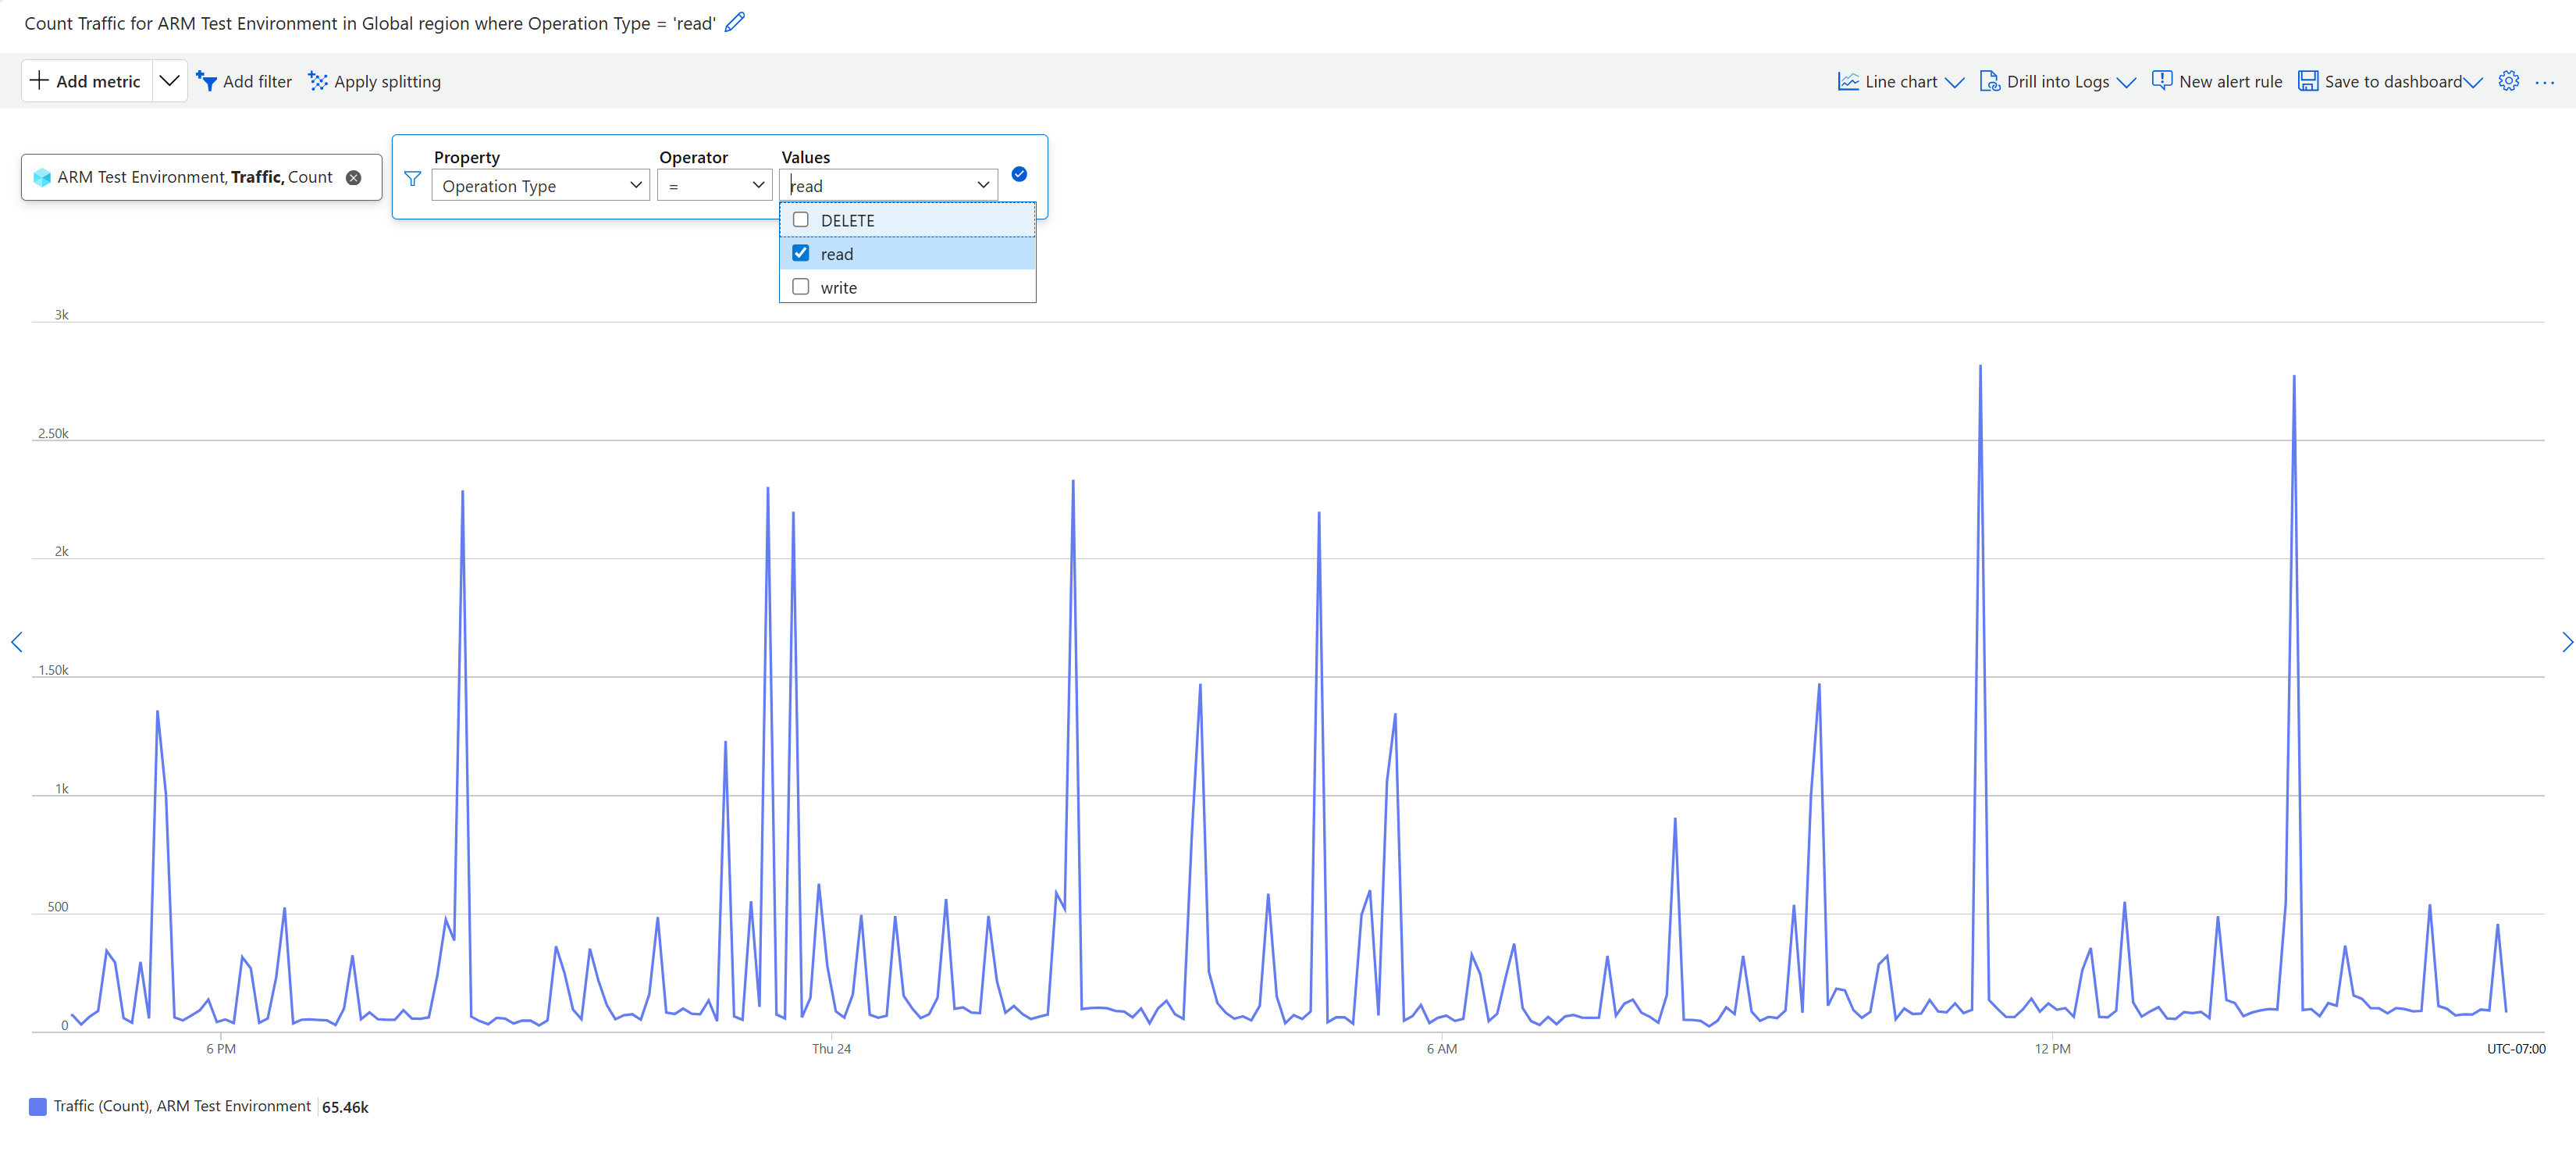
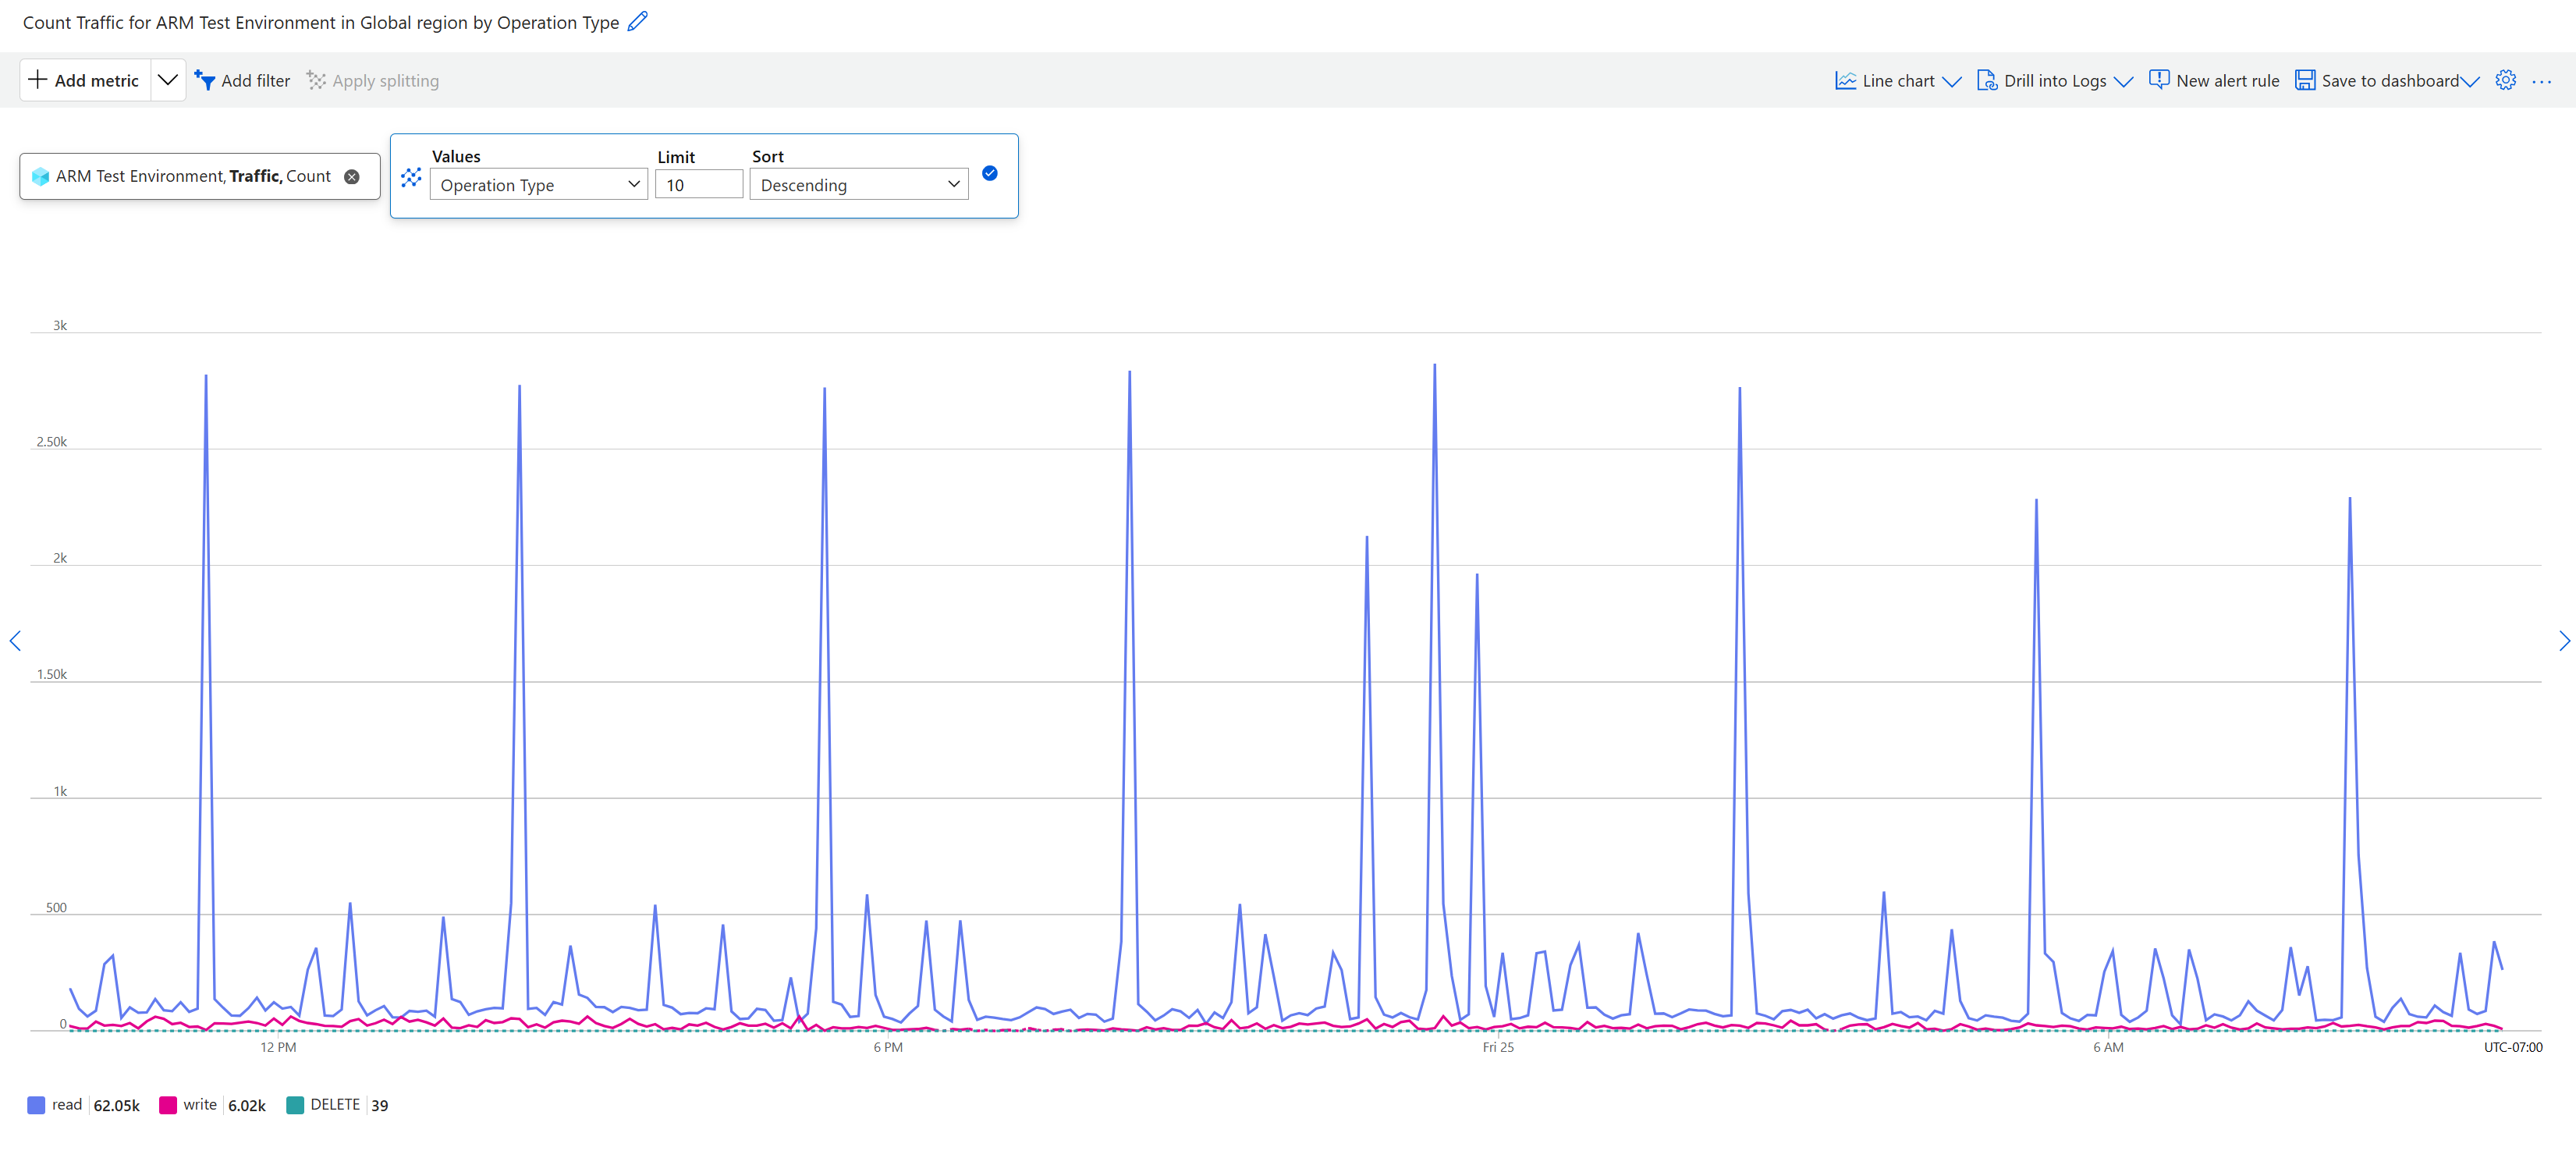
Here are additional dimensions you can view to further analyze your call behavior - select Add filter to deep dive into one value like "reads," or select Apply splitting to view a breakdown of your operations.
With our newest dimension Operation Type, you can filter or split your requests by reads, writes, or deletes to analyze your request behavior for a specific operation.
Query traffic and latency control plane metrics with REST API
After you authenticate with Azure, make a request to retrieve control plane metrics for your subscription. In the script, replace 00000000-0000-0000-0000-000000000000 with your subscription ID. The script retrieves the average request latency, in seconds, and the total request count for the two-day timespan, broken down by one-day intervals:
curl --location --request GET "https://management.chinacloudapi.cn/subscriptions/ffff5f5f-aa6a-bb7b-cc8c-dddddd9d9d9d/providers/microsoft.insights/metrics?api-version=2021-05-01&interval=P1D&metricnames=Latency&metricnamespace=microsoft.resources/subscriptions®ion=global&aggregation=average,count×pan=2021-11-01T00:00:00Z/2021-11-03T00:00:00Z" \
--header "Authorization: bearer {{bearerToken}}"
For Azure Resource Manager metrics, you can retrieve the traffic count by using the Latency metric and including the count aggregation. You see a JSON response for the request:
{
    "cost": 5758,
    "timespan": "2021-11-01T00:00:00Z/2021-11-03T00:00:00Z",
    "interval": "P1D",
    "value": [
        {
            "id": "subscriptions/aaaa0a0a-bb1b-cc2c-dd3d-eeeeee4e4e4e/providers/Microsoft.Insights/metrics/Latency",
            "type": "Microsoft.Insights/metrics",
            "name": {
                "value": "Latency",
                "localizedValue": "Latency"
            },
            "displayDescription": "Latency data for all requests to Azure Resource Manager",
            "unit": "Seconds",
            "timeseries": [
                {
                    "metadatavalues": [],
                    "data": [
                        {
                            "timeStamp": "2021-11-01T00:00:00Z",
                            "count": 1406.0,
                            "average": 0.19345163584637273
                        },
                        {
                            "timeStamp": "2021-11-02T00:00:00Z",
                            "count": 1517.0,
                            "average": 0.28294792353328935
                        }
                    ]
                }
            ],
            "errorCode": "Success"
        }
    ],
    "namespace": "microsoft.resources/subscriptions",
    "resourceregion": "global"
}
To retrieve only the traffic count, use the Traffic metric with the count aggregation:
curl --location --request GET 'https://management.chinacloudapi.cn/subscriptions/ffff5f5f-aa6a-bb7b-cc8c-dddddd9d9d9d/providers/microsoft.insights/metrics?api-version=2021-05-01&interval=P1D&metricnames=Traffic&metricnamespace=microsoft.resources/subscriptions®ion=global&aggregation=count×pan=2021-11-01T00:00:00Z/2021-11-03T00:00:00Z' \
--header 'Authorization: bearer {{bearerToken}}'
The response for the request is:
{
    "cost": 2879,
    "timespan": "2021-11-01T00:00:00Z/2021-11-03T00:00:00Z",
    "interval": "P1D",
    "value": [
        {
            "id": "subscriptions/aaaa0a0a-bb1b-cc2c-dd3d-eeeeee4e4e4e/providers/Microsoft.Insights/metrics/Traffic",
            "type": "Microsoft.Insights/metrics",
            "name": {
                "value": "Traffic",
                "localizedValue": "Traffic"
            },
            "displayDescription": "Traffic data for all requests to Azure Resource Manager",
            "unit": "Count",
            "timeseries": [
                {
                    "metadatavalues": [],
                    "data": [
                        {
                            "timeStamp": "2021-11-01T00:00:00Z",
                            "count": 1406.0
                        },
                        {
                            "timeStamp": "2021-11-02T00:00:00Z",
                            "count": 1517.0
                        }
                    ]
                }
            ],
            "errorCode": "Success"
        }
    ],
    "namespace": "microsoft.resources/subscriptions",
    "resourceregion": "global"
}
For the metrics supporting dimensions, you need to specify the dimension value to see the corresponding metrics values. For example, if you want to focus on the Latency for successful requests to Resource Manager, filter the StatusCodeClass dimension with 2XX.
If you want to look at the number of requests made in your subscription for Networking resources, like Virtual Networks and Load Balancers, filter the Namespace dimension for MICROSOFT.NETWORK.
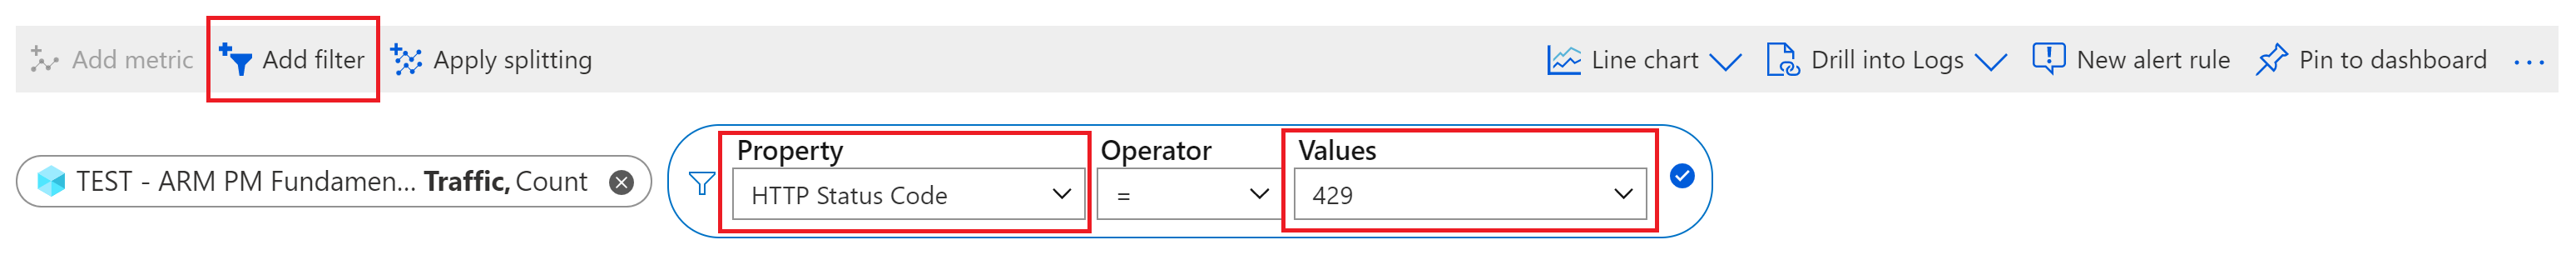
Examining Throttled Requests
You can set your HTTP Status Code. To view only your throttled requests, filter for 429 status code responses. For REST API calls, use the $filter property and the StatusCode dimension by appending: %24filter=StatusCode eq '429'. The following snippet shows this filter at the end of the request:
curl --location --request GET 'https://management.chinacloudapi.cn/subscriptions/ffff5f5f-aa6a-bb7b-cc8c-dddddd9d9d9d/providers/microsoft.insights/metrics?api-version=2021-05-01&interval=P1D&metricnames=Latency&metricnamespace=microsoft.resources/subscriptions®ion=global&aggregation=count,average×pan=2021-11-01T00:00:00Z/2021-11-03T00:00:00Z&%24filter=StatusCode%20eq%20%27429%27' \
--header 'Authorization: bearer {{bearerToken}}'
You can also filter directly in portal:
Examining Server Errors
Similar to looking at throttled requests, you view all requests that returned a server error response code by filtering 5xx responses. To filter REST API calls, use the $filter property and the StatusCodeClass dimension by appending: %24filter=StatusCodeClass eq '5xx' at the end of the request in the following snippet:
curl --location --request GET 'https://management.chinacloudapi.cn/subscriptions/ffff5f5f-aa6a-bb7b-cc8c-dddddd9d9d9d/providers/microsoft.insights/metrics?api-version=2021-05-01&interval=P1D&metricnames=Latency&metricnamespace=microsoft.resources/subscriptions®ion=global&aggregation=count,average×pan=2021-11-01T00:00:00Z/2021-11-03T00:00:00Z&%24filter=StatusCodeClass%20eq%20%275xx%27' \
--header 'Authorization: bearer {{bearerToken}}'
Resource Manager alert rules
You can set alerts for any metric, log entry, or activity log entry listed in the Azure Resource Manager monitoring data reference.
Advisor recommendations
For some services, if critical conditions or imminent changes occur during resource operations, an alert displays on the service Overview page in the portal. You can find more information and recommended fixes for the alert in Advisor recommendations under Monitoring in the left menu. During normal operations, no advisor recommendations display.
For more information on Azure Advisor, see Azure Advisor overview.
Related content
- See Azure Resource Manager monitoring data reference for a reference of the metrics, logs, and other important values created for Resource Manager.
- See Monitoring Azure resources with Azure Monitor for general details on monitoring Azure resources.