Note
Access to this page requires authorization. You can try signing in or changing directories.
Access to this page requires authorization. You can try changing directories.
Azure Monitor for Azure Cosmos DB provides a metrics view to monitor your account and create dashboards. The Azure Cosmos DB metrics are collected by default, this feature does not require you to enable or configure anything explicitly. The Total Request Units metric is used to get the request units usage for different types of operations. Later you can analyze which operations used most of the throughput. By default, the throughput data is aggregated at one-minute interval. However, you can change the aggregation unit by changing the time granularity option.
There are two ways to analyze the request unit usage data:
- Within the given time interval which operations are taking more request units.
- Which operations in general dominate your workload by consuming more request units. This analysis allows you to focus on operations such as insert, upsert and look at their indexing. You can find out if you are over/under indexing specific fields and modify the indexing policy to include or exclude the paths.
If you notice certain queries are taking more request units, you can take actions such as:
- Reconsider if you are requesting the right amount of data.
- Modify the query to use index with filter clause.
- Perform less expensive UDF function calls.
- Define partition keys to minimize the fan out of query into different partitions.
- You can also use the query metrics returned in the call response, the diagnostic log details and refer to query performance tuning article to learn more about the query execution.
- You can start from sum and then look at avg utilization using the right dimension.
View the total request unit usage metric
Sign in to the Azure portal.
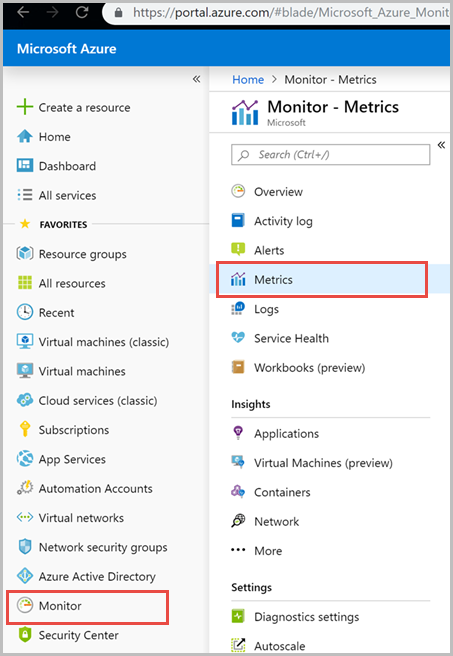
Select Monitor from the left-hand navigation bar and select Metrics.
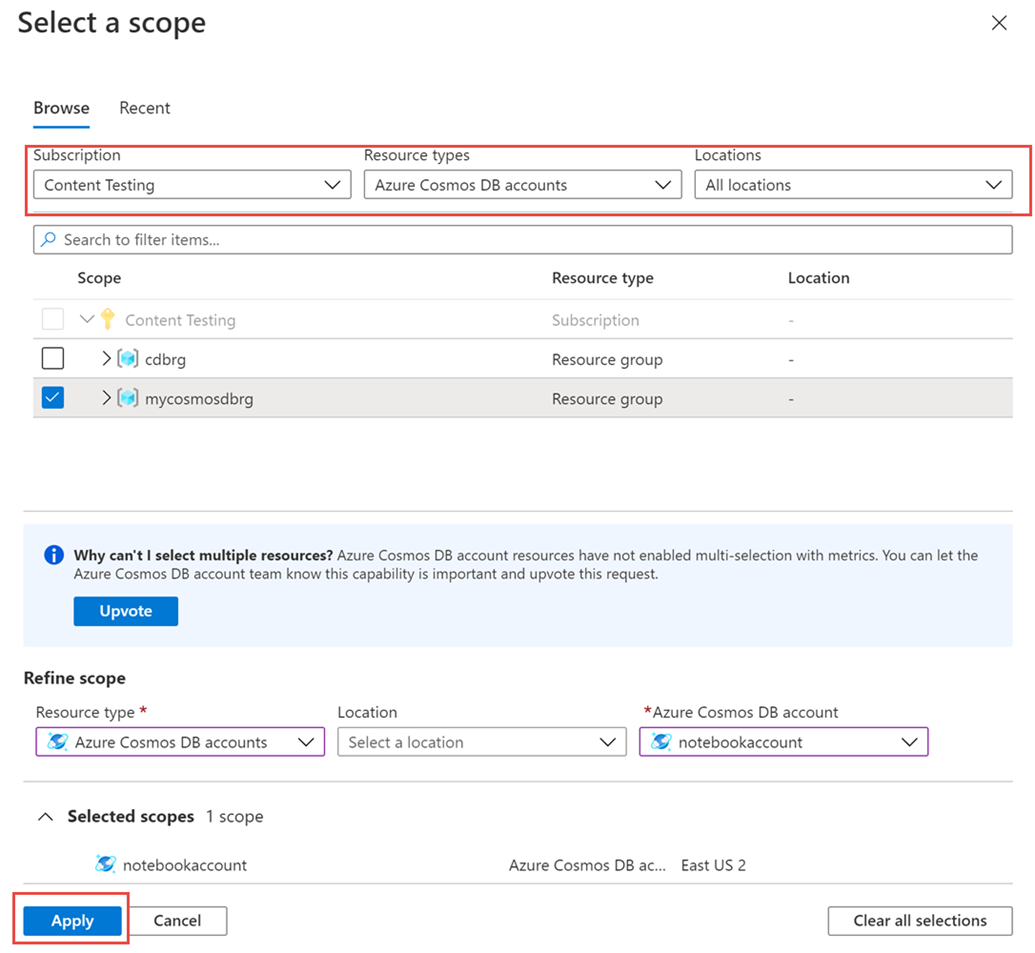
From the Metrics pane > Select a resource > choose the required subscription, and resource group. For the Resource type, select Azure Cosmos DB accounts, choose one of your existing Azure Cosmos DB accounts, and select Apply.
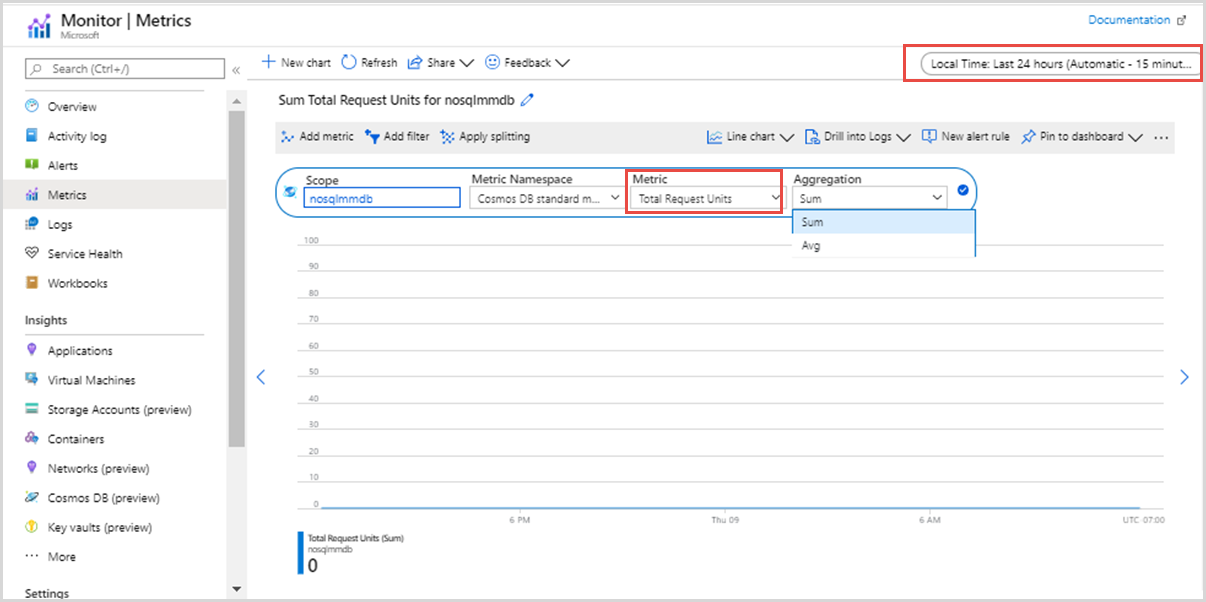
Next select the Total Request Units metric from the list of available metrics. To learn in detail about all the available metrics in this list, see the Metrics by category article. In this example, let's select Total Request Units and Avg as the aggregation value. In addition to these details, you can also select the Time range and Time granularity of the metrics. At max, you can view metrics for the past 30 days. After you apply the filter, a chart is displayed based on your filter. You can see the average number of request units consumed per minute for the selected period.
Filters for request unit usage
You can also filter metrics and get the charts displayed by a specific CollectionName, DatabaseName, OperationType, Region, Status, and StatusCode. The Add filter and Apply splitting options allows you to filter the request unit usage and group the metrics.
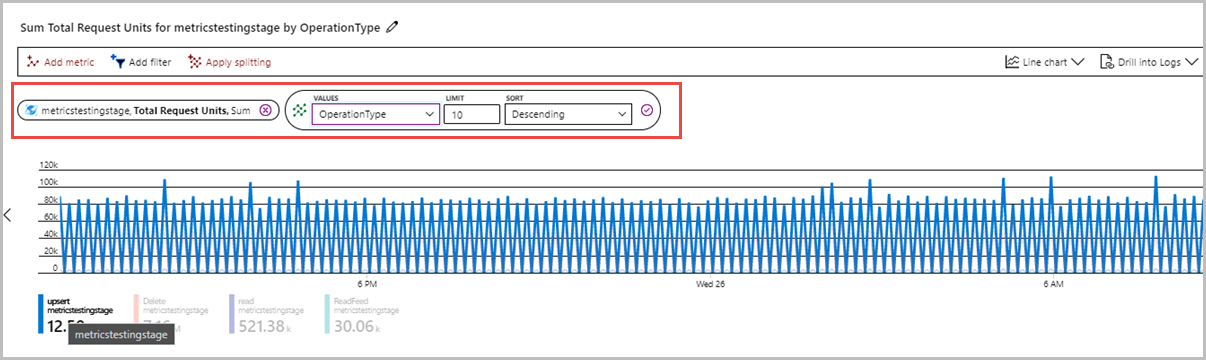
To get the request unit usage of each operation either by total(sum) or average, select Apply splitting and choose Operation type and the filter value as shown in the following image:
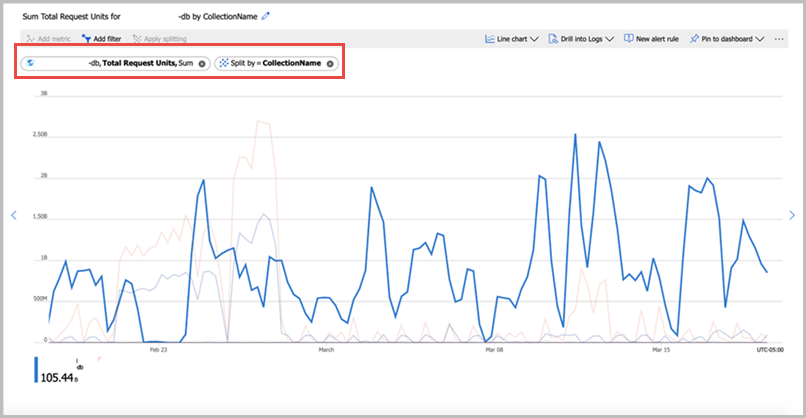
If you want to see the request unit usage by collection, select Apply splitting and choose the collection name as a filter. You will see a chart like the following with a choice of collections within the dashboard. You can then select a specific collection name to view more details:
Next steps
- Monitor Azure Cosmos DB data by using diagnostic settings in Azure.
- Audit Azure Cosmos DB control plane operations