Note
Access to this page requires authorization. You can try signing in or changing directories.
Access to this page requires authorization. You can try changing directories.
Applies to: ✅ Azure Data Explorer
Calculates distinct count of values, where each value has appeared in at least a minimum number of periods in a lookback period.
Useful for calculating distinct counts of "fans" only, while not including appearances of "non-fans". A user is counted as a "fan" only if it was active during the lookback period. The lookback period is only used to determine whether a user is considered active ("fan") or not. The aggregation itself doesn't include users from the lookback window. In comparison, the sliding_window_counts aggregation is performed over a sliding window of the lookback period.
Syntax
T | evaluate active_users_count(IdColumn, TimelineColumn, Start, End, LookbackWindow, Period, ActivePeriodsCount, Bin , [dim1, dim2, ...])
Learn more about syntax conventions.
Parameters
| Name | Type | Required | Description |
|---|---|---|---|
| T | string |
✔️ | The tabular input used to count active users. |
| IdColumn | string |
✔️ | The name of the column with ID values that represent user activity. |
| TimelineColumn | string |
✔️ | The name of the column that represents timeline. |
| Start | datetime |
✔️ | The analysis start period. |
| End | datetime |
✔️ | The analysis end period. |
| LookbackWindow | timespan |
✔️ | The time window defining a period where user appearance is checked. The lookback period starts at ([current appearance] - [lookback window]) and ends on ([current appearance]). |
| Period | timespan |
✔️ | A constant to count as single appearance (a user will be counted as active if it appears in at least distinct ActivePeriodsCount of this timespan. |
| ActivePeriodsCount | decimal |
✔️ | The minimal number of distinct active periods to decide if user is active. Active users are those users who appeared in at least (equal or greater than) active periods count. |
| Bin | decimal, datetime, or timespan | ✔️ | A constant value of the analysis step period. May also be a string of week, month, or year. All periods will be the corresponding startofweek, startofmonth, orstartofyear functions. |
| dim1, dim2, ... | dynamic |
An array of the dimensions columns that slice the activity metrics calculation. |
Returns
Returns a table that has distinct count values for IDs that have appeared in ActivePeriodCounts in the following periods: the lookback period, each timeline period, and each existing dimensions combination.
Output table schema is:
| TimelineColumn | dim1 | .. | dim_n | dcount_values |
|---|---|---|---|---|
| type: as of TimelineColumn | .. | .. | .. | long |
Examples
Calculate weekly number of distinct users that appeared in at least three different days over a period of prior eight days. Period of analysis: July 2018.
let Start = datetime(2018-07-01);
let End = datetime(2018-07-31);
let LookbackWindow = 8d;
let Period = 1d;
let ActivePeriods = 3;
let Bin = 7d;
let T =  datatable(User:string, Timestamp:datetime)
[
    "B",      datetime(2018-06-29),
    "B",      datetime(2018-06-30),
    "A",      datetime(2018-07-02),
    "B",      datetime(2018-07-04),
    "B",      datetime(2018-07-08),
    "A",      datetime(2018-07-10),
    "A",      datetime(2018-07-14),
    "A",      datetime(2018-07-17),
    "A",      datetime(2018-07-20),
    "B",      datetime(2018-07-24)
];
T | evaluate active_users_count(User, Timestamp, Start, End, LookbackWindow, Period, ActivePeriods, Bin)
Output
| Timestamp | dcount |
|---|---|
| 2018-07-01 00:00:00.0000000 | 1 |
| 2018-07-15 00:00:00.0000000 | 1 |
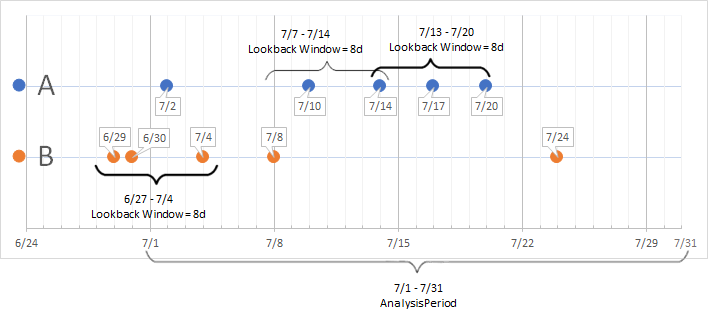
A user is considered active if it fulfills both of the following criteria:
- The user was seen in at least three distinct days (Period = 1d, ActivePeriods=3).
- The user was seen in a lookback window of 8d before and including their current appearance.
In the illustration below, the only appearances that are active by this criteria are the following instances: User A on 7/20 and User B on 7/4 (see plugin results above). The appearances of User B are included for the lookback window on 7/4, but not for the Start-End time range of 6/29-30.