Note
Access to this page requires authorization. You can try signing in or changing directories.
Access to this page requires authorization. You can try changing directories.
Switch services using the Version drop-down list. Learn more about navigation.
Applies to: ✅ Azure Data Explorer
Graph visualization is essential for understanding complex relationships and patterns within interconnected data. KQL graph semantics provide powerful querying capabilities, and there are several approaches available for visualizing the results.
Kusto Explorer
Kusto Explorer provides built-in graph visualization capabilities that automatically render interactive graph visualizations when your KQL queries end with the make-graph operator or use the graph() function.
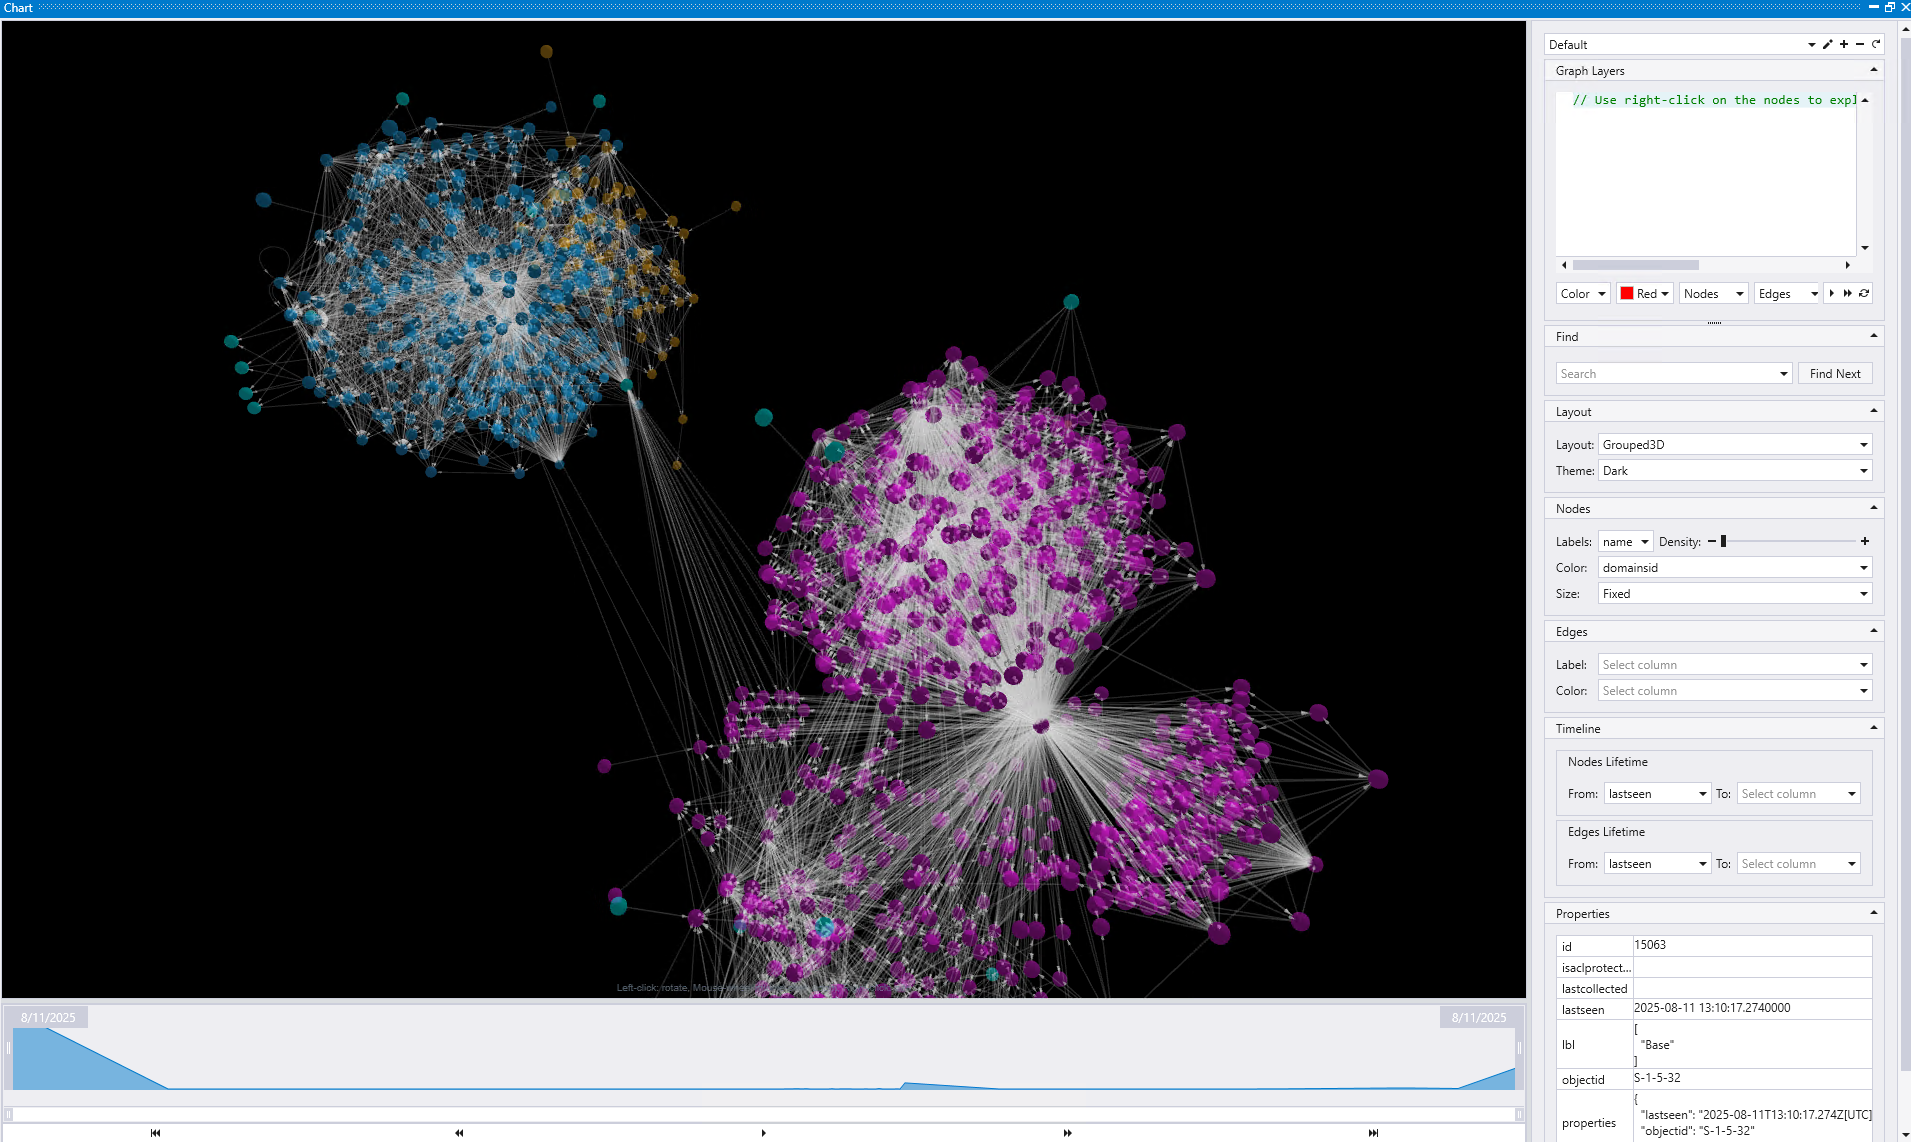
Graphistry
Graphistry offers GPU-accelerated graph visualization and analytics that integrates with KQL graph semantics. This platform enables interactive exploration of large-scale graph datasets with advanced visual analytics capabilities.
Custom graph visualizations
Custom graph visualization approaches provide complete control over the visualization experience, enabling you to create tailored solutions using popular visualization libraries. Two primary approaches are available: Plotly-based visualizations using Python integration through KQL evaluate python() operator with interactive plotting capabilities, and D3.js-based visualizations using JavaScript with complete customization of visual appearance and behavior.