Note
Access to this page requires authorization. You can try signing in or changing directories.
Access to this page requires authorization. You can try changing directories.
Switch services using the Version drop-down list. Learn more about navigation.
Applies to: ✅ Azure Data Explorer ✅ Azure Monitor ✅ Microsoft Sentinel
Scores anomaly points in a series.
The function takes an expression with a dynamic numerical array as input, and generates a dynamic numeric array of the same length. Each value of the array indicates a score of a possible anomaly, using "Tukey's test". A value greater than 1.5 in the same element of the input indicates a rise anomaly. A value less than -1.5 indicates a decline anomaly.
Syntax
series_outliers(series [, kind ] [, ignore_val ] [, min_percentile ] [, max_percentile ])
Learn more about syntax conventions.
Parameters
| Name | Type | Required | Description |
|---|---|---|---|
| series | dynamic |
✔️ | An array of numeric values. |
| kind | string |
The algorithm to use for outlier detection. The supported options are "tukey", which is traditional "Tukey", and "ctukey", which is custom "Tukey". The default is "ctukey". |
|
| ignore_val | int, long, or real | A numeric value indicating the missing values in the series. The default is double(null). The score of nulls and ignore values is set to 0. |
|
| min_percentile | int, long, or real | The minimum percentile to use to calculate the normal inter-quantile range. The default is 10. The value must be in the range [2.0, 98.0]. This parameter is only relevant for the "ctukey" kind. |
|
| max_percentile | int, long, or real | The maximum percentile to use to calculate the normal inter-quantile range. The default is 90. The value must be in the range [2.0, 98.0]. This parameter is only relevant for the "ctukey" kind. |
The following table describes differences between "tukey" and "ctukey":
| Algorithm | Default quantile range | Supports custom quantile range |
|---|---|---|
"tukey" |
25% / 75% | No |
"ctukey" |
10% / 90% | Yes |
Tip
The best way to use this function is to apply it to the results of the make-series operator.
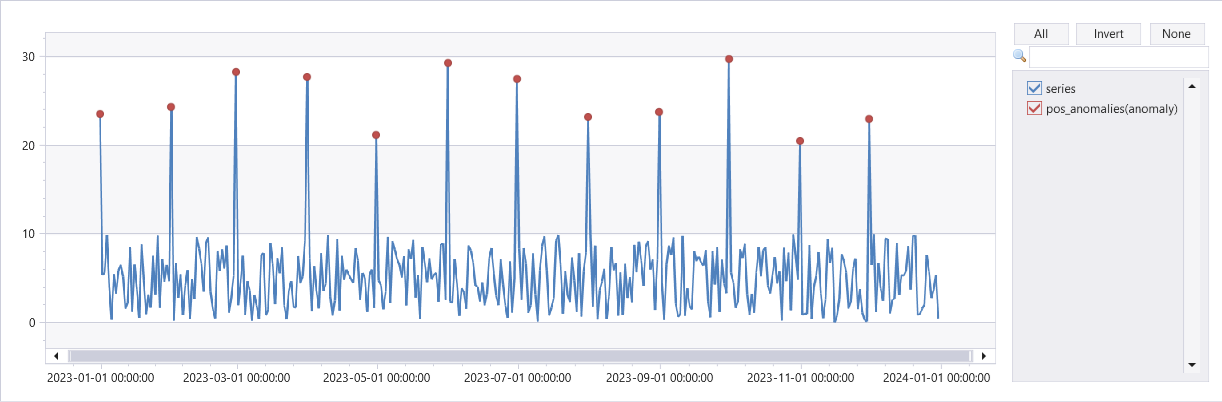
Example
range x from 0 to 364 step 1
| extend t = datetime(2023-01-01) + 1d*x
| extend y = rand() * 10
| extend y = iff(monthofyear(t) != monthofyear(prev(t)), y+20, y) // generate a sample series with outliers at first day of each month
| summarize t = make_list(t), series = make_list(y)
| extend outliers=series_outliers(series)
| extend pos_anomalies = array_iff(series_greater_equals(outliers, 1.5), 1, 0)
| render anomalychart with(xcolumn=t, ycolumns=series, anomalycolumns=pos_anomalies)