Note
Access to this page requires authorization. You can try signing in or changing directories.
Access to this page requires authorization. You can try changing directories.
Machine learning model training is an iterative process that requires significant experimentation. By using the Azure Machine Learning interactive job experience, data scientists can use the Azure Machine Learning Python SDK, Azure Machine Learning CLI, or Azure Machine Learning studio to access the container where their job is running. Once users access the job container, they can iterate on training scripts, monitor training progress, and debug the job remotely, just as they typically do on their local machines. You can interact with jobs through different training applications, including JupyterLab, TensorBoard, VS Code, or by connecting to the job container directly via SSH.
Azure Machine Learning supports interactive training on Azure Machine Learning Compute Clusters and Azure Arc-enabled Kubernetes Cluster.
Prerequisites
- Review getting started with training on Azure Machine Learning.
- For more information, see VS Code to set up the Azure Machine Learning extension.
- Make sure your job environment has the
openssh-serverandipykernel ~=6.0packages installed. All Azure Machine Learning curated training environments have these packages installed by default. - You can't enable interactive applications on distributed training runs where the distribution type is anything other than PyTorch, TensorFlow, or MPI. Custom distributed training setup (configuring multinode training without using the preceding distribution frameworks) isn't currently supported.
- To use SSH, you need an SSH key pair. Use the
ssh-keygen -f "<filepath>"command to generate a public and private key pair. - To attach a debugger to a running job, install
debugpyin your job environment. See Attach a debugger to a job.
Interact with your job container
By specifying interactive applications at job creation, you can connect directly to the container on the compute node where your job is running. Once you have access to the job container, you can test or debug your job in the exact same environment where it runs. You can also use VS Code to attach to the running process and debug as you would locally.
Enable during job submission
Create a new job from the left pane in the studio portal.
Select Compute cluster or Attached compute (Kubernetes) as the compute type. Select the compute target, and specify how many nodes you need in
Instance count.
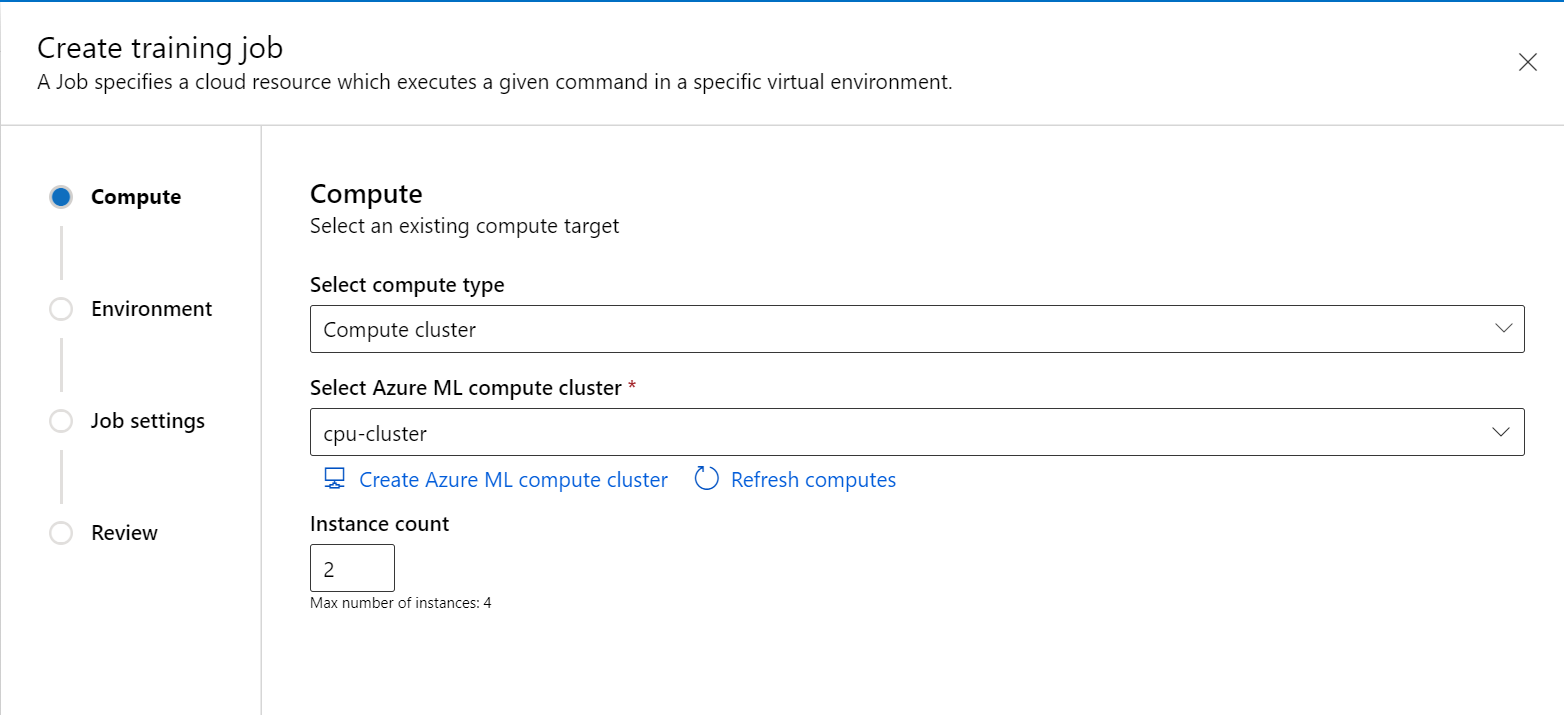
Follow the wizard to choose the environment you want to start the job.
In the Training script step, add your training code (and input/output data) and reference it in your command to make sure it's mounted to your job.

To specify the amount of time you want to reserve the compute resource, add sleep <specific time> at the end of your command. The format follows:
sleep 1ssleep 1msleep 1hsleep 1d
You can also use the sleep infinity command that keeps the job alive indefinitely.
Note
If you use sleep infinity, you must manually cancel the job to release the compute resource and stop billing.
- In Compute settings, expand the option for Training applications. Select at least one training application you want to use to interact with the job. If you don't select an application, the debug feature isn't available.
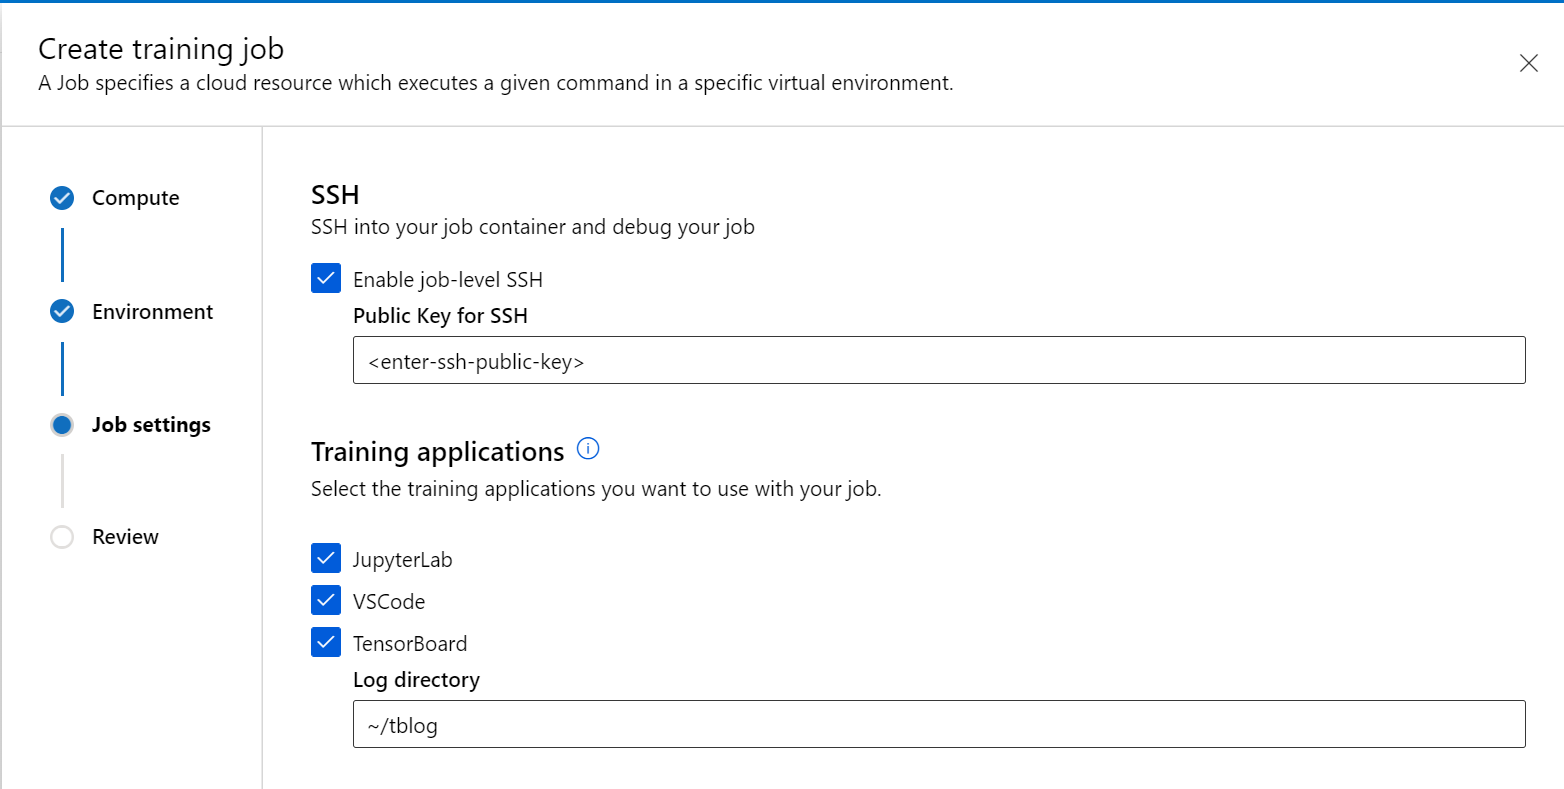
- Review and create the job.
Connect to endpoints
To interact with your running job, select Debug and monitor on the job details page.
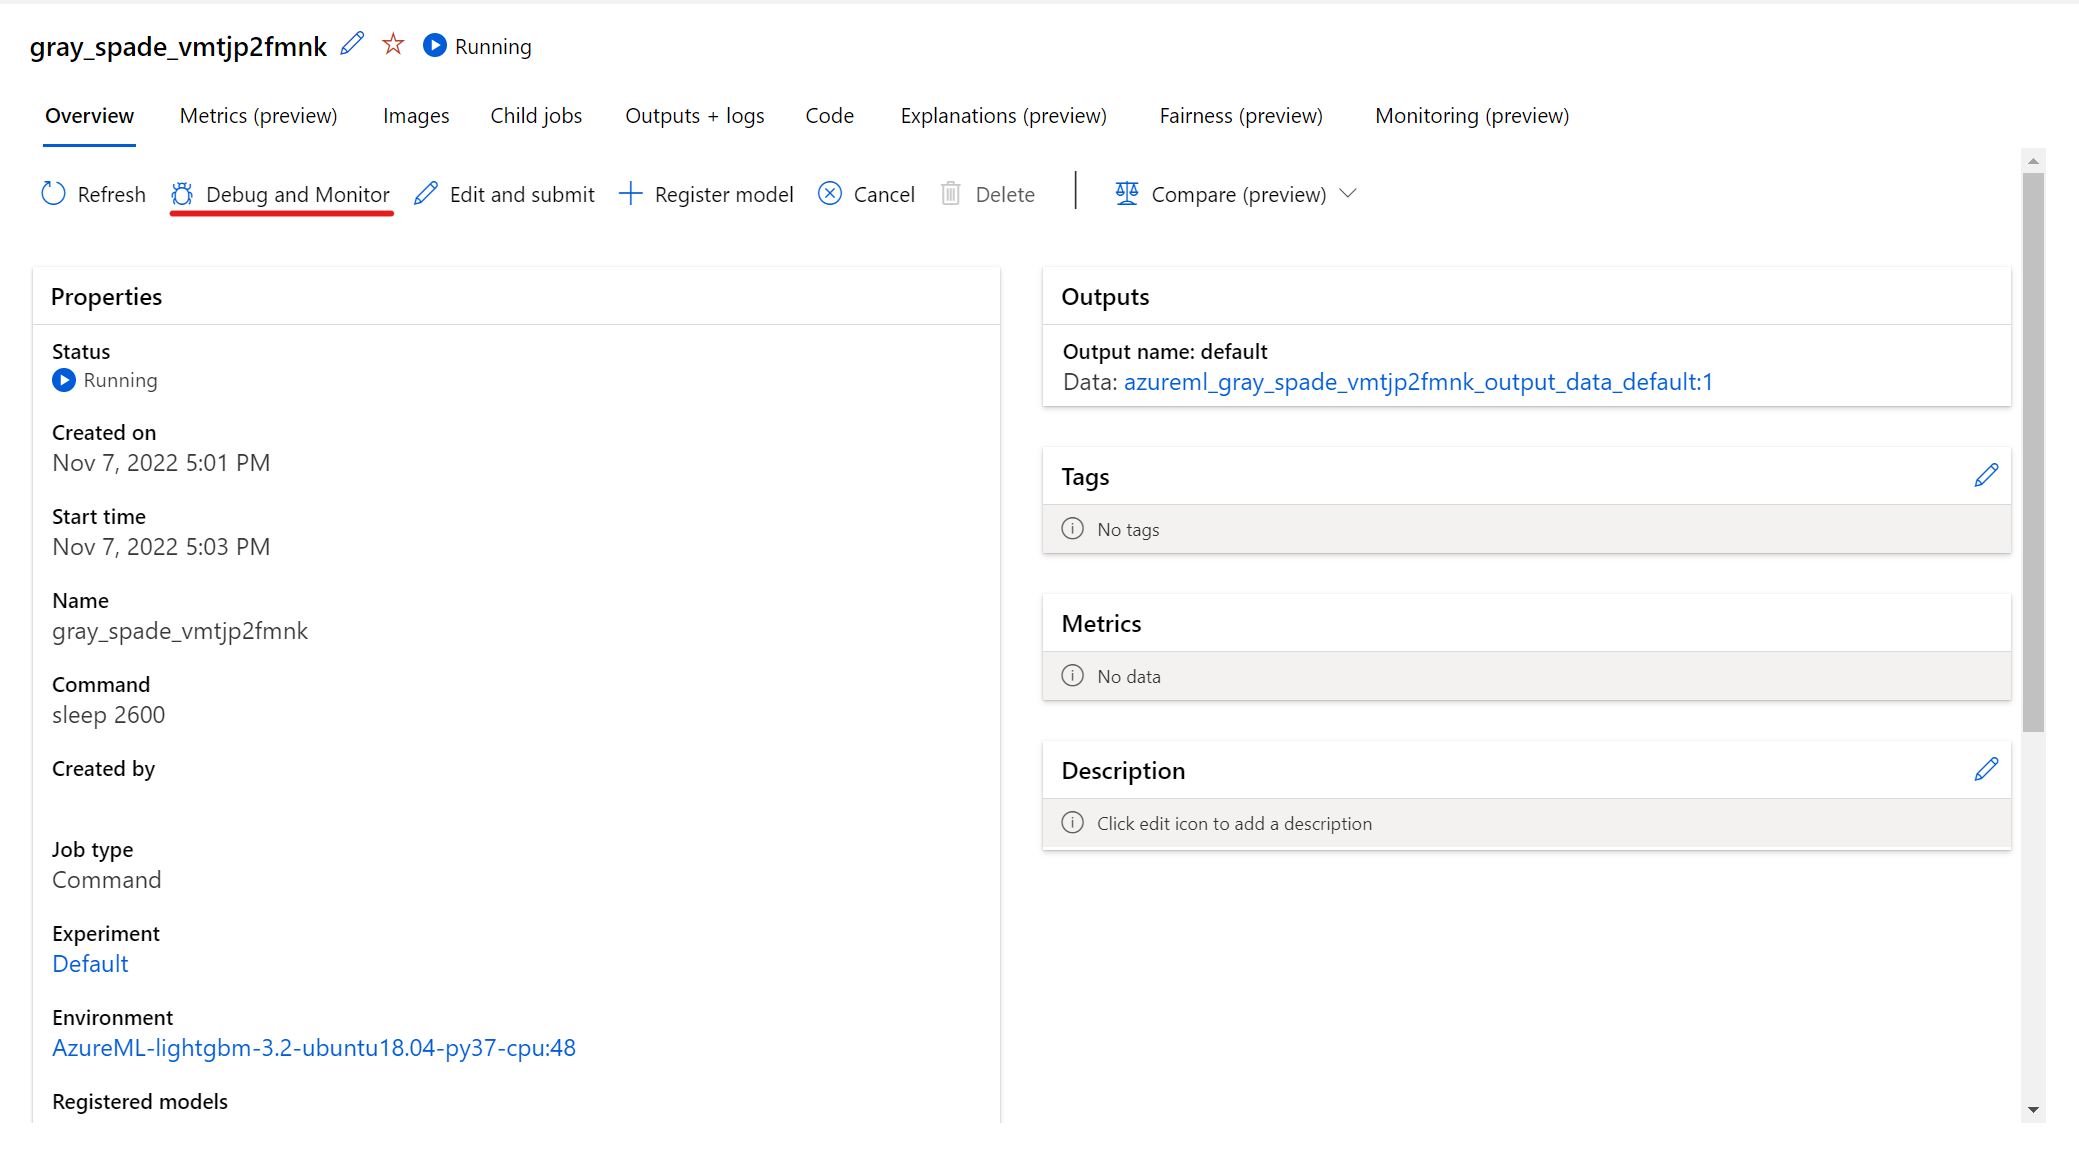
When you select the applications in the panel, you open a new tab for the applications. You can access the applications only when they're in Running status and only the job owner is authorized to access the applications. If you're training on multiple nodes, you can pick the specific node you want to interact with.

It might take a few minutes to start the job and the training applications specified during job creation.
Interact with the applications
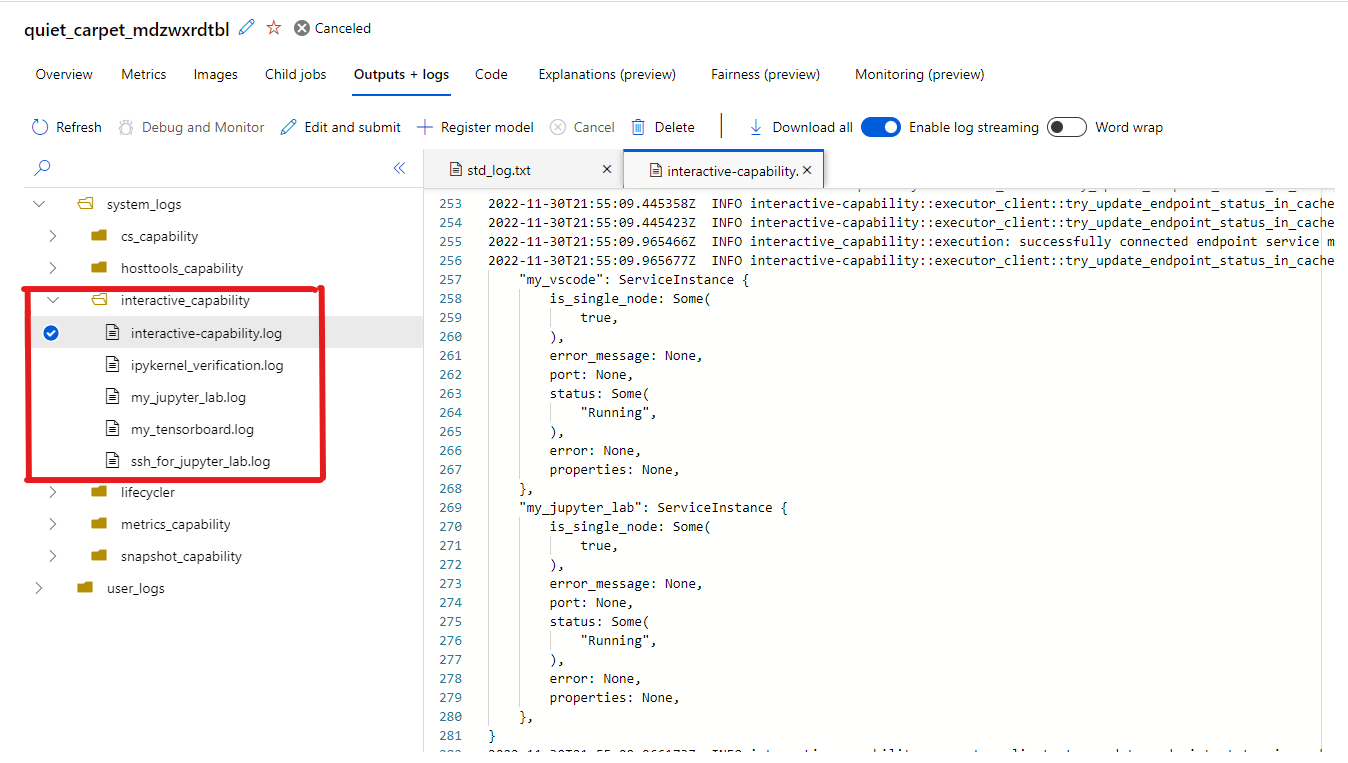
When you select the endpoints to interact with your job, you're taken to the user container under your working directory. You can access your code, inputs, outputs, and logs. If you run into any issues while connecting to the applications, you can find the interactive capability and applications logs in system_logs->interactive_capability under the Outputs + logs tab.
You can open a terminal from Jupyter Lab and start interacting within the job container. You can also directly iterate on your training script by using Jupyter Lab.
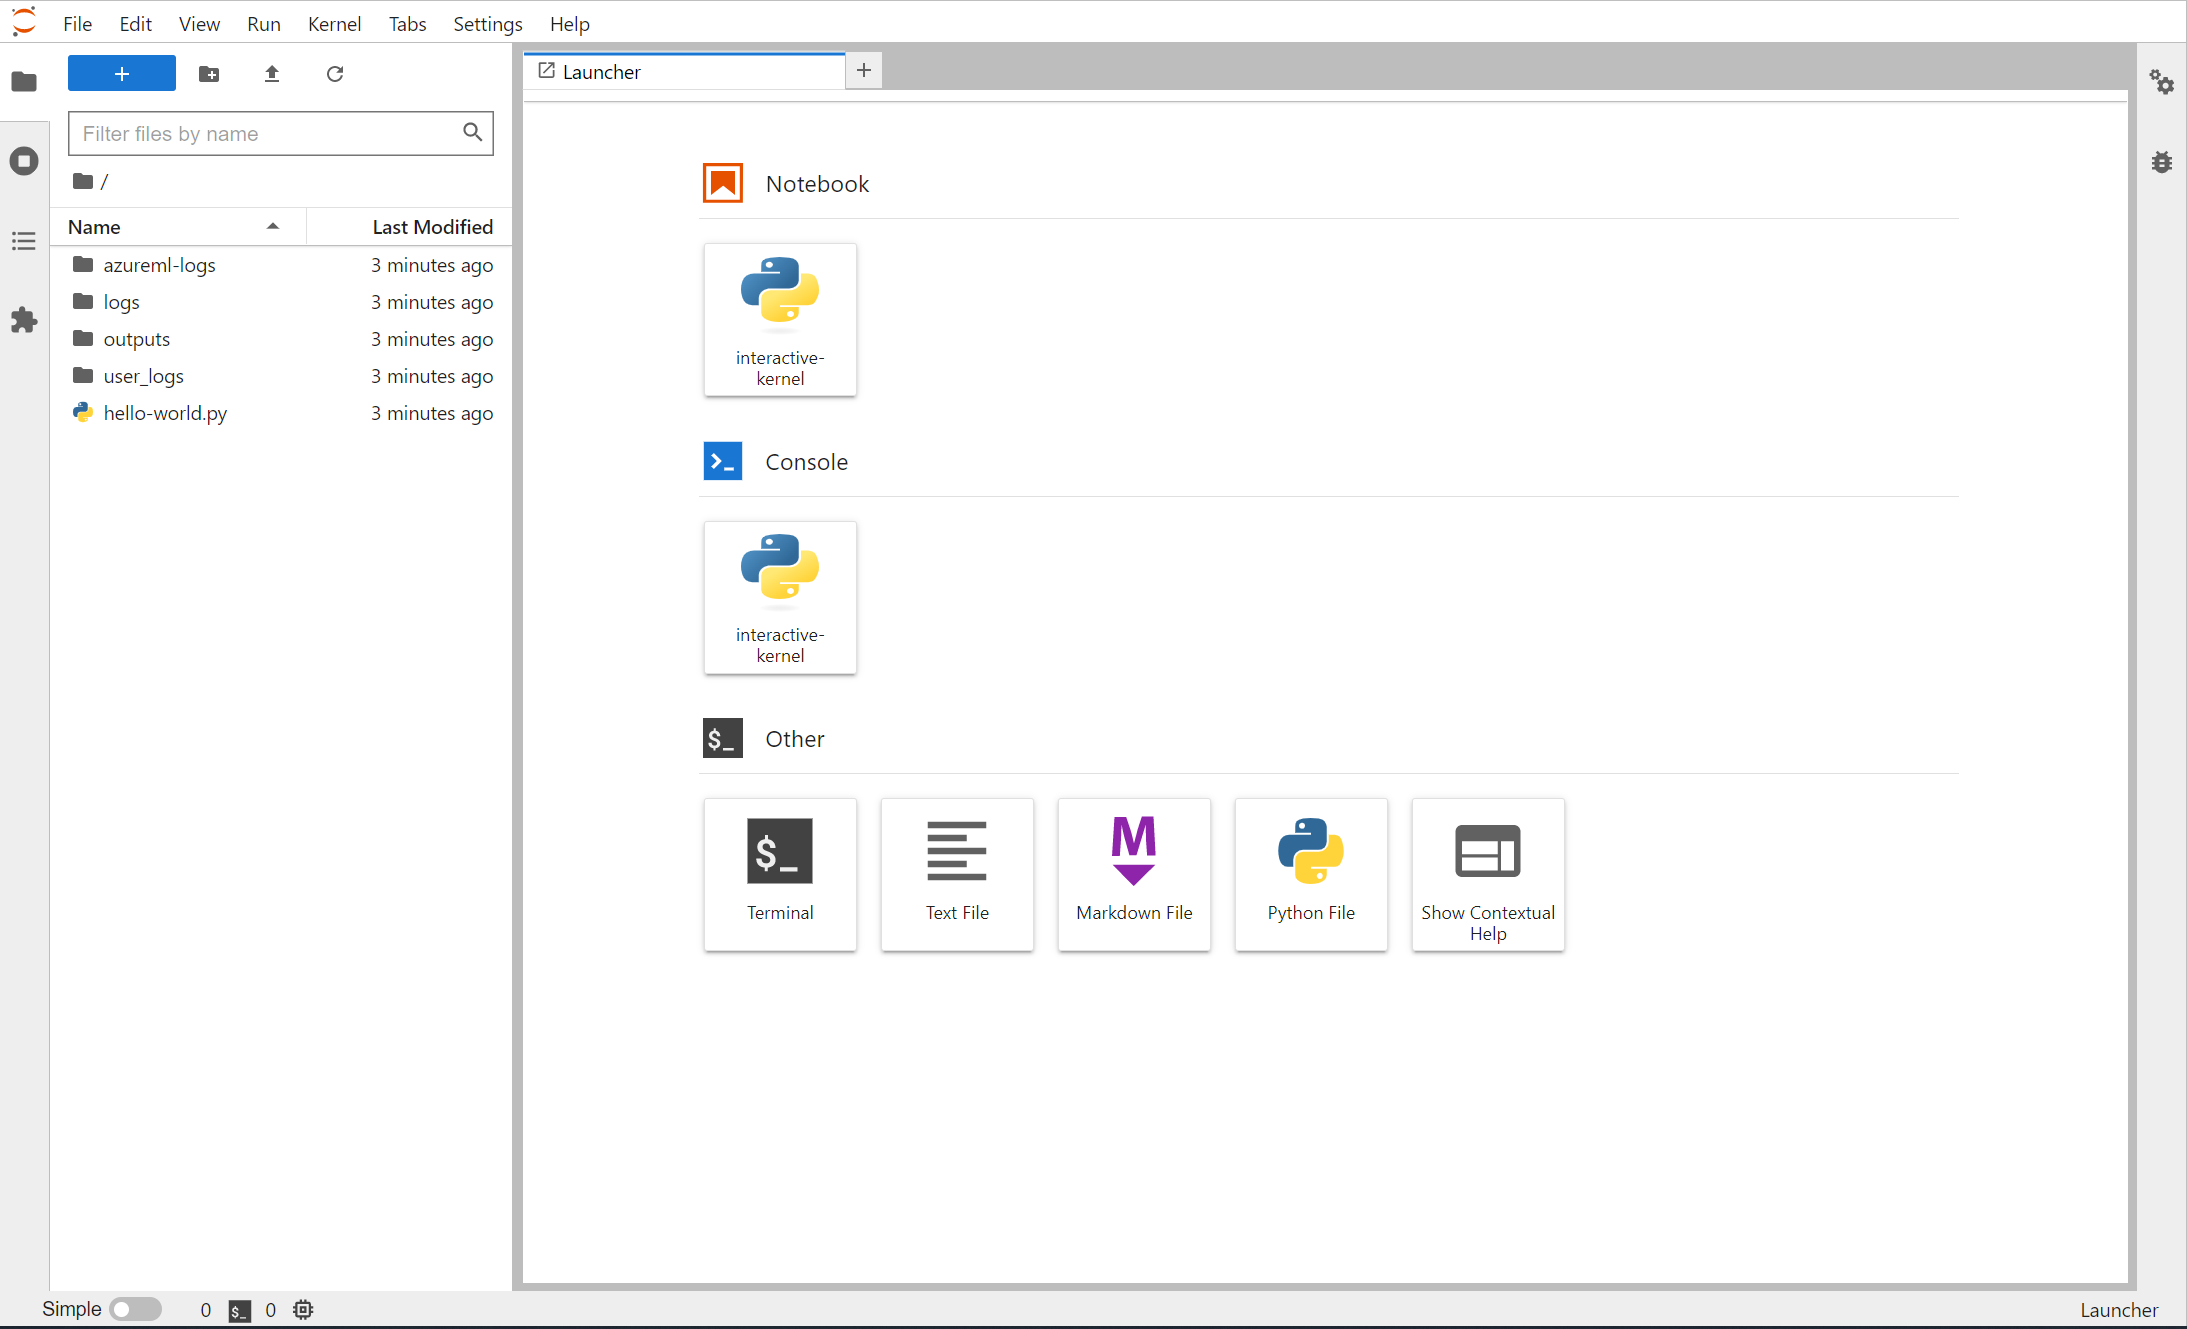
You can also interact with the job container within VS Code. To attach a debugger to a job during job submission and pause execution, navigate here.
Note
Private link-enabled workspaces aren't currently supported when interacting with the job container by using VS Code.

If you log TensorFlow events for your job, you can use TensorBoard to monitor the metrics while your job is running.

End job
When you're done with the interactive training, you can go to the job details page to cancel the job. Canceling the job releases the compute resource. Alternatively, use az ml job cancel --name <your job name> --resource-group <your resource group name> --workspace-name <your workspace name> in the CLI or ml_client.jobs.begin_cancel("<job name>") in the SDK.

Attach a debugger to a job
To submit a job with a debugger attached and the execution paused, use debugpy and VS Code. You must install debugpy in your job environment.
Note
Private link-enabled workspaces aren't currently supported when attaching a debugger to a job in VS Code.
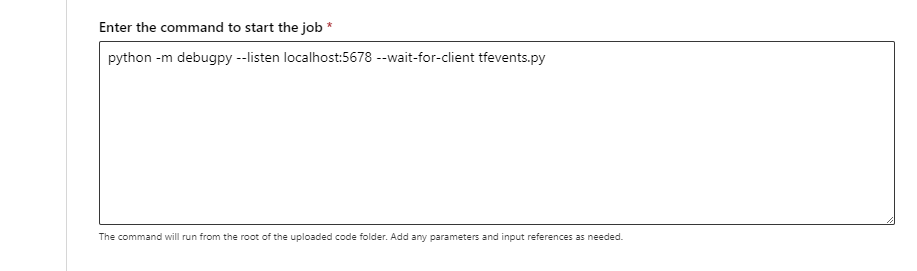
- During job submission (either through the UI, the CLI, or the SDK), use the debugpy command to run your Python script. For example, the following screenshot shows a sample command that uses debugpy to attach the debugger for a TensorFlow script (
tfevents.pycan be replaced with the name of your training script).
After you submit the job, connect to the VS Code and select the built-in debugger.

Use the Remote Attach debug configuration to attach to the submitted job and pass in the path and port you configured in your job submission command. You can also find this information on the job details page.
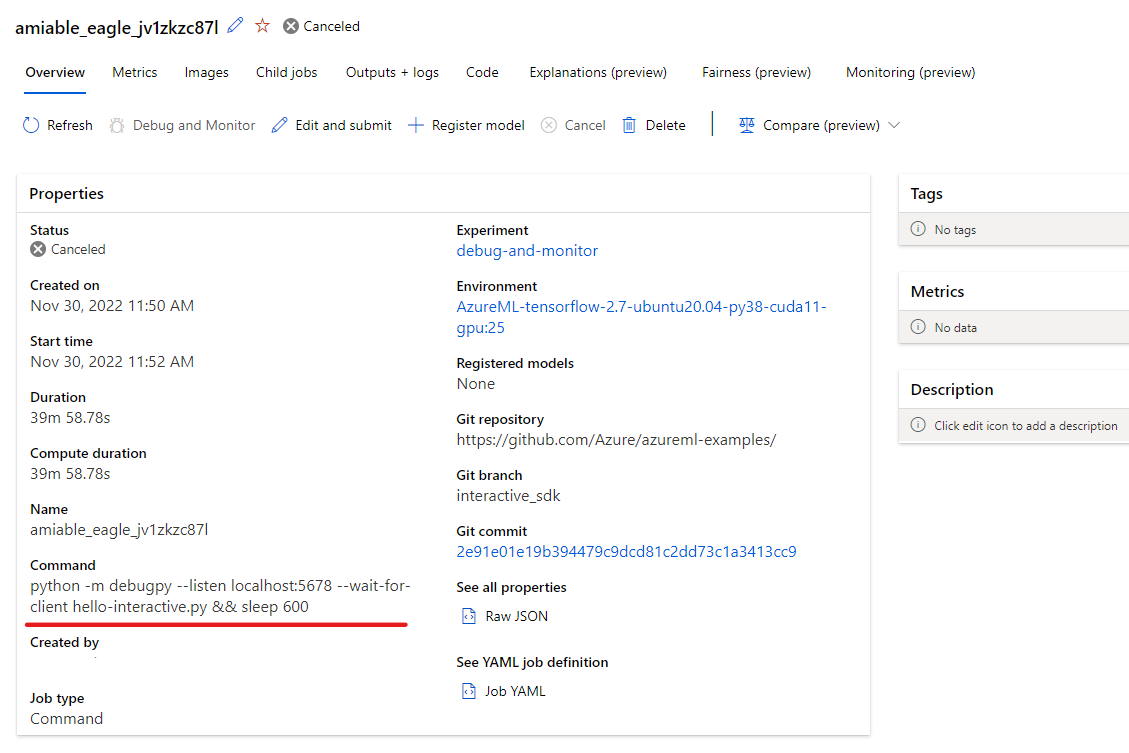

Set breakpoints and walk through your job execution as you would in your local debugging workflow.

Note
If you use debugpy to start your job, your job doesn't execute unless you attach the debugger in VS Code and execute the script. If you don't attach the debugger, the compute is reserved until the job is cancelled.
Next steps
- Learn more about how and where to deploy a model.