Note
Access to this page requires authorization. You can try signing in or changing directories.
Access to this page requires authorization. You can try changing directories.
This article contains all the monitoring reference information for this service.
See Monitor Azure Stream Analytics for details on the data you can collect for Azure Stream Analytics and how to use it.
Metrics
This section lists all the automatically collected platform metrics for this service. These metrics are also part of the global list of all platform metrics supported in Azure Monitor.
For information on metric retention, see Azure Monitor Metrics overview.
Azure Stream Analytics provides plenty of metrics that you can use to monitor and troubleshoot your query and job performance. You can view data from these metrics on the Overview page of the Azure portal, in the Monitoring section.

If you want to check a specific metric, select Metrics in the Monitoring section. On the page that appears, select the metric.

Supported metrics for Microsoft.StreamAnalytics/streamingjobs
The following table lists the metrics available for the Microsoft.StreamAnalytics/streamingjobs resource type.
- All columns may not be present in every table.
- Some columns might be beyond the viewing area of the page. Select Expand table to view all available columns.
Table headings
- Category - The metrics group or classification.
- Metric - The metric display name as it appears in the Azure portal.
- Name in REST API - The metric name as referred to in the REST API.
- Unit - Unit of measure.
- Aggregation - The default aggregation type. Valid values: Average (Avg), Minimum (Min), Maximum (Max), Total (Sum), Count.
- Dimensions - Dimensions available for the metric.
- Time Grains - Intervals at which the metric is sampled. For example,
PT1Mindicates that the metric is sampled every minute,PT30Mevery 30 minutes,PT1Hevery hour, and so on. - DS Export- Whether the metric is exportable to Azure Monitor Logs via diagnostic settings. For information on exporting metrics, see Create diagnostic settings in Azure Monitor.
Metrics descriptions
Azure Stream Analytics provides the following metrics for you to monitor your job's health.
| Metric | Definition |
|---|---|
| Backlogged Input Events | Number of input events that are backlogged. A nonzero value for this metric implies that your job can't keep up with the number of incoming events. If this value is slowly increasing or is consistently nonzero, you should scale out your job. To learn more, see Understand and adjust streaming units. |
| Data Conversion Errors | Number of output events that couldn't be converted to the expected output schema. To drop events that encounter this scenario, you can change the error policy to Drop. |
| CPU % Utilization (preview) | Percentage of CPU that your job utilizes. Even if this value is very high (90 percent or more), you shouldn't increase the number of SUs based on this metric alone. If the number of backlogged input events or watermark delays increases, you can then use this metric to determine if the CPU is the bottleneck. This metric might have intermittent spikes. We recommend that you do scale tests to determine the upper bound of your job after which inputs are backlogged or watermark delays increase because of a CPU bottleneck. |
| Early Input Events | Events whose application time stamp is earlier than their arrival time by more than 5 minutes. |
| Failed Function Requests | Number of failed Azure Machine Learning function calls (if present). |
| Function Events | Number of events sent to the Azure Machine Learning function (if present). |
| Function Requests | Number of calls to the Azure Machine Learning function (if present). |
| Input Deserialization Errors | Number of input events that couldn't be deserialized. |
| Input Event Bytes | Amount of data that the Stream Analytics job receives, in bytes. You can use this metric to validate that events are being sent to the input source. |
| Input Events | Number of records deserialized from the input events. This count doesn't include incoming events that result in deserialization errors. Stream Analytics can ingest the same events multiple times in scenarios like internal recoveries and self-joins. Don't expect Input Events and Output Events metrics to match if your job has a simple pass-through query. |
| Input Sources Received | Number of messages that the job receives. For Azure Event Hubs, a message is a single EventData item. For Azure Blob Storage, a message is a single blob. Note that input sources are counted before deserialization. If there are deserialization errors, input sources can be greater than input events. Otherwise, input sources can be less than or equal to input events because each message can contain multiple events. |
| Late Input Events | Events that arrived later than the configured tolerance window for late arrivals. Learn more about Azure Stream Analytics event order considerations. |
| Out-of-Order Events | Number of events received out of order that were either dropped or given an adjusted time stamp, based on the event ordering policy. This metric can be affected by the configuration of the Out-of-Order Tolerance Window setting. |
| Output Events | Amount of data that the Stream Analytics job sends to the output target, in number of events. |
| Runtime Errors | Total number of errors related to query processing. It excludes errors found while ingesting events or outputting results. |
| SU (Memory) % Utilization | Percentage of memory that your job utilizes. If this metric is consistently over 80 percent, the watermark delay is rising, and the number of backlogged events is rising, consider increasing streaming units (SUs). High utilization indicates that the job is using close to the maximum allocated resources. |
| Watermark Delay | Maximum watermark delay across all partitions of all outputs in the job. |
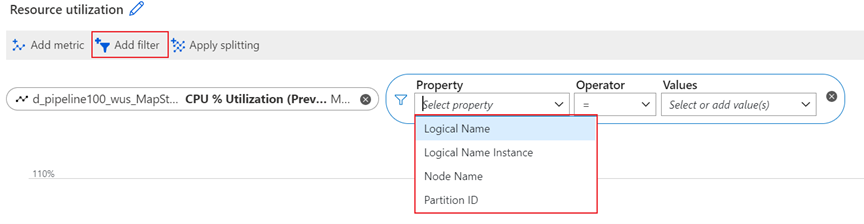
Metric dimensions
For information about what metric dimensions are, see Multi-dimensional metrics.
This service has the following dimensions associated with its metrics.
| Dimension | Definition |
|---|---|
| Logical Name | The input or output name for a Stream Analytics job. |
| Partition ID | The ID of the input data partition from an input source. For example, if the input source is an event hub, the partition ID is the event hub's partition ID. For embarrassingly parallel jobs, Partition ID in the output is the same as it is in the input. |
| Node Name | The identifier of a streaming node that's provisioned when your job runs. A streaming node represents the amount of compute and memory resources allocated to your job. |

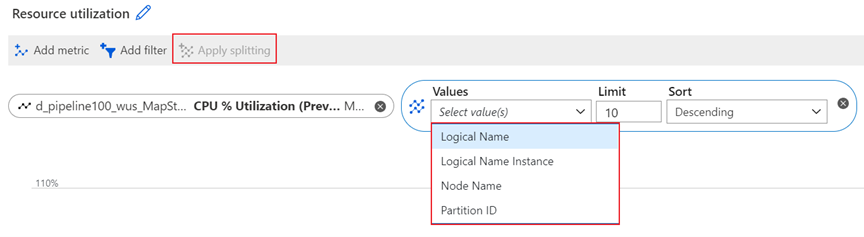
Logical Name dimension
Logical Name is the input or output name for a Stream Analytics job. For example, assume that a Stream Analytics job has four inputs and five outputs. You'll see the four individual logical inputs and five individual logical outputs when you split input-related and output-related metrics by this dimension.


The Logical Name dimension is available for filtering and splitting the following metrics:
- Backlogged Input Events
- Data Conversion Errors
- Early Input Events
- Input Deserialization Errors
- Input Event Bytes
- Input Events
- Input Source Received
- Late Input Events
- Out-of-Order Events
- Output Events
- Watermark Delay
Node Name dimension
A streaming node represents a set of compute resources that's used to process your input data. Every six streaming units (SUs) translate to one node, which the service automatically manages on your behalf. For more information about the relationship between streaming units and streaming nodes, see Understand and adjust streaming units.
Node Name is a dimension at the streaming node level. It can help you to drill down certain metrics to the specific streaming node level. For example, you can split the CPU % Utilization metric by streaming node level to check the CPU utilization of an individual streaming node.

The Node Name dimension is available for filtering and splitting the following metrics:
- Backlogged Input Events
- CPU % Utilization (preview)
- Input Events
- Output Events
- SU (Memory) % Utilization
- Watermark Delay
Partition ID dimension
When streaming data is ingested into the Azure Stream Analytics service for processing, the input data is distributed to streaming nodes according to the partitions in the input source. The Partition ID dimension is the ID of the input data partition from the input source.
For example, if the input source is an event hub, the partition ID is the event hub's partition ID. Partition ID in the input is the same as it is in the output.

The Partition ID dimension is available for filtering and splitting the following metrics:
- Backlogged Input Events
- Data Conversion Errors
- Early Input Events
- Input Deserialization Errors
- Input Event Bytes
- Input Events
- Input Source Received
- Late Input Events
- Output Events
- Watermark Delay
Resource logs
This section lists the types of resource logs you can collect for this service. The section pulls from the list of all resource logs category types supported in Azure Monitor.
Resource logs schema
All logs are stored in JSON format. Each entry has the following common string fields:
| Name | Description |
|---|---|
| time | Timestamp (in UTC) of the log. |
| resourceId | ID of the resource that the operation took place on, in upper case. It includes the subscription ID, the resource group, and the job name. For example, /SUBSCRIPTIONS/aaaa0a0a-bb1b-cc2c-dd3d-eeeeee4e4e4e/RESOURCEGROUPS/MY-RESOURCE-GROUP/PROVIDERS/MICROSOFT.STREAMANALYTICS/STREAMINGJOBS/MYSTREAMINGJOB. |
| category | Log category, either Execution or Authoring. |
| operationName | Name of the operation that is logged. For example, Send Events: SQL Output write failure to mysqloutput. |
| status | Status of the operation. For example, Failed or Succeeded. |
| level | Log level. For example, Error, Warning, or Informational. |
| properties | Log entry-specific detail, serialized as a JSON string. For more information, see the following sections in this article. |
Execution log properties schema
Execution logs have information about events that happened during Stream Analytics job execution. The schema of properties varies depending on whether the event is a data error or a generic event.
Data errors
Any error that occurs while the job is processing data is in this category of logs. These logs most often are created during data read, serialization, and write operations. These logs don't include connectivity errors. Connectivity errors are treated as generic events. You can learn more about the cause of various different input and output data errors.
| Name | Description |
|---|---|
| Source | Name of the job input or output where the error occurred. |
| Message | Message associated with the error. |
| Type | Type of error. For example, DataConversionError, CsvParserError, or ServiceBusPropertyColumnMissingError. |
| Data | Contains data that is useful to accurately locate the source of the error. Subject to truncation, depending on size. |
Depending on the operationName value, data errors have the following schema:
Serialize events occur during event read operations. They occur when the data at the input doesn't satisfy the query schema for one of these reasons:
Type mismatch during event serialization/deserialization: Identifies the field that's causing the error.
Can't read an event, invalid serialization: Lists information about the location in the input data where the error occurred. Includes blob name for blob input, offset, and a sample of the data.
Send events occur during write operations. They identify the streaming event that caused the error.
Generic events
Generic events cover everything else.
| Name | Description |
|---|---|
| Error | (optional) Error information. Usually, it's the exception information if it's available. |
| Message | Log message. |
| Type | Type of message. Maps to internal categorization of errors. For example, JobValidationError or BlobOutputAdapterInitializationFailure. |
| Correlation ID | GUID that uniquely identifies the job execution. All execution log entries from the time the job starts until the job stops have the same Correlation ID value. |
For reference, see a list of all resource logs category types supported in Azure Monitor or all the resource log category types collected for Azure Stream Analytics.
Azure Monitor Logs tables
This section lists the Azure Monitor Logs tables relevant to this service, which are available for query by Log Analytics using Kusto queries. The tables contain resource log data and possibly more depending on what is collected and routed to them.
Stream Analytics jobs
Activity log
The linked table lists the operations that can be recorded in the activity log for this service. These operations are a subset of all the possible resource provider operations in the activity log.
For more information on the schema of activity log entries, see Activity Log schema.