Note
Access to this page requires authorization. You can try signing in or changing directories.
Access to this page requires authorization. You can try changing directories.
Understand streaming unit and streaming node
Streaming units (SUs) represent the computing resources that execute a Stream Analytics job. The higher the number of SUs, the more CPU and memory resources you allocate for your job. This capacity lets you focus on the query logic and abstracts the need to manage the hardware to run your Stream Analytics job in a timely manner.
Azure Stream Analytics supports two streaming unit structures: SU V1(to be deprecated) and SU V2(recommended).
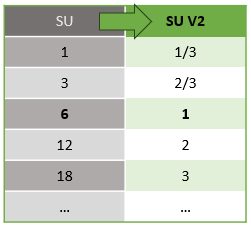
The SU V1 model is Azure Stream Analytics' original offering where every 6 SUs correspond to a single streaming node for a job. Jobs might run with 1 and 3 SUs as well, and they correspond with fractional streaming nodes. Scaling occurs in increments of 6 beyond 6 SU jobs, to 12, 18, 24, and beyond by adding more streaming nodes that provide distributed computing resources.
The SU V2 model (recommended) is a simplified structure with favorable pricing for the same compute resources. In the SU V2 model, 1 SU V2 corresponds to one streaming node for your job. 2 SU V2s correspond to 2 streaming nodes, 3 to 3, and so on. Jobs with 1/3 and 2/3 SU V2s are also available with one streaming node but a fraction of the computing resources. The 1/3 and 2/3 SU V2 jobs provide a cost-effective option for workloads that require smaller scale.
The following table shows the underlying compute power for V1 and V2 streaming units:
For information on SU pricing, visit the Azure Stream Analytics Pricing Page.
Understand streaming unit conversions and where they apply
The system automatically converts streaming units from the REST API layer to the UI (Azure portal and Visual Studio Code). You see this conversion in the Activity log as well, where streaming unit values appear different from the values on the UI. This behavior is by design. REST API fields are limited to integer values, but Stream Analytics jobs support fractional nodes (1/3 and 2/3 streaming units). Azure Stream Analytics UI displays node values as 1/3, 2/3, 1, 2, 3, and so on, while the backend (activity logs, REST API layer) displays the same values multiplied by 10 as 3, 7, 10, 20, and 30 respectively.
| Standard | Standard V2 (UI) | Standard V2 (Backend such as logs, Rest API, etc.) |
|---|---|---|
| 1 | 1/3 | 3 |
| 3 | 2/3 | 7 |
| 6 | 1 | 10 |
| 12 | 2 | 20 |
| 18 | 3 | 30 |
| ... | ... | ... |
This conversion conveys the same granularity and eliminates the decimal point at the API layer for V2 Stock Keeping Units (SKUs). This conversion is automatic and has no impact on your job's performance.
Understand consumption and memory utilization
To achieve low latency stream processing, Azure Stream Analytics jobs perform all processing in memory. When the job runs out of memory, the streaming job fails. As a result, for a production job, it's important to monitor a streaming job’s resource usage, and make sure there's enough resource allocated to keep the jobs running 24/7.
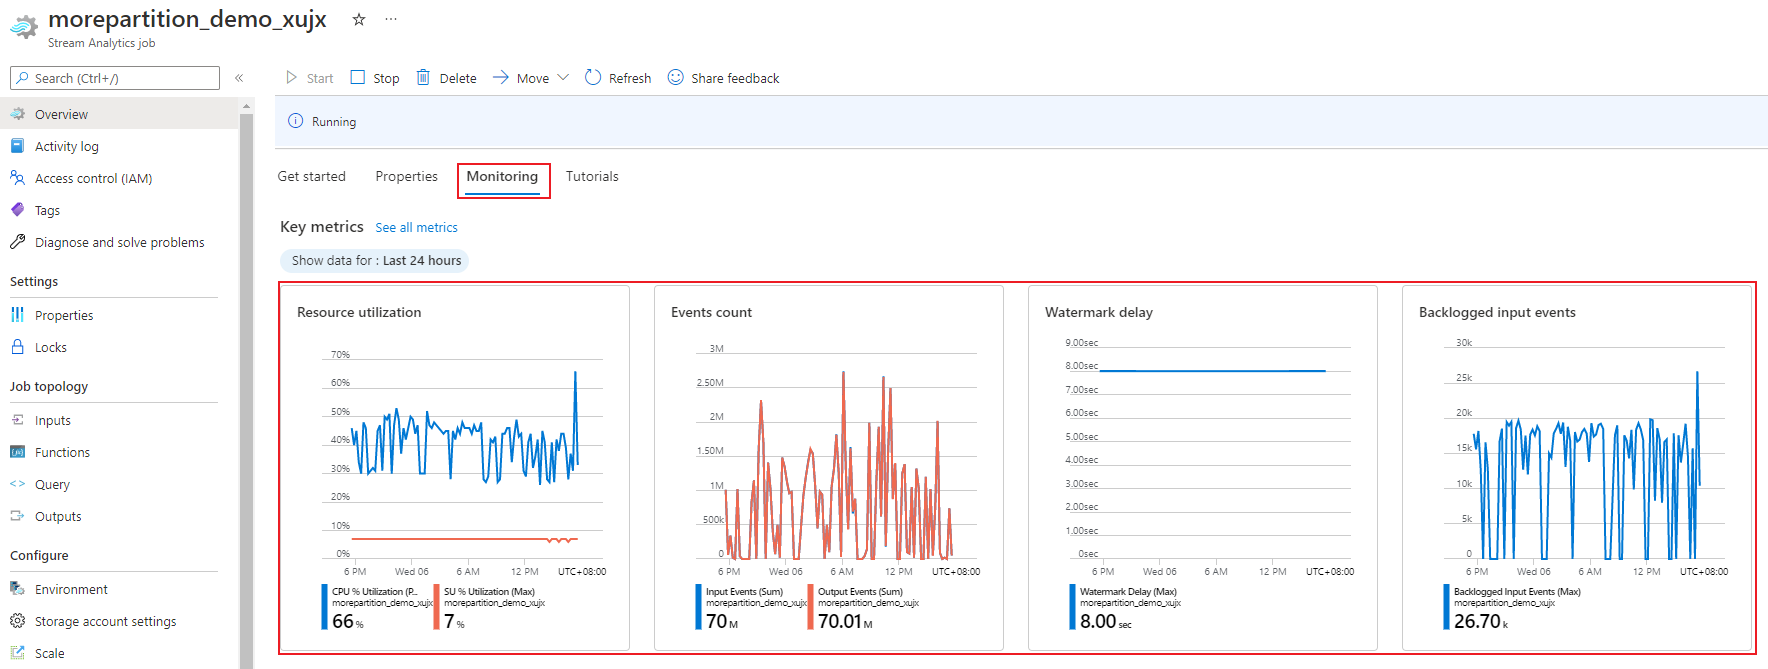
The SU % utilization metric, which ranges from 0% to 100%, describes the memory consumption of your workload. For a streaming job with minimal footprint, this metric is usually between 10% to 20%. If SU% utilization is high (above 80%), or if input events get backlogged (even with a low SU% utilization since it doesn't show CPU usage), your workload likely requires more compute resources, which requires you to increase the number of streaming units. It's best to keep the SU metric below 80% to account for occasional spikes. To react to increased workloads and increase streaming units, consider setting an alert of 80% on the SU Utilization metric. Also, you can use watermark delay and backlogged events metrics to see if there's an impact.
Configure Stream Analytics streaming units (SUs)
Sign in to Azure portal.
In the list of resources, find the Stream Analytics job that you want to scale and then open it.
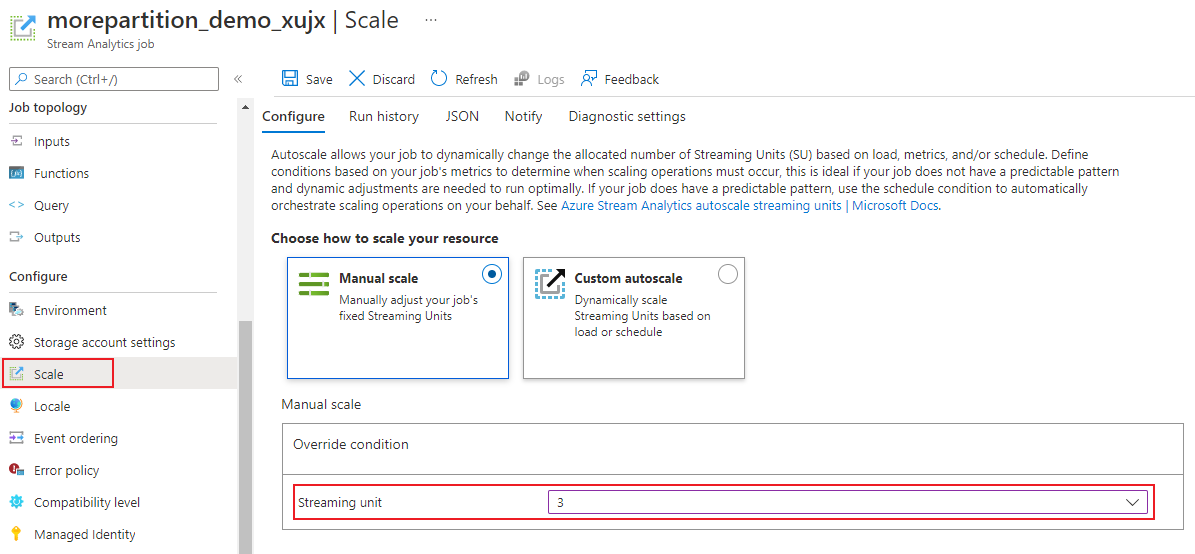
In the job page, under the Configure heading, select Scale. The default number of SUs is 1 when creating a job.
Choose the SU option in the drop-down list to set the SUs for the job. You're limited to a specific SU range.
You can change the number of SUs assigned to your job while it's running. You might be restricted to choosing from a set of SU values when the job is running if your job uses a nonpartitioned output or has a multi-step query with different PARTITION BY values.
Monitor job performance
Using the Azure portal, you can track the performance-related metrics of a job. For more information about the metrics definition, see Azure Stream Analytics job metrics. For more information about metrics monitoring in the portal, see Monitor Stream Analytics job with Azure portal.
Calculate the expected throughput of the workload. If the throughput is less than expected, tune the input partition, tune the query, and add SUs to your job.
How many SUs are required for a job?
The number of required SUs depends on the partition configuration for the inputs and the query that you define within the job. The Scale page allows you to set the right number of SUs. Allocate more SUs than you think you need. The Stream Analytics processing engine optimizes for latency and throughput at the cost of allocating extra memory.
In general, start with 1 SU V2 for queries that don't use PARTITION BY. Then find the best number by trial and error. Modify the number of SUs after you pass representative amounts of data and examine the SU% Utilization metric. The maximum number of streaming units that a Stream Analytics job can use depends on the number of steps in the query defined for the job and the number of partitions in each step. You can learn more about the limits here.
For more information about choosing the right number of SUs, see Scale Azure Stream Analytics jobs to increase throughput.
Note
The number of SUs that a job needs depends on the partition configuration for the inputs and on the query that you define for the job. You can select up to your quota in SUs for a job. For information on Azure Stream Analytics subscription quota, visit Stream Analytics limits. To increase SUs for your subscriptions beyond this quota, contact Microsoft Support. Valid values for SUs per job are 1/3, 2/3, 1, 2, 3, and so on.
Factors that increase SU% utilization
Temporal (time-oriented) query elements are the core set of stateful operators provided by Stream Analytics. Stream Analytics manages the state of these operations internally on your behalf. It manages memory consumption, checkpointing for resiliency, and state recovery during service upgrades. Even though Stream Analytics fully manages the states, consider many best practice recommendations.
A job with complex query logic can have high SU% utilization even when it isn't continuously receiving input events. It can happen after a sudden spike in input and output events. The job might continue to maintain state in memory if the query is complex.
Transient errors or system initiated upgrades can cause SU% utilization to suddenly drop to 0 for a short period before coming back to expected levels. Increasing number of streaming units for a job might not reduce SU% Utilization if your query isn't fully parallel.
When you compare utilization over a period of time, use event rate metrics. The InputEvents and OutputEvents metrics show how many events were read and processed. Metrics such as deserialization errors indicate the number of error events. When the number of events per time unit increases, SU% increases in most cases.
Stateful query logic in temporal elements
One of the unique capabilities of Azure Stream Analytics jobs is stateful processing, such as windowed aggregates, temporal joins, and temporal analytic functions. Each of these operators keeps state information. The maximum window size for these query elements is seven days.
The temporal window concept appears in several Stream Analytics query elements:
Windowed aggregates:
GROUP BYof tumbling, hopping, and sliding windowsTemporal joins:
JOINwithDATEDIFFfunctionTemporal analytic functions:
ISFIRST,LAST, andLAGwithLIMIT DURATION
The following factors influence the memory used (part of streaming units metric) by Stream Analytics jobs:
Windowed aggregates
The memory consumed (state size) for a windowed aggregate isn't always directly proportional to the window size. Instead, the memory consumed is proportional to the cardinality of the data, or the number of groups in each time window.
For example, in the following query, the number associated with clusterid is the cardinality of the query.
SELECT count(*)
FROM input
GROUP BY  clusterid, tumblingwindow (minutes, 5)
To mitigate problems caused by high cardinality in the previous query, send events to Event Hubs partitioned by clusterid. Scale out the query by allowing the system to process each input partition separately by using PARTITION BY as shown in the following example:
SELECT count(*)
FROM input PARTITION BY PartitionId
GROUP BY PartitionId, clusterid, tumblingwindow (minutes, 5)
Once the query is partitioned, it's spread out over multiple nodes. As a result, the number of clusterid values coming into each node is reduced, which reduces the cardinality of the GROUP BY operator.
Partition Event Hubs by the grouping key to avoid the need for a reduce step. For more information, see Event Hubs overview.
Temporal joins
The memory consumed (state size) by a temporal join is proportional to the number of events in the temporal wiggle room of the join. This number equals the event input rate multiplied by the wiggle room size. In other words, the memory consumed by joins is proportional to the DateDiff time range multiplied by the average event rate.
The number of unmatched events in the join affects the memory utilization for the query. The following query looks for the ad impressions that generate clicks:
SELECT clicks.id
FROM clicks
INNER JOIN impressions ON impressions.id = clicks.id AND DATEDIFF(hour, impressions, clicks) between 0 AND 10.
In this example, it's possible that lots of ads are shown and few people click on them. You need to keep all the events in the time window. Memory consumed is proportional to the window size and event rate.
To remediate this behavior, send events to Event Hubs partitioned by the join keys (ID in this case), and scale out the query by allowing the system to process each input partition separately using PARTITION BY as shown:
SELECT clicks.id
FROM clicks PARTITION BY PartitionId
INNER JOIN impressions PARTITION BY PartitionId
ON impression.PartitionId = clicks.PartitionId AND impressions.id = clicks.id AND DATEDIFF(hour, impressions, clicks) between 0 AND 10
Once you partition the query, you spread it out over multiple nodes. As a result, you reduce the number of events coming into each node and reduce the size of the state kept in the join window.
Temporal analytic functions
The memory consumed (state size) by a temporal analytic function is proportional to the event rate multiplied by the duration. The memory consumed by analytic functions isn't proportional to the window size, but rather to the partition count in each time window.
The remediation is similar to temporal join. You can scale out the query by using PARTITION BY.
Out of order buffer
You can configure the out of order buffer size in the Event Ordering configuration pane. The buffer holds inputs for the duration of the window and reorders them. The size of the buffer is proportional to the event input rate multiplied by the out of order window size. The default window size is 0.
To remediate overflow of the out of order buffer, scale out query using PARTITION BY. Once the query is partitioned out, it's spread out over multiple nodes. As a result, the number of events coming into each node is reduced thereby reducing the number of events in each reorder buffer.
Input partition count
Each job input partition has a buffer. The larger the number of input partitions, the more resources the job consumes. For each streaming unit, Azure Stream Analytics can process roughly 7 MB/s of input. Therefore, you can optimize by matching the number of Stream Analytics streaming units with the number of partitions in your event hub.
Typically, a job configured with one-third streaming unit is sufficient for an event hub with two partitions (which is the minimum for event hub). If the event hub has more partitions, your Stream Analytics job consumes more resources, but it doesn't necessarily use the extra throughput provided by Event Hubs.
For a job with one V2 streaming unit, you might need 4 or 8 partitions from the event hub. However, avoid too many unnecessary partitions since they cause excessive resource usage. For example, an event hub with 16 partitions or larger in a Stream Analytics job that has 1 streaming unit.
Reference data
Azure Stream Analytics loads reference data into memory for fast lookup. With the current implementation, each join operation with reference data keeps a copy of the reference data in memory, even if you join with the same reference data multiple times. For queries with PARTITION BY, each partition has a copy of the reference data, so the partitions are fully decoupled. With the multiplier effect, memory usage can quickly get very high if you join with reference data multiple times with multiple partitions.
Use of UDF functions
When you add a UDF function, Azure Stream Analytics loads the JavaScript runtime into memory, which affects the SU%.
Next steps
- Create parallelizable queries in Azure Stream Analytics
- Scale Azure Stream Analytics jobs to increase throughput
- Azure Stream Analytics job metrics
- Azure Stream Analytics job metrics dimensions
- Monitor Stream Analytics job with Azure portal
- Analyze Stream Analytics job performance with metrics dimensions
- Understand and adjust Streaming Units


