使用 Application Insights Profiler 探查在 Azure 虚拟机或虚拟机规模集上运行的 Web 应用
注意
建议使用 Azure Az PowerShell 模块与 Azure 交互。 请参阅安装 Azure PowerShell 以开始使用。 若要了解如何迁移到 Az PowerShell 模块,请参阅 将 Azure PowerShell 从 AzureRM 迁移到 Az。
Azure Application Insights Profiler 也可以部署在以下服务上:
在虚拟机或虚拟机规模集上部署 Profiler
本文介绍如何在 Azure 虚拟机 (VM) 或 Azure 虚拟机规模集上运行 Application Insights Profiler。 Profiler 与适用于 VM 的 Azure 诊断扩展一同安装。 请将该扩展配置为运行 Profiler,并将 Application Insights SDK 内置到应用程序中。
将 Application Insights SDK 添加到 ASP.NET 应用程序。
若要查看请求的探查结果,必须将请求遥测数据发送到 Application Insights。
在 VM 上安装 Azure 诊断扩展。 有关完整的资源管理器模板示例,请参阅:
-
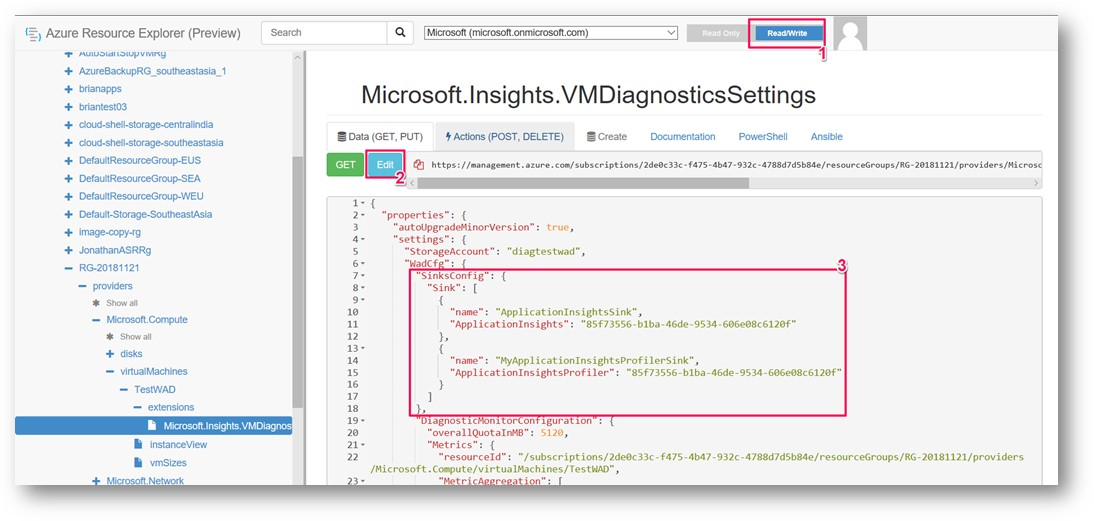
关键部分是 WadCfg 中的 ApplicationInsightsProfilerSink。 若要告知 Azure 诊断启用探查器,以将数据发送到 iKey,请在此部分添加另一个接收器。
"SinksConfig": {
  "Sink": [
    {
      "name": "ApplicationInsightsSink",
      "ApplicationInsights": "85f73556-b1ba-46de-9534-606e08c6120f"
    },
    {
      "name": "MyApplicationInsightsProfilerSink",
      "ApplicationInsightsProfiler": "85f73556-b1ba-46de-9534-606e08c6120f"
    }
  ]
},
部署修改后的环境部署定义。
应用修改通常涉及到完整的模板部署或者通过 PowerShell cmdlet 或 Visual Studio 进行的基于云服务的发布。
以下 PowerShell 命令是用于现有虚拟机的一种替代方法,该方法仅涉及 Azure 诊断扩展。 将前面提到的 ProfilerSink 添加到 Get-AzVMDiagnosticsExtension 命令返回的配置。 然后将更新后的配置传递给 Set-AzVMDiagnosticsExtension 命令。
$ConfigFilePath = [IO.Path]::GetTempFileName()
# After you export the currently deployed Diagnostics config to a file, edit it to include the ApplicationInsightsProfiler sink.
(Get-AzVMDiagnosticsExtension -ResourceGroupName "MyRG" -VMName "MyVM").PublicSettings | Out-File -Verbose $ConfigFilePath
# Set-AzVMDiagnosticsExtension might require the -StorageAccountName argument
# If your original diagnostics configuration had the storageAccountName property in the protectedSettings section (which is not downloadable), be sure to pass the same original value you had in this cmdlet call.
Set-AzVMDiagnosticsExtension -ResourceGroupName "MyRG" -VMName "MyVM" -DiagnosticsConfigurationPath $ConfigFilePath
如果目标应用程序通过 IIS 运行,请启用
IIS Http TracingWindows 功能。与环境建立远程访问连接,然后使用 添加 Windows 功能 窗口。 或者,以管理员身份在 PowerShell 中运行以下命令:
Enable-WindowsOptionalFeature -FeatureName IIS-HttpTracing -Online -All如果无法建立远程访问连接,可以使用 Azure CLI 运行以下命令:
az vm run-command invoke -g MyResourceGroupName -n MyVirtualMachineName --command-id RunPowerShellScript --scripts "Enable-WindowsOptionalFeature -FeatureName IIS-HttpTracing -Online -All"
部署应用程序。
使用 Azure 资源浏览器设置 Profiler 接收器
目前无法从门户设置 Application Insights Profiler 接收器。 可以不如上所述使用 PowerShell,改为使用 Azure 资源浏览器来设置接收器。 但请注意,如果再次部署 VM,接收器将丢失。 部署 VM 时,你需要更新所使用的配置来保留此设置。
通过查看为你的虚拟机安装的扩展,检查是否安装了 Azure 诊断扩展。
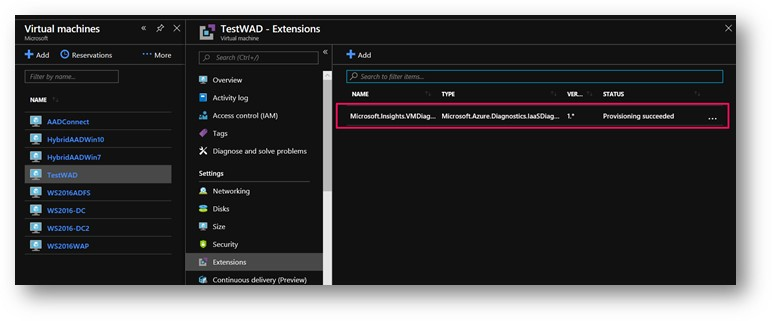
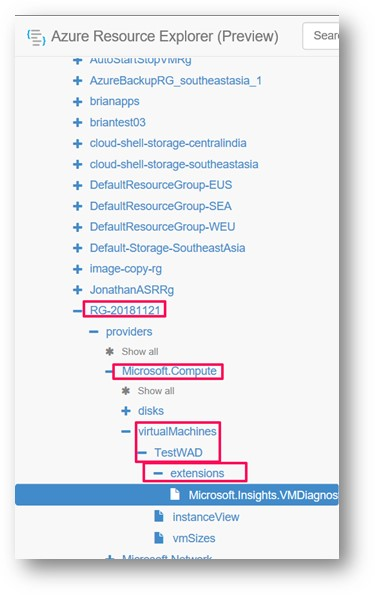
查找你的 VM 的 VM 诊断扩展。 转到 https://portal.azure.cn/#blade/HubsExtension/ArmExplorerBlade。 展开你的资源组、Microsoft.Compute 虚拟机、虚拟机名称和扩展。
将 Application Insights Profiler 接收器添加到 WadCfg 下的 SinksConfig 节点。 如果还没有 SinksConfig 部分,可能需要添加一个。 确保在设置中指定正确的 Application Insights iKey。 你需要在右上角将资源管理器模式切换为“读取/写入”,然后按蓝色的“编辑”按钮。
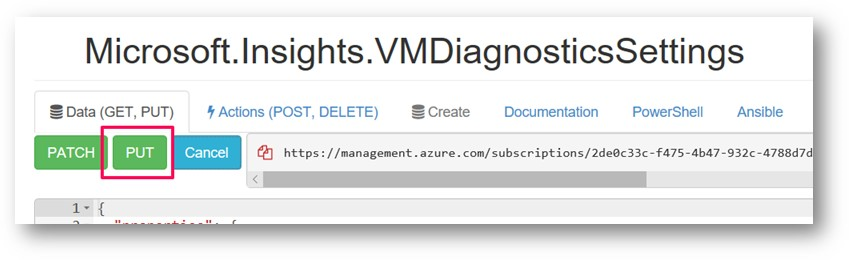
编辑完配置后,按“Put”。 如果 put 操作成功,则屏幕中间会显示一个绿色的对号。
Profiler 是否可以在本地服务器上运行?
我们没有计划对本地服务器支持 Application Insights Profiler。
后续步骤
- 生成到应用程序的流量(例如,启动可用性测试)。 然后等待 10 到 15 分钟,这样跟踪就会开始发送到 Application Insights 实例。
- 请参阅 Azure 门户中的 Profiler 跟踪。
- 排查 Profiler 问题时如需帮助,请参阅 Profiler 故障排除。