可以使用 M 查询和 Log Analytics API 来集成 Azure Monitor Log Analytics 和 Microsoft Excel。 通过此集成,可以发送特定数量的记录和 MB 数据。 这些限制记录在 Azure 门户部分的 Azure Monitor Log Analytics 工作区限制中。
注释
由于 Excel 是本地客户端应用程序,因此本地硬件和软件限制会影响其性能以及其处理大型数据集的能力。
先决条件
若要集成 Log Analytics 和 Excel,需要:
- Excel 本地客户端应用程序。
- 具有一些数据的 Log Analytics 工作区。 如果需要,创建诊断设置以将数据发送到 Log Analytics 工作区。
所需的权限
例如,您必须具有 Microsoft.OperationalInsights/workspaces/query/*/read 权限才能访问您查询的 Log Analytics 工作区,该权限由 Log Analytics 读者内置角色 提供。
在 Log Analytics 中创建 M 查询
像往常一样,在 Log analytics 中创建和运行查询。 如果在用户界面中达到记录数限制,请不要担心。 建议使用相对日期(如
ago函数或 UI 时间选取器)以便 Excel 刷新正确的数据集。导出查询 - 对查询及其结果感到满意后,使用 Log Analytics 的“导出”菜单下的“导出到 Power BI (M 查询)”菜单选项,将查询导出到 M:
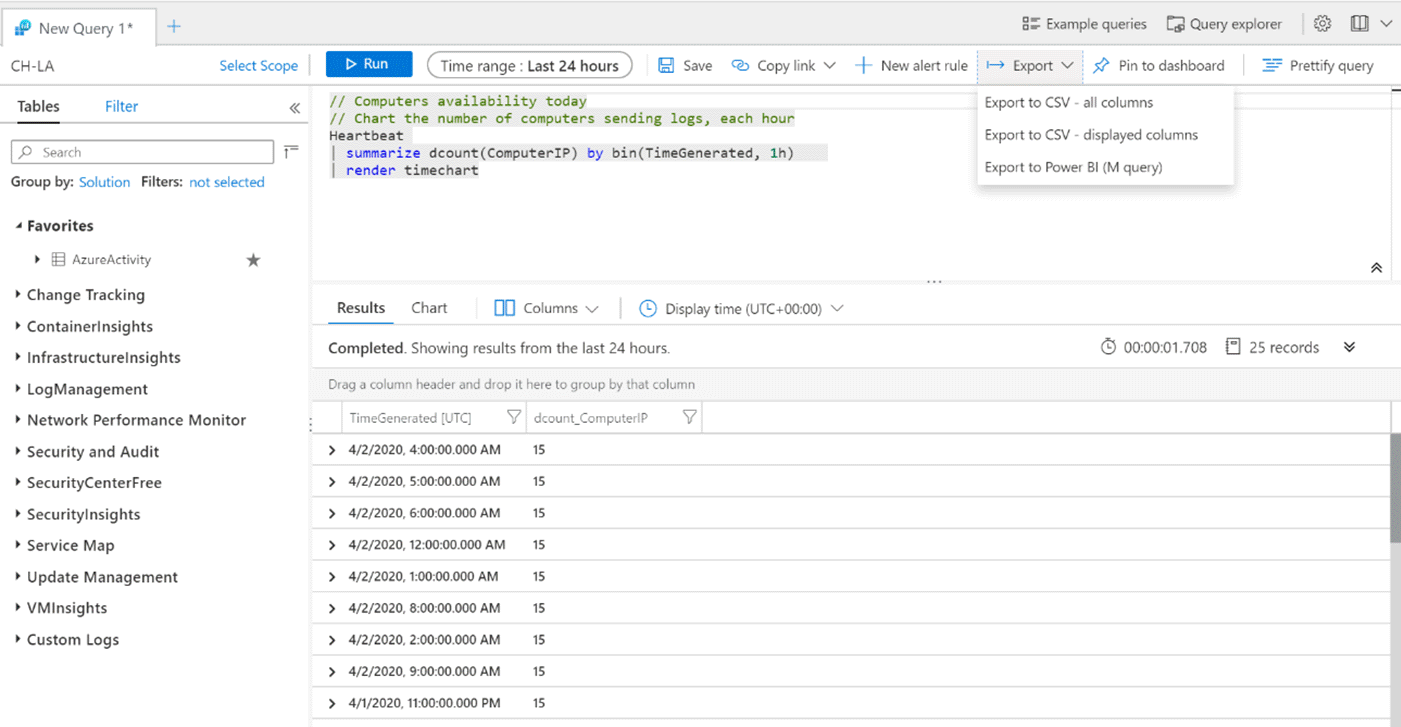
如果选择此选项,则会下载一个 .txt 文件,其中包含可在 Excel 中使用的 M 代码。
上面所示的查询将导出以下 M 代码。 下面是在本示例中为查询导出的 M 代码的示例:
/*
The exported Power Query Formula Language (M Language ) can be used with Power Query in Excel
and Power BI Desktop.
For Power BI Desktop follow the instructions below:
1) Download Power BI Desktop from https://powerbi.microsoft.com/desktop/
2) In Power BI Desktop select: 'Get Data' -> 'Blank Query'->'Advanced Query Editor'
3) Paste the M Language script into the Advanced Query Editor and select 'Done'
*/

let AnalyticsQuery =
let Source = Json.Document(Web.Contents("https://api.loganalytics.io/v1/workspaces/ddcfc599-cae0-48ee-9026-fffffffffffff/query",
[Query=[#"query"="

Heartbeat
| summarize dcount(ComputerIP) by bin(TimeGenerated, 1h)
| render timechart
",#"x-ms-app"="OmsAnalyticsPBI",#"timespan"="P1D",#"prefer"="ai.response-thinning=true"],Timeout=#duration(0,0,4,0)])),
TypeMap = #table(
{ "AnalyticsTypes", "Type" },
{
{ "string",   Text.Type },
{ "int",      Int32.Type },
{ "long",     Int64.Type },
{ "real",     Double.Type },
{ "timespan", Duration.Type },
{ "datetime", DateTimeZone.Type },
{ "bool",     Logical.Type },
{ "guid",     Text.Type },
{ "dynamic",  Text.Type }
}),
DataTable = Source[tables]{0},
Columns = Table.FromRecords(DataTable[columns]),
ColumnsWithType = Table.Join(Columns, {"type"}, TypeMap , {"AnalyticsTypes"}),
Rows = Table.FromRows(DataTable[rows], Columns[name]),
Table = Table.TransformColumnTypes(Rows, Table.ToList(ColumnsWithType, (c) => { c{0}, c{3}}))
in
Table
in AnalyticsQuery
将查询连接到 Excel
若要导入查询,请执行以下操作:
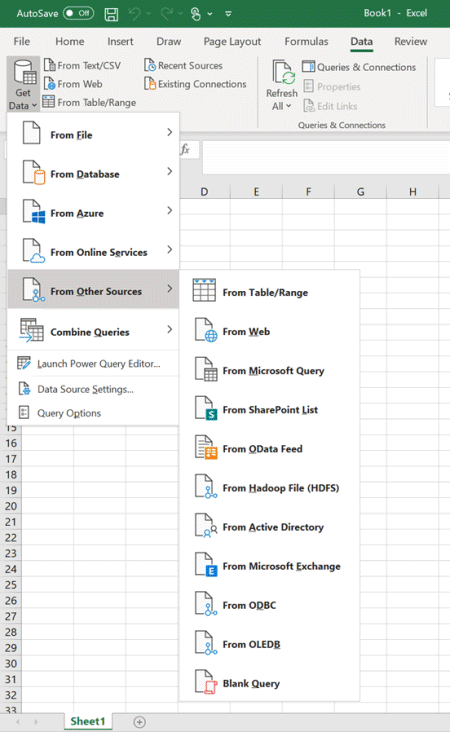
打开 Microsoft Excel。
在功能区中,转到“数据”菜单。 选择“获取数据”。 在“从其他源”中,选择“空查询”:
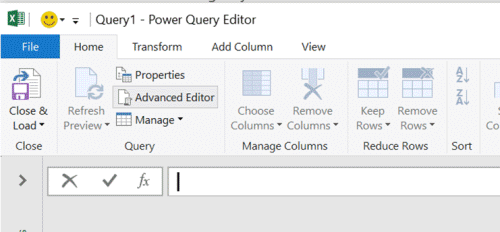
在 Power Query 窗口中,选择“高级编辑器”:
将高级编辑器中的文本替换为从 Log Analytics 导出的查询:
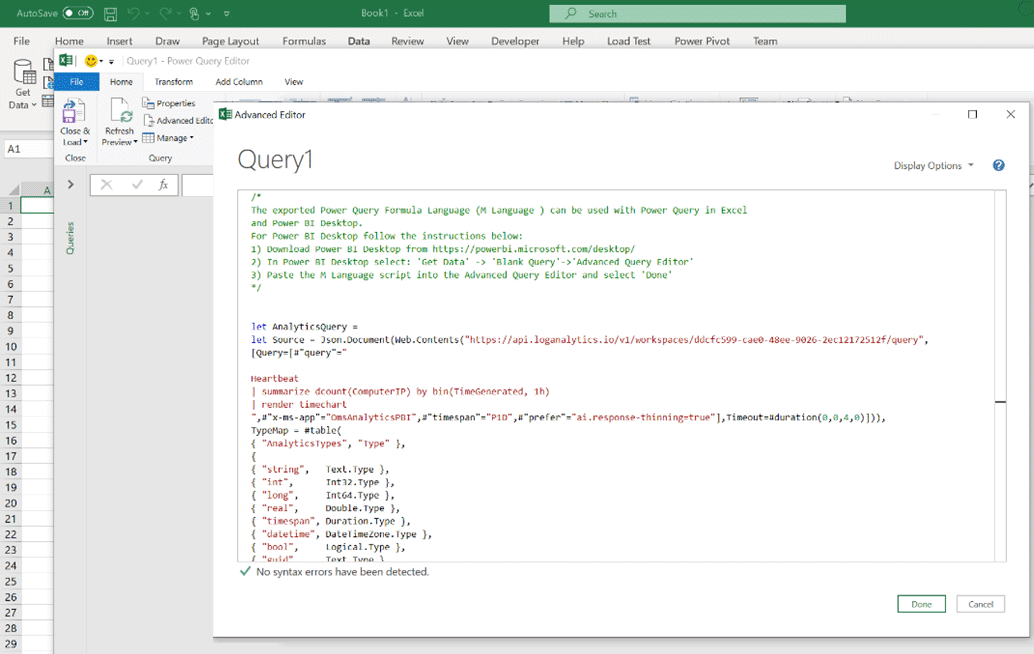
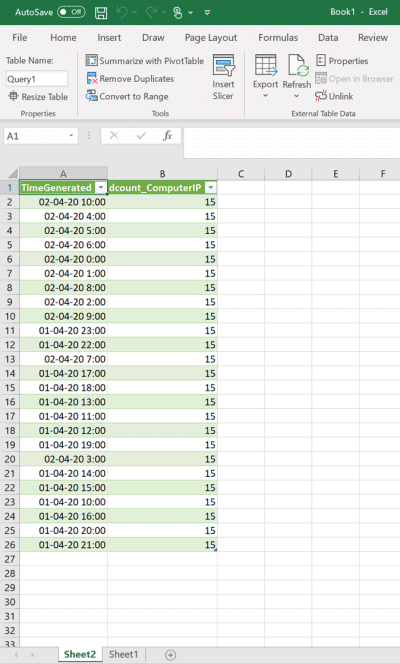
选择“完成”,然后选择“加载并关闭”。 Excel 将使用 Log Analytics API 执行查询,并且随后会显示结果集。
注释
如果记录数小于预期值,则结果的量可能超出了 61MiB 限制。 请尝试在查询中使用 project 或 project-away 将列限制为所需的列。
刷新数据
可以直接从 Excel 中刷新数据。 在 Excel 功能区中的“数据”菜单组中,选择“刷新”按钮。
后续步骤
有关 Excel 与外部数据源的集成的详细信息,请参阅 从外部数据源导入数据(Power Query)