适用于:✅Azure 数据资源管理器
函数 series_uv_change_points_fl() 是一个用户定义的函数 (UDF),它通过调用单变量异常情况检测 API(Azure 认知服务的一部分)来查找时序中的变化点。 此函数接受一组有限的时序(作为数值动态数组)、变化点检测阈值,以及稳定趋势窗口的最小大小。 每个时序都会转换为所需的 JSON 格式,然后发布到异常检测器服务终结点。 服务响应包含的动态数组中有变化点、其各自的置信度以及检测到的周期性。
注意
请考虑使用原生函数 series_decompose_anomalies(),其可伸缩性更强且运行速度更快。
先决条件
- Azure 订阅。 创建 Azure 帐户。
- 群集和数据库创建群集和数据库或具有编辑权限和数据的 KQL 数据库。
- 必须在群集上启用 Python 插件。 这是函数中使用的内联 Python 所必需的。
- 创建异常检测器资源并获取其密钥以访问服务。
- 在群集上启用 http_request 插件/http_request_post 插件以访问异常情况检测服务终结点。
- 修改类型
webapi的标注策略以访问异常情况检测服务终结点。
语法
T | invoke series_uv_change_points_fl(y_series [, score_threshold [, trend_window [, tsid]]])
详细了解语法约定。
参数
| 客户 | 类型 | 必需 | 说明 |
|---|---|---|---|
| y_series | string |
✔️ | 输入表列的名称,其中包含要进行异常情况检测的序列的值。 |
| score_threshold | real |
一个值,指定声明变化点的最小置信度。 置信度高于阈值的每个点都定义为变化点。 默认值:0.9 | |
| trend_window | integer | 一个值,指定用于对趋势变化进行可靠计算的最小窗口大小。 默认值:5 | |
| tsid | string |
输入表列的名称,其中包含时序 ID。 分析单个时序时可以省略。 |
函数定义
可以通过将函数的代码嵌入为查询定义的函数,或将其创建为数据库中的存储函数来定义函数,如下所示:
使用以下 let 语句定义函数。 不需要任何权限。 在以下函数定义中,请将标头的 uri 中的 YOUR-AD-RESOURCE-NAME 和 Ocp-Apim-Subscription-Key 中的 YOUR-KEY 替换为异常检测器资源名称和密钥。
let series_uv_change_points_fl=(tbl:(*), y_series:string, score_threshold:real=0.9, trend_window:int=5, tsid:string='_tsid')
{
    let uri = 'https://YOUR-AD-RESOURCE-NAME.cognitiveservices.azure.com/anomalydetector/v1.0/timeseries/changepoint/detect';
    let headers=dynamic({'Ocp-Apim-Subscription-Key': h'YOUR-KEY'});
    let kwargs = bag_pack('y_series', y_series, 'score_threshold', score_threshold, 'trend_window', trend_window);
    let code = ```if 1:
        import json
        y_series = kargs["y_series"]
        score_threshold = kargs["score_threshold"]
        trend_window = kargs["trend_window"]
        json_str = []
        for i in range(len(df)):
            row = df.iloc[i, :]
            ts = [{'value':row[y_series][j]} for j in range(len(row[y_series]))]
            json_data = {'series': ts, "threshold":score_threshold, "stableTrendWindow": trend_window}     # auto-detect period, or we can force 'period': 84
            json_str = json_str + [json.dumps(json_data)]
        result = df
        result['json_str'] = json_str
    ```;
    tbl
    | evaluate python(typeof(*, json_str:string), code, kwargs)
    | extend _tsid = column_ifexists(tsid, 1)
    | partition by _tsid (
       project json_str
       | evaluate http_request_post(uri, headers, dynamic(null))
        | project period=ResponseBody.period, change_point=series_add(0, ResponseBody.isChangePoint), confidence=ResponseBody.confidenceScores
        | extend _tsid=toscalar(_tsid)
       )
};
// Write your query to use the function here.
示例
以下示例使用 invoke 运算符运行函数。
若要使用查询定义的函数,请在嵌入的函数定义后调用它。
let series_uv_change_points_fl=(tbl:(*), y_series:string, score_threshold:real=0.9, trend_window:int=5, tsid:string='_tsid')
{
    let uri = 'https://YOUR-AD-RESOURCE-NAME.cognitiveservices.azure.com/anomalydetector/v1.0/timeseries/changepoint/detect';
    let headers=dynamic({'Ocp-Apim-Subscription-Key': h'YOUR-KEY'});
    let kwargs = bag_pack('y_series', y_series, 'score_threshold', score_threshold, 'trend_window', trend_window);
    let code = ```if 1:
        import json
        y_series = kargs["y_series"]
        score_threshold = kargs["score_threshold"]
        trend_window = kargs["trend_window"]
        json_str = []
        for i in range(len(df)):
            row = df.iloc[i, :]
            ts = [{'value':row[y_series][j]} for j in range(len(row[y_series]))]
            json_data = {'series': ts, "threshold":score_threshold, "stableTrendWindow": trend_window}     # auto-detect period, or we can force 'period': 84
            json_str = json_str + [json.dumps(json_data)]
        result = df
        result['json_str'] = json_str
    ```;
    tbl
    | evaluate python(typeof(*, json_str:string), code, kwargs)
    | extend _tsid = column_ifexists(tsid, 1)
    | partition by _tsid (
       project json_str
       | evaluate http_request_post(uri, headers, dynamic(null))
        | project period=ResponseBody.period, change_point=series_add(0, ResponseBody.isChangePoint), confidence=ResponseBody.confidenceScores
        | extend _tsid=toscalar(_tsid)
       )
};
let ts = range x from 1 to 300 step 1
| extend y=iff(x between (100 .. 110) or x between (200 .. 220), 20, 5)
| extend ts=datetime(2021-01-01)+x*1d
| extend y=y+4*rand()
| summarize ts=make_list(ts), y=make_list(y)
| extend sid=1;
ts
| invoke series_uv_change_points_fl('y', 0.8, 10, 'sid')
| join ts on $left._tsid == $right.sid
| project-away _tsid
| project-reorder y, *      //  just to visualize the anomalies on top of y series
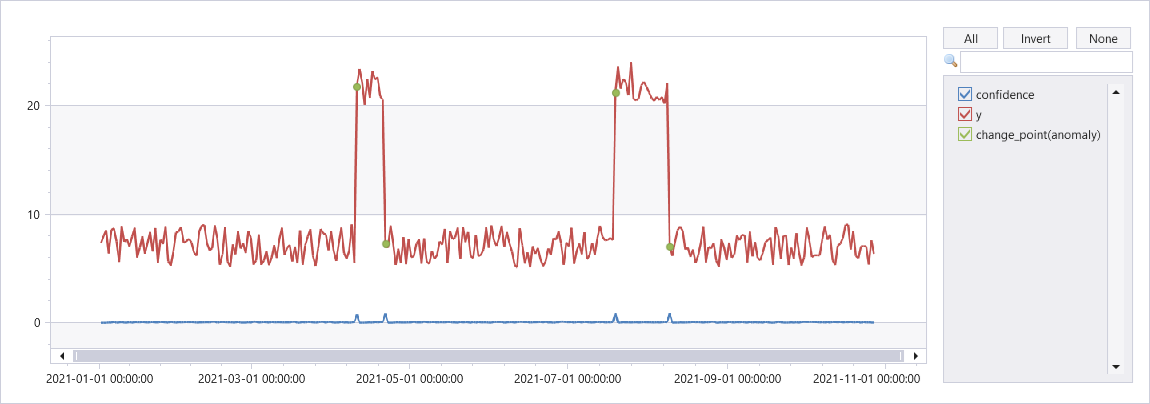
| render anomalychart with(xcolumn=ts, ycolumns=y, confidence, anomalycolumns=change_point)
输出
下图显示了时序上的变化点。
