每个管道都会发布事件,捕捉审计日志、数据质量检查、进度和数据血缘。 你可以从两个来源查询这些事件:
pipeline_events系统表包含区域内工作区所有管道的事件,是查询事件的推荐方式。 它还处于测试阶段。每个流水线 事件日志 是一个包含单个流水线事件的三角表。
你用标准SQL查询事件。 为了帮助你入门,本页还提供了系统表的示例仪表盘和常见查询。
Requirements
要访问该系统表,用户必须以下之一:
既是元存储管理员,也是帐户管理员,或者
对系统架构具有
USE和SELECT权限。 请参阅 授予对系统表的访问权限。
示例仪表板
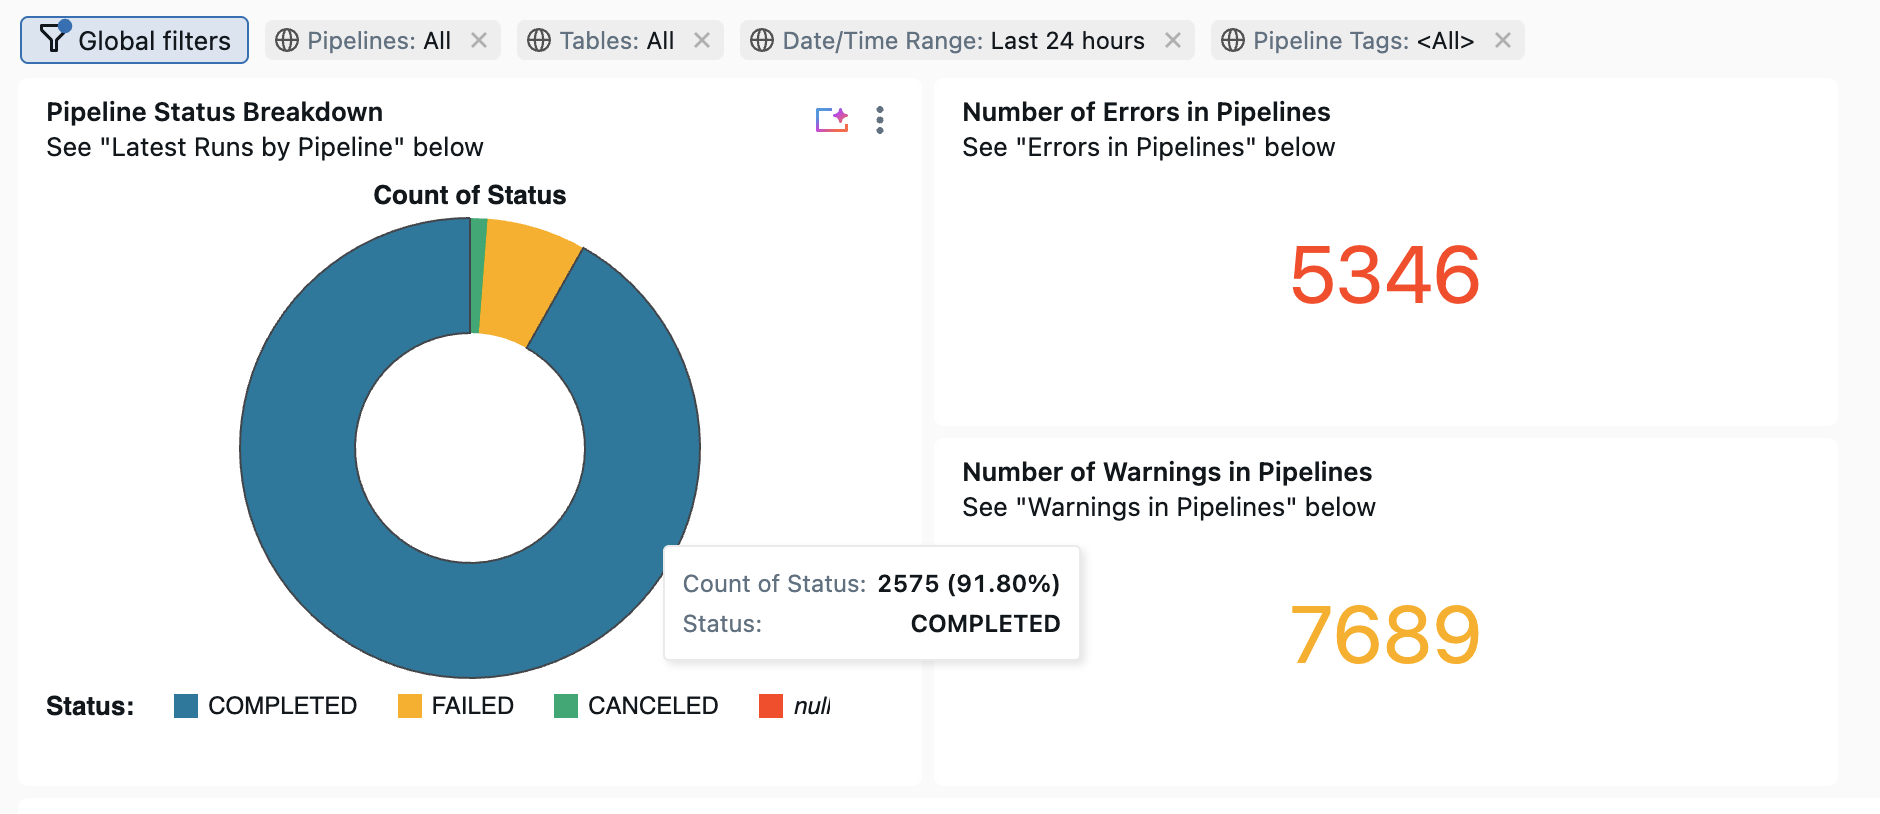
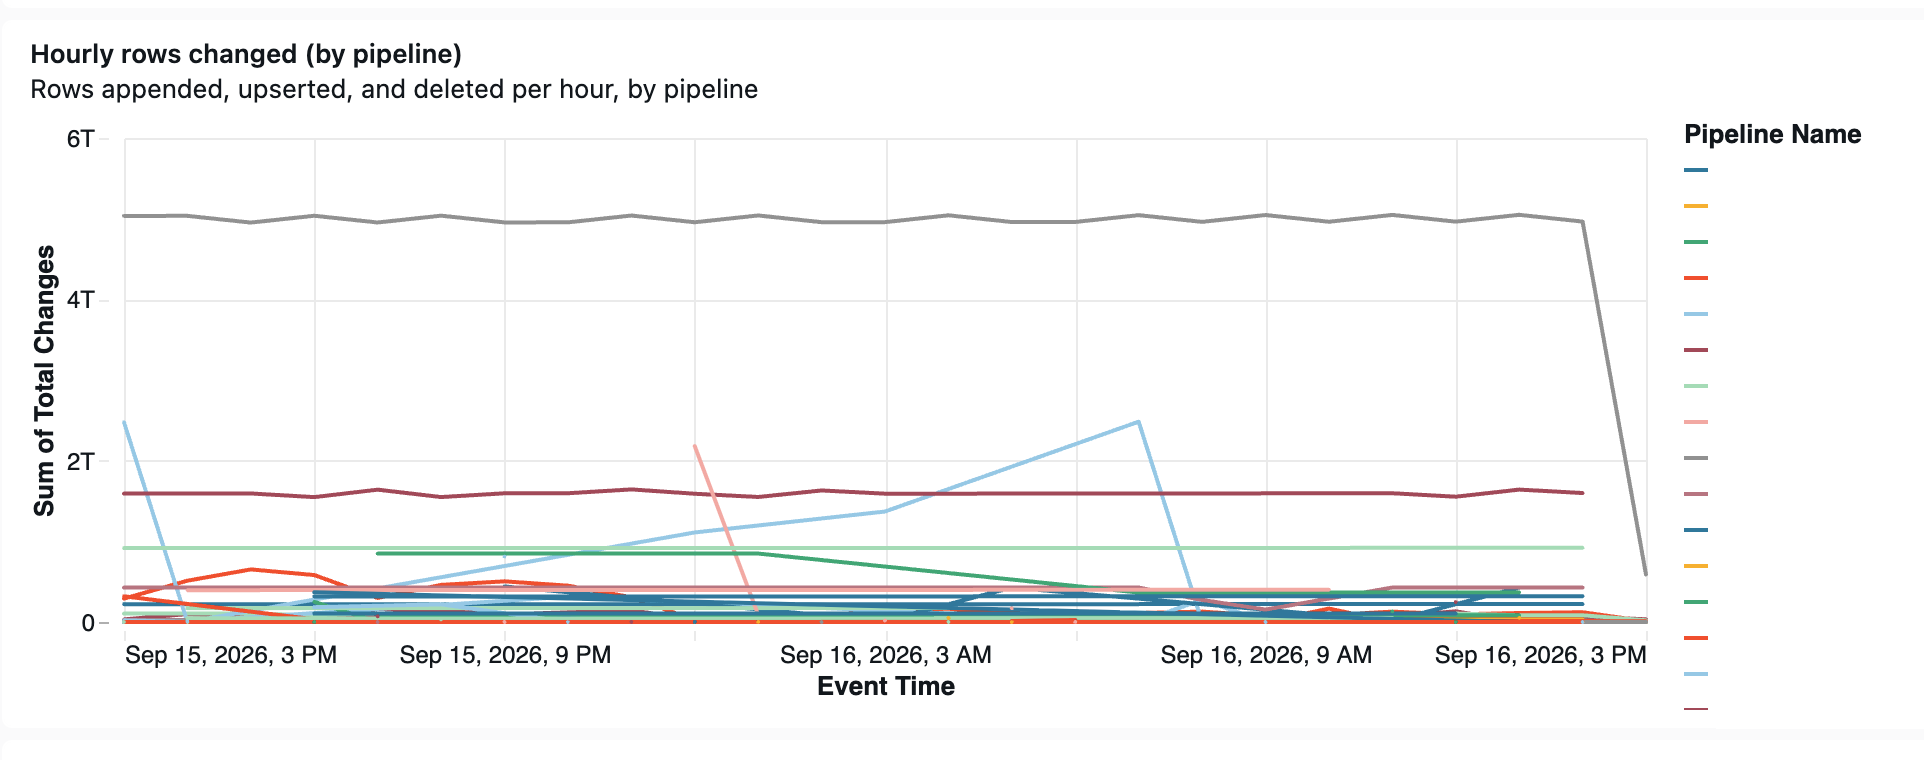
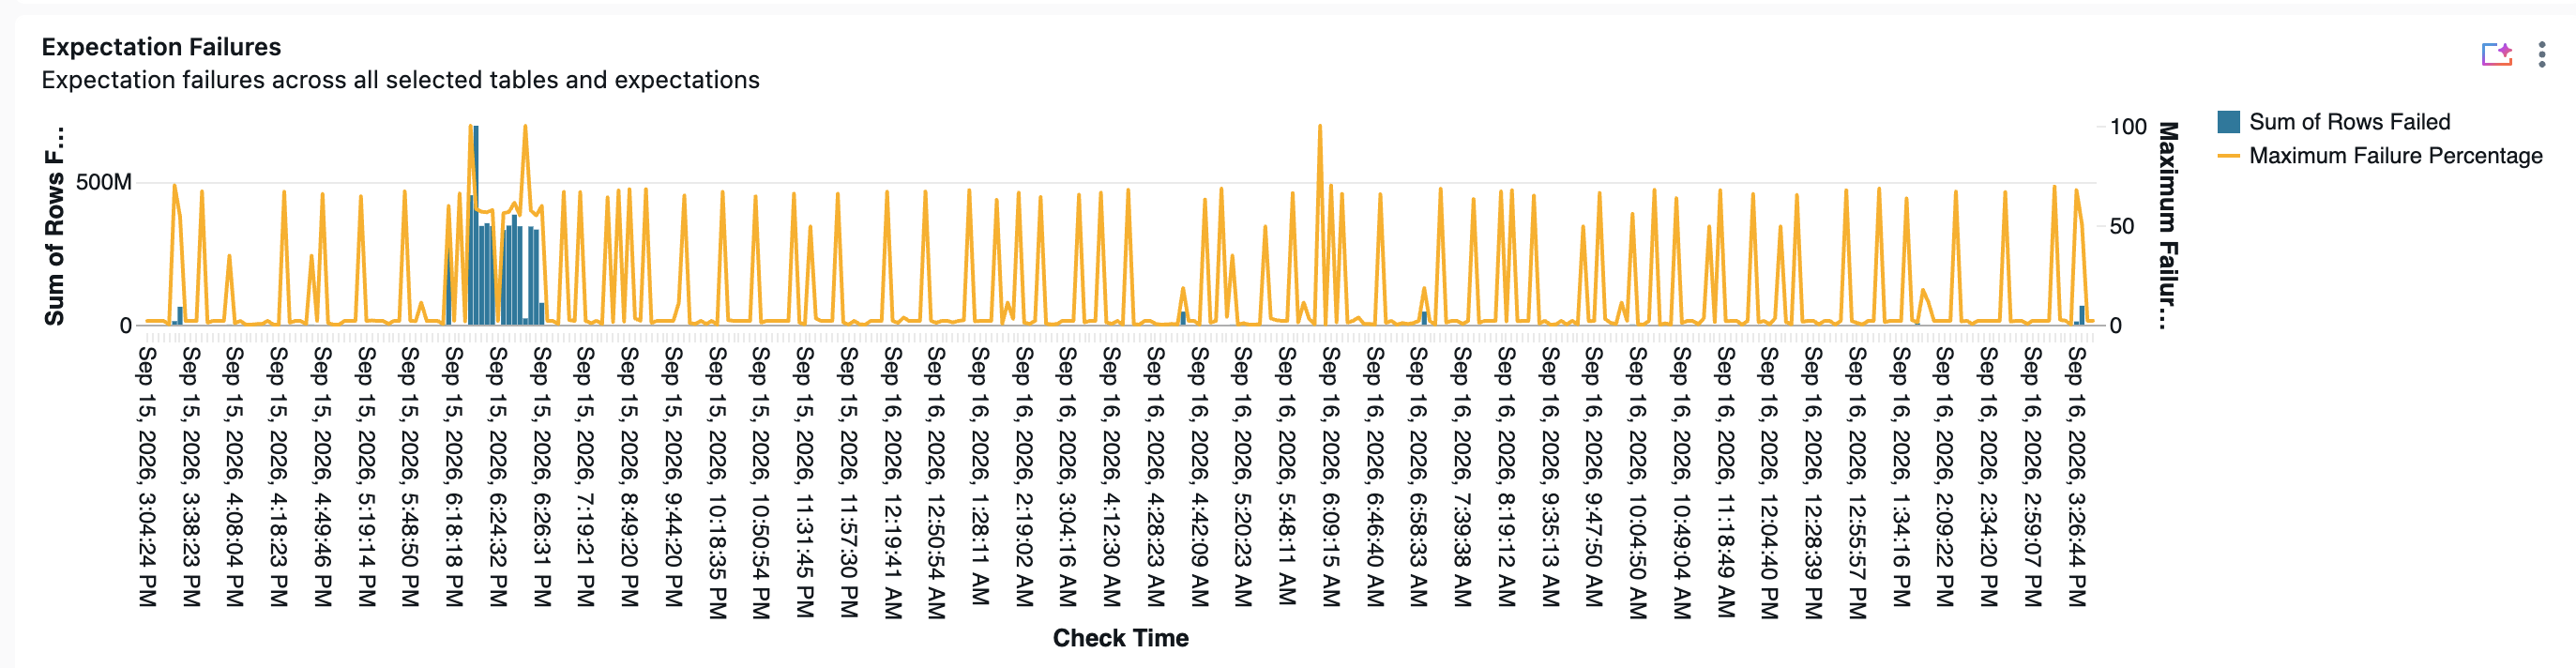
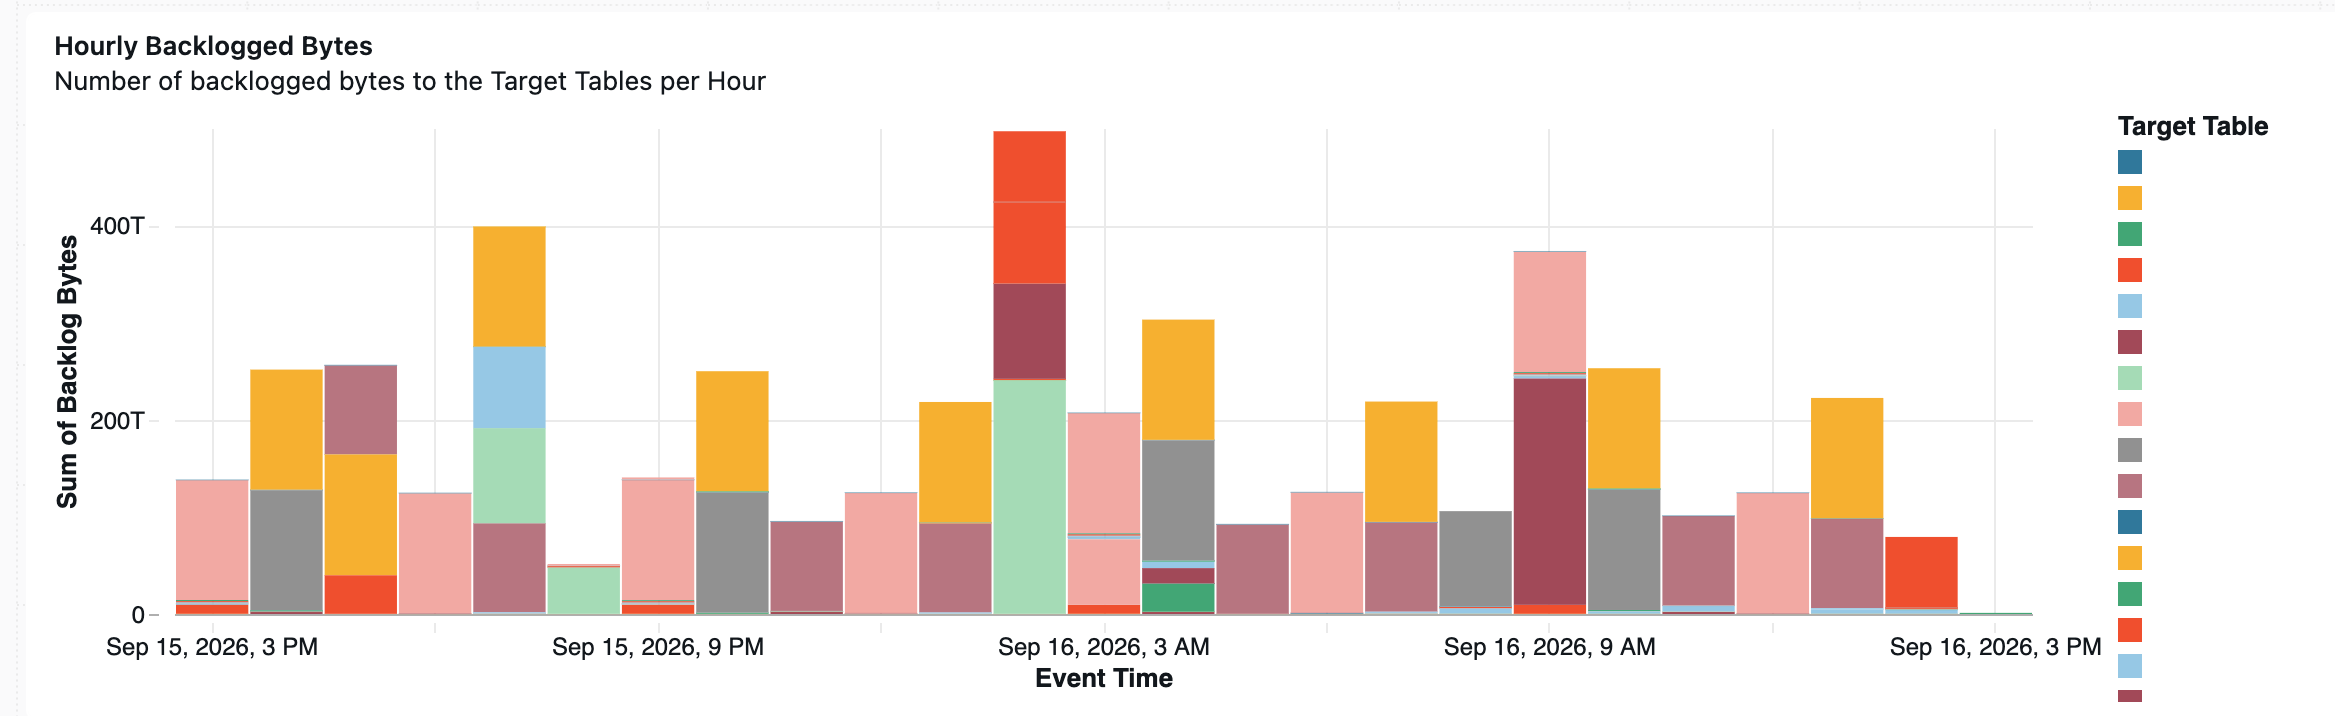
该示例仪表盘读取 pipeline_events 系统表,以跟踪区域内每个管道的更新、流量吞吐量、积压、数据质量和错误情况。 按流水线、表格、标签和时间范围过滤每页。
导入仪表板
下载 仪表盘的JSON文件。
将仪表板导入工作区。 有关说明,请参见 导入仪表盘文件。
监控查询
仪表盘中的以下查询展示了常见的管道监控用例。
每个管道的最新误差
此查询返回过去7天内出错的每条管道的最新错误,最外层例外。
SELECT
  workspace_id,
  pipeline_id,
  event_time,
  message,
  error.exceptions[0].error_class AS exception_error_class,
  error.exceptions[0].sql_state   AS exception_sql_state
FROM
  system.lakeflow_pipeline_events_preview.pipeline_events
WHERE
  level = 'ERROR'
  AND event_time >= current_timestamp() - INTERVAL 7 DAYS
QUALIFY
  ROW_NUMBER() OVER (PARTITION BY workspace_id, pipeline_id ORDER BY event_time DESC) = 1
ORDER BY
  event_time DESC
每小时错误率
这个查询会每小时统计每条管道的错误,这样你就能发现峰值。
SELECT
  pipeline_id,
  date_trunc('HOUR', event_time) AS hour,
  count(*) AS num_errors
FROM
  system.lakeflow_pipeline_events_preview.pipeline_events
WHERE
  level = 'ERROR'
  AND event_time >= current_timestamp() - INTERVAL 7 DAYS
GROUP BY
  pipeline_id,
  date_trunc('HOUR', event_time)
ORDER BY
  hour DESC
每次流程的行数变化
此查询按小时汇总流追加、更新插入和删除的行数。 每个指标都是以每个微批次为单位的计数,因此在该窗口内求和即可得到吞吐量。
SELECT
  origin.flow_name,
  date_trunc('HOUR', event_time) AS hour,
  SUM(
    ifnull(variant_get(details, '$.flow_progress.metrics.num_output_rows', 'BIGINT'), 0)
    + ifnull(variant_get(details, '$.flow_progress.metrics.num_upserted_rows', 'BIGINT'), 0)
    + ifnull(variant_get(details, '$.flow_progress.metrics.num_deleted_rows', 'BIGINT'), 0)
  ) AS rows_changed
FROM
  system.lakeflow_pipeline_events_preview.pipeline_events
WHERE
  event_type = 'flow_progress'
  AND event_time >= current_timestamp() - INTERVAL 7 DAYS
GROUP BY
  origin.flow_name,
  date_trunc('HOUR', event_time)
ORDER BY
  hour DESC,
  rows_changed DESC
按流程划分的积压项
该查询返回每个流的最新积压读数。 一个 COMPLETED 流被追赶,因此其积压记录为 0。
WITH latest_flow_progress AS (
  SELECT
    workspace_id,
    pipeline_id,
    origin.flow_name,
    event_time,
    CASE
      WHEN variant_get(details, '$.flow_progress.status', 'STRING') = 'COMPLETED' THEN 0
      ELSE variant_get(details, '$.flow_progress.metrics.backlog_bytes', 'BIGINT')
    END AS backlog_bytes
  FROM
    system.lakeflow_pipeline_events_preview.pipeline_events
  WHERE
    event_type = 'flow_progress'
    AND event_time >= current_timestamp() - INTERVAL 1 HOUR
    AND (
      variant_get(details, '$.flow_progress.metrics.backlog_bytes', 'BIGINT') IS NOT NULL
      OR variant_get(details, '$.flow_progress.status', 'STRING') = 'COMPLETED'
    )
  QUALIFY
    ROW_NUMBER() OVER (PARTITION BY workspace_id, pipeline_id, origin.flow_name ORDER BY event_time DESC) = 1
)
SELECT *
FROM latest_flow_progress
WHERE backlog_bytes > 0
ORDER BY backlog_bytes DESC
按数据集划分的未达预期项
该查询返回的是每个数据集、每次更新在最后一天内失败的记录预期。 它会基于预期 dataset值来触发,即使 origin.dataset_name 事件本身没有预期值,预期值也会被填充。
SELECT
  pipeline_id,
  update_id,
  coalesce(expectation.dataset, origin.dataset_name) AS dataset_name,
  expectation.name AS expectation_name,
  SUM(expectation.failed_records) AS failed_records
FROM
  system.lakeflow_pipeline_events_preview.pipeline_events
  LATERAL VIEW explode(variant_get(details, '$.flow_progress.data_quality.expectations', 'ARRAY<STRUCT<name:STRING,dataset:STRING,passed_records:BIGINT,failed_records:BIGINT>>')) AS expectation
WHERE
  event_type = 'flow_progress'
  AND event_time >= current_timestamp() - INTERVAL 1 DAY
GROUP BY
  pipeline_id,
  update_id,
  coalesce(expectation.dataset, origin.dataset_name),
  expectation.name
HAVING
  SUM(expectation.failed_records) > 0
ORDER BY
  failed_records DESC