本文介绍:
- 可以为此服务收集的监视数据的类型。
- 分析这些数据的方法。
如果具有依赖于 Azure 资源的关键应用程序和业务流程,则需要监视并获取系统的警报。 Azure Monitor 服务会从系统的每个组件收集并聚合指标和日志。 Azure Monitor 提供可用性、性能和复原能力视图,并在出现问题时向你发送通知。 可以使用 Azure 门户、PowerShell、Azure CLI、REST API 或客户端库来设置和查看监视数据。
- 有关 Azure Monitor 的详细信息,请参阅 Azure Monitor 概述。
- 有关监视 Azure 资源的常规方法的详细信息,请参阅使用 Azure Monitor 监视 Azure 资源。
使用事件网格监视每个设备的连接断开问题
Azure Monitor 提供了一个名为 “连接的设备 ”的指标,可用于监视连接到 IoT 中心的设备数。 当连接的设备数降到阈值以下时,此指标会触发警报。 Azure Monitor 还会发出连接类别中的事件,你可以使用这些事件来监视设备连接、断开连接和连接错误。 尽管在某些情况下,仅使用这些事件就足以达到目的,但 Azure 事件网格还提供了一个低延迟、每设备监视解决方案,可用于跟踪关键设备和基础结构的设备连接。
借助事件网格,可以订阅 IoT 中心 DeviceConnected 和 DeviceDisconnected 事件,以触发警报和监视设备连接状态 。 事件网格提供的事件延迟比 Azure Monitor 低,因此可以按设备而不是针对所有连接的设备进行监视。 这些因素使事件网格成为监视关键设备和基础结构的连接的首选方法。 强烈建议在生产环境中使用事件网格监视设备连接。
有关使用事件网格和 Azure Monitor 监视设备连接的详细信息,请参阅 监视、诊断和排查 Azure IoT 中心设备连接问题。
资源类型
Azure 使用资源类型和 ID 的概念来标识订阅中的所有内容。 同样的,Azure Monitor 根据资源类型(也称为“命名空间”)将核心监视数据组织为指标和日志。 不同的指标和日志可用于不同的资源类型。 服务可能与多种资源类型关联。
资源类型也是 Azure 中运行的每个资源的资源 ID 的一部分。 例如,虚拟机的一种资源类型是 Microsoft.Compute/virtualMachines。 有关服务及其关联资源类型的列表,请参阅资源提供程序。
有关 IoT 中心的资源类型的详细信息,请参阅 Azure IoT 中心监视数据参考。
数据存储
对于 Azure Monitor:
- 指标数据存储在 Azure Monitor 指标数据库中。
- 日志数据存储在 Azure Monitor 日志存储中。 Log Analytics 是 Azure 门户中可以查询此存储的工具。
- Azure 活动日志是一个单独的存储区,在 Azure 门户中有自己的接口。
可以选择将指标和活动日志数据路由到 Azure Monitor 日志存储。 然后,可以使用 Log Analytics 查询数据并将其与其他日志数据关联。
许多服务可以使用诊断设置将指标和日志数据发送到 Azure Monitor 外部的其他存储位置。 示例包括 Azure 存储,以及使用事件中心的非 Azure 合作伙伴系统。
有关 Azure Monitor 如何存储数据的详细信息,请参阅 Azure Monitor 数据平台。
收集和路由监视数据
平台指标、活动日志和资源日志都有独特的收集、存储和路由规范。
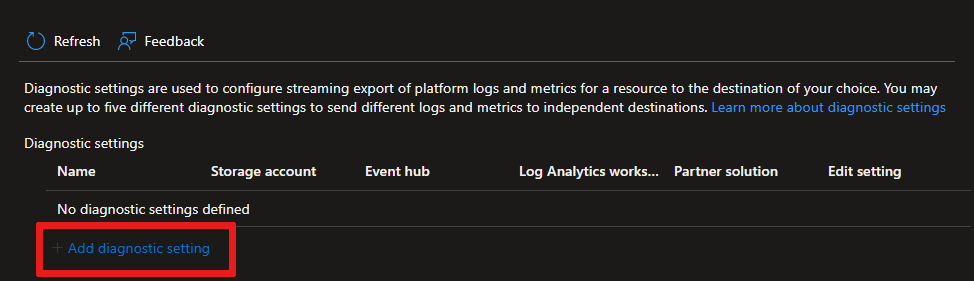
在 Azure 门户的 IoT 中心的“监视”下选择“诊断设置”,然后选择“添加诊断设置”,以便创建作用域为 IoT 中心发出的日志和平台指标的诊断设置。
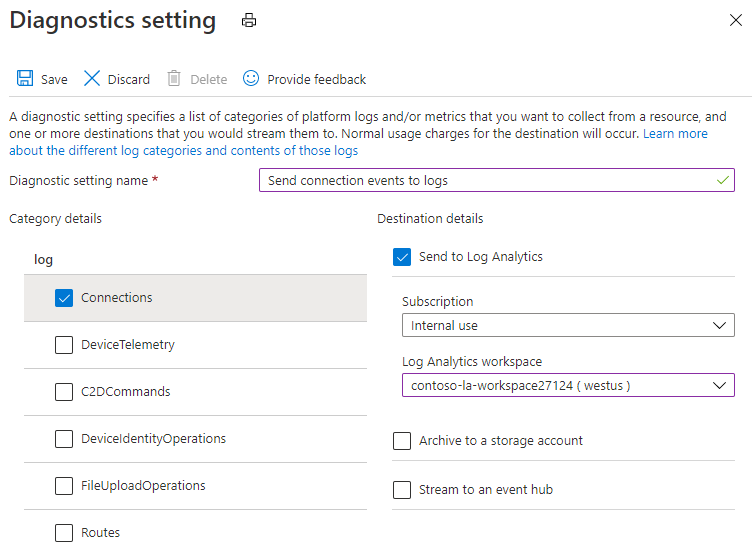
以下屏幕截图显示了用于将资源日志类型“连接操作”和所有平台指标路由到 Log Analytics 工作区的诊断设置。

将 IoT 中心平台指标路由到其他位置时:
无法使用诊断设置导出以下平台指标:“连接的设备数”和“设备总数”。
多维指标(例如,某些路由指标)当前导出为跨维度值聚合的平展单维指标。 有关更多详细信息,请参阅将平台指标导出到其他位置。
分析指标
Azure Monitor 平台指标
Azure Monitor 为大多数服务提供平台指标。 这些指标是:
- 针对每个命名空间单独定义。
- 存储在 Azure Monitor 时序指标数据库中。
- 是轻型数据,并且能够支持准实时警报。
- 用于跟踪资源随时间推移的性能变化。
集合:Azure Monitor 会自动收集平台指标。 不需要任何配置。
路由:通常还可将平台指标路由到 Azure Monitor 日志/Log Analytics,从而可以使用其他日志数据对其进行查询。 有关详细信息,请参阅指标诊断设置。 有关如何为服务配置诊断设置,请参阅在 Azure Monitor 中创建诊断设置。
有关可以为 Azure Monitor 中的所有资源收集的所有指标的列表,请参阅 Azure Monitor 中支持的指标。
Monitor 概述
每个 IoT 中心的 Azure 门户中的“概述”页面都包括提供某些使用指标的图表,例如使用的消息数以及连接到 IoT 中心的设备数。
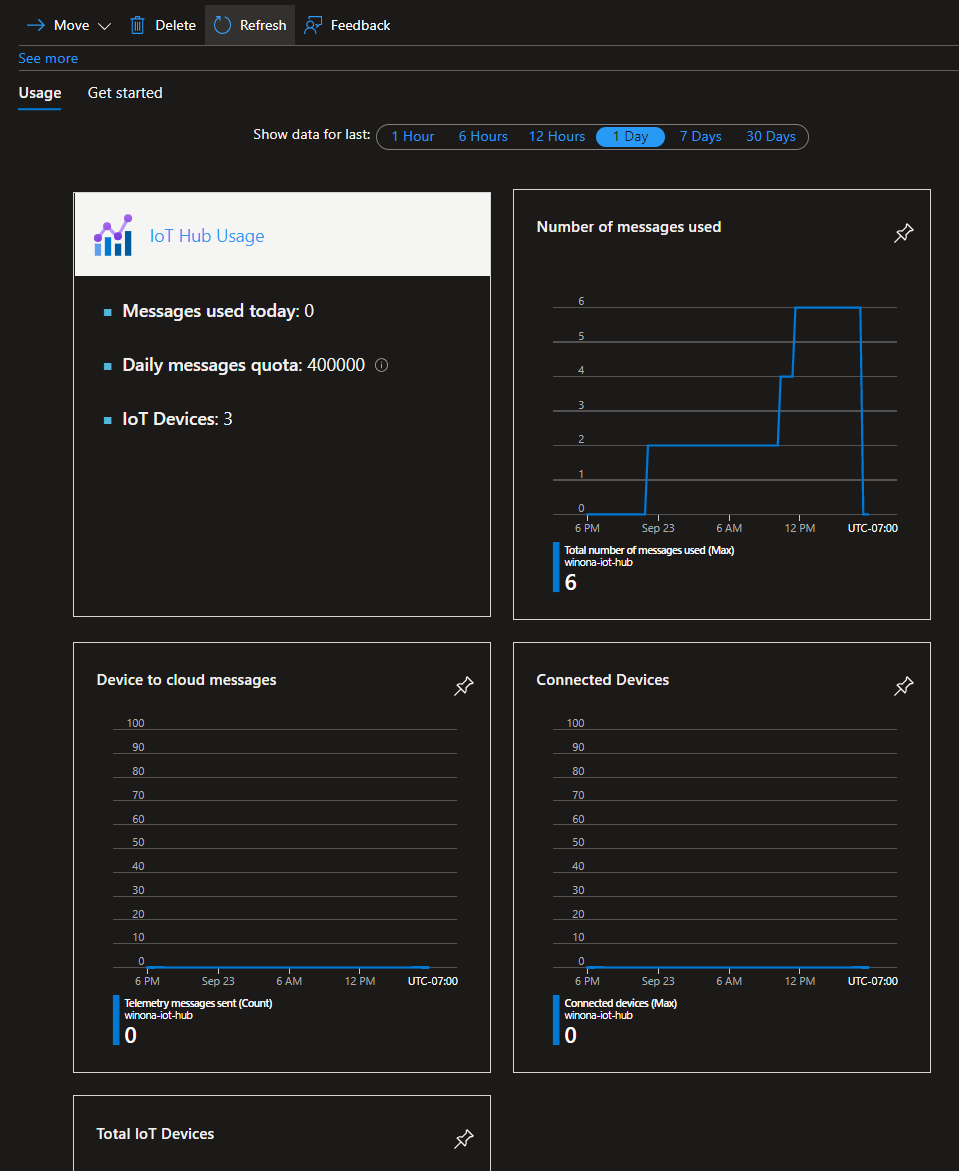
正确的消息计数值可能会延迟 1 分钟显示。 由于 IoT 中心服务基础结构的原因,在刷新时,该值有时会在较高值与较低值之间弹跳。 此计数器只有上一分钟应计的值会不正确。
“概述”窗格中提供的信息很有用,但只代表提供给 IoT 中心的少量监视数据。 某些监视数据会在你创建 IoT 中心后立即自动收集,并可供用于分析。 你可以使用某些配置启用其他数据收集类型。
重要
IoT 中心服务使用 Azure Monitor 资源日志发出的事件不保证可靠或有序。 某些事件可能会丢失或未按顺序传送。 资源日志不是实时的,因此可能需要几分钟时间才能将事件记录到你选择的目标。
Azure Monitor 资源日志
借助资源日志,可以深入了解 Azure 资源已执行的操作。 日志是自动生成的,但必须将日志路由到 Azure Monitor 日志以保存或查询它们。 日志按类别进行组织。 给定的命名空间可能具有多个资源日志类别。
收集:在创建诊断设置并将日志路由到一个或多个位置之前,不会收集和存储资源日志。 创建诊断设置时,请指定要收集的日志类别。 可以通过多种方式创建和维护诊断设置,包括 Azure 门户、编程方式以及通过 Azure Policy。
路由:建议的默认设置是将资源日志路由到 Azure Monitor 日志,以便可以使用其他日志数据查询它们。 也可使用其他位置(例如 Azure 存储、Azure 事件中心和某些 Microsoft 监视合作伙伴)。 有关详细信息,请参阅 Azure 资源日志和资源日志目标。
有关收集、存储和路由资源日志的详细信息,请参阅 Azure Monitor 中的诊断设置。
有关 Azure Monitor 中所有可用资源日志类别的列表,请参阅 Azure Monitor 中支持的资源日志。
Azure Monitor 中的所有资源日志都具有相同的标头字段,后跟特定于服务的字段。 Azure Monitor 资源日志架构概述了常见架构。
将连接事件路由到日志
IoT 中心持续发出多类操作的资源日志。 不过,若要收集此日志数据,需要创建一个诊断设置,以将日志路由到可对其进行分析或存档的目标。 其中一个目标是通过 Log Analytics 工作区的 Azure Monitor 日志(请参阅定价),可在其中使用 Kusto 查询来分析数据。
IoT 中心资源日志连接类别发出与设备连接有关的操作和错误。 以下屏幕截图显示了将这些日志路由到 Log Analytics 工作区的诊断设置:
注意
建议在创建 IoT 中心后尽早创建诊断设置,因为尽管 IoT 中心始终会发出资源日志,但在将日志路由到目标之前,Azure Monitor 不会收集这些日志。
若要详细了解如何将日志路由到目标,请参阅收集和路由监视数据部分。 有关创建诊断设置的详细说明,请参阅 教程:设置和使用 IoT 中心的指标和日志。
Azure 活动日志
活动日志包含订阅级事件,这些事件跟踪从资源外部看到的每个 Azure 资源的操作;例如,创建新资源或启动虚拟机。
收集:活动日志事件会自动生成并收集在单独的存储中,以便在 Azure 门户中查看。
路由:可将活动日志数据发送到 Azure Monitor 日志,以便可以将它们与其他日志数据一起进行分析。 也可使用其他位置(例如 Azure 存储、Azure 事件中心和某些 Microsoft 监视合作伙伴)。 有关如何路由活动日志的详细信息,请参阅 Azure 活动日志概述。
分析日志
Azure Monitor 日志中的数据以表形式存储,每个表具有自己独有的属性集。 这些表中的数据与某个 Log Analytics 工作区相关联,并且可以在 Log Analytics 中进行查询。 若要详细了解 Azure Monitor 日志,请参阅 Azure Monitor 文档中的 Azure Monitor 日志概述。
若要将数据路由到 Azure Monitor 日志,你必须创建一个诊断设置,以便将资源日志或平台指标发送到 Log Analytics 工作区。 若要了解详细信息,请参阅收集和路由监视数据部分。
若要执行 Log Analytics,请转到 Azure 门户并打开你的 IoT 中心,然后选择“监视”下的“日志”。 默认情况下,这些 Log Analytics 查询的范围限定为在 Azure Monitor 日志中为 IoT 中心收集的日志和指标。

将 IoT 中心平台指标路由到 Azure Monitor 日志时:
无法使用诊断设置导出以下平台指标:“已连接设备数”和“设备总数”。
多维指标(例如,某些路由指标)当前导出为跨维度值聚合的平展单维指标。 有关更多详细信息,请参阅将平台指标导出到其他位置。
有关 IoT 中心的常见查询,请参阅 Kusto 查询。 有关使用 Log Analytics 查询的详细信息,请参阅 Azure Monitor 中的日志查询。
IoT 中心日志中的 SDK 版本
IoT 中心资源日志的一些操作在其 sdkVersion 对象中返回 properties 属性。 对于这些操作,当设备或后端应用使用 Azure IoT SDK 之一时,此属性包含有关所使用的 SDK、SDK 版本和运行 SDK 的平台的信息。
以下示例显示了使用以下工具为 sdkVersion 操作发出的 deviceConnect 属性:
- Node.js 设备 SDK:
"azure-iot-device/1.17.1 (node v10.16.0; Windows_NT 10.0.18363; x64)" - .NET (C#) SDK:
".NET/1.21.2 (.NET Framework 4.8.4200.0; Microsoft Windows 10.0.17763 WindowsProduct:0x00000004; X86)"。
下表显示了用于不同 Azure IoT SDK 的 SDK 名称:
| SdkVersion 属性中的 SDK 名称 | 语言 |
|---|---|
| .NET | .NET (C#) |
| microsoft.azure.devices | .NET (C#) 服务 SDK |
| microsoft.azure.devices.client | .NET (C#) 设备 SDK |
| iothubclient | C 或 Python v1(已弃用)设备 SDK |
| iothubserviceclient | C 或 Python v1(已弃用)服务 SDK |
| azure-iot-device-iothub-py | Python 设备 SDK |
| azure-iot-device | Node.js 设备 SDK |
| azure-iothub | Node.js 服务 SDK |
| com.microsoft.azure.iothub-java-client | Java 设备 SDK |
| com.microsoft.azure.iothub.service.sdk | Java 服务 SDK |
| com.microsoft.azure.sdk.iot.iot-device-client | Java 设备 SDK |
| com.microsoft.azure.sdk.iot.iot-service-client | Java 服务 SDK |
| C | 嵌入式 C |
| C + (OSSimplified = Eclipse ThreadX) | Eclipse ThreadX |
对 IoT 中心资源日志执行查询时,可以提取 SDK 版本属性。 例如,下面的查询从连接操作返回的属性中提取 SDK 版本属性(和设备 ID)。 这两个属性将与操作时间以及设备所连接到的 IoT 中心的资源 ID 一起写入到结果中。
// SDK version of devices
// List of devices and their SDK versions that connect to IoT Hub
AzureDiagnostics
| where ResourceProvider == "MICROSOFT.DEVICES" and ResourceType == "IOTHUBS"
| where Category == "Connections"
| extend parsed_json = parse_json(properties_s)
| extend SDKVersion = tostring(parsed_json.sdkVersion) , DeviceId = tostring(parsed_json.deviceId)
| distinct DeviceId, SDKVersion, TimeGenerated, _ResourceId
从 Azure 事件中心读取日志
通过诊断设置来设置事件日志记录后,可以创建应用程序以读出日志,从而可以根据日志中的信息采取措施。
有关使用事件中心客户端进行开发的具体指南,请参阅 Azure 事件中心文档。 例如 .NET 示例:读取事件。
有关可用的资源日志类别、其关联的 Log Analytics 表以及 IoT 中心的日志架构,请参阅 Azure IoT 中心监视数据参考。
分析监视数据
有许多工具可用于分析监视数据。
Azure Monitor 工具
Azure Monitor 支持以下基本工具:
指标资源管理器,它是 Azure 门户中的工具,可用于查看和分析 Azure 资源的指标。 有关详细信息,请参阅使用 Azure Monitor 指标资源管理器分析指标。
Log Analytics,它是 Azure 门户中的一种工具,支持使用 Kusto 查询语言 (KQL) 来查询和分析日志数据。 有关详细信息,请参阅 Azure Monitor 日志查询入门。
活动日志,它在 Azure 门户中具有用于执行查看和基本搜索的用户界面。 要进行更深入的分析,必须将数据路由到 Azure Monitor 日志,并在 Log Analytics 中运行更复杂的查询。
支持更复杂可视化效果的工具包括:
- 仪表板,它支持将不同类型的数据合并到 Azure 门户的单个窗格中。
- 工作簿,它们是可在 Azure 门户中创建的可自定义报表。 工作簿可以包括文本、指标和日志查询。
- Grafana,它是一个适用于操作仪表板的开放平台工具。 可以使用 Grafana 创建包含来自除 Azure Monitor 以外多个源的数据的仪表板。
- Power BI,它是一项业务分析服务,可提供跨各种数据源的交互式可视化效果。 可将 Power BI 配置为自动从 Azure Monitor 导入日志数据,以利用这些可视化效果。
Azure Monitor 导出工具
可以使用以下方法将数据从 Azure Monitor 中提取到其他工具中:
指标:使用适用于指标的 REST API 从 Azure Monitor 指标数据库提取指标数据。 API 支持使用筛选表达式优化检索到的数据。 有关详细信息,请参阅 Azure Monitor REST API 参考。
日志:使用 REST API 或关联的客户端库。
另一个选项是工作区数据导出。
要开始使用适用于 Azure Monitor 的 REST API,请参阅 Azure 监视 REST API 演练。
Kusto 查询
可使用 Kusto 查询语言 (KQL) 来分析 Azure Monitor 日志/Log Analytics 存储中的监视数据。
重要
在门户的服务菜单中选择“日志”时,会打开 Log Analytics,并且其查询范围设置为当前服务。 此范围意味着日志查询将仅包含来自该资源类型的数据。 如果希望运行的查询包含来自其他 Azure 服务的数据,请从“Azure Monitor”菜单中选择“日志”。 有关详细信息,请参阅 Azure Monitor Log Analytics 中的日志查询范围和时间范围。
有关任何服务的常见查询的列表,请参阅 Log Analytics 查询界面。
使用以下 Kusto 查询来帮助监视 IoT 中心。
连接性错误:确定设备连接错误。
AzureDiagnostics
| where ResourceProvider == "MICROSOFT.DEVICES" and ResourceType == "IOTHUBS"
| where Category == "Connections" and Level == "Error"
限制错误:确定因发出的请求最多而导致限制错误的设备。
AzureDiagnostics
| where ResourceProvider == "MICROSOFT.DEVICES" and ResourceType == "IOTHUBS"
| where ResultType == "429001"
| extend DeviceId = tostring(parse_json(properties_s).deviceId)
| summarize count() by DeviceId, Category, _ResourceId
| order by count_ desc
死终结点:按报告问题的次数来确定死的或不正常的终结点并知晓原因。
AzureDiagnostics
| where ResourceProvider == "MICROSOFT.DEVICES" and ResourceType == "IOTHUBS"
| where Category == "Routes" and OperationName in ("endpointDead", "endpointUnhealthy")
| extend parsed_json = parse_json(properties_s)
| extend Endpoint = tostring(parsed_json.endpointName), Reason = tostring(parsed_json.details)
| summarize count() by Endpoint, OperationName, Reason, _ResourceId
| order by count_ desc
错误摘要:所有操作的按类型的错误计数。
AzureDiagnostics
| where ResourceProvider == "MICROSOFT.DEVICES" and ResourceType == "IOTHUBS"
| where Level == "Error"
| summarize count() by ResultType, ResultDescription, Category, _ResourceId
最近连接的设备:IoT 中心在指定时间段内看到其已连接的设备的列表。
AzureDiagnostics
| where ResourceProvider == "MICROSOFT.DEVICES" and ResourceType == "IOTHUBS"
| where Category == "Connections" and OperationName == "deviceConnect"
| extend DeviceId = tostring(parse_json(properties_s).deviceId)
| summarize max(TimeGenerated) by DeviceId, _ResourceId
特定设备的连接事件:为特定设备 (test-device) 记录的所有连接事件。
AzureDiagnostics
| where ResourceProvider == "MICROSOFT.DEVICES" and ResourceType == "IOTHUBS"
| where Category == "Connections"
| extend DeviceId = tostring(parse_json(properties_s).deviceId)
| where DeviceId == "test-device"
设备的 SDK 版本:用于设备连接或设备到云孪生操作的设备及其 SDK 版本的列表。
AzureDiagnostics
| where ResourceProvider == "MICROSOFT.DEVICES" and ResourceType == "IOTHUBS"
| where Category == "Connections" or Category == "D2CTwinOperations"
| extend parsed_json = parse_json(properties_s)
| extend SDKVersion = tostring(parsed_json.sdkVersion) , DeviceId = tostring(parsed_json.deviceId)
| distinct DeviceId, SDKVersion, TimeGenerated, _ResourceId
警报
在监视数据中发现特定情况时,Azure Monitor 警报会主动向你发出通知。 有了警报,你就可以在客户注意到你的系统中的问题之前找出和解决问题。 有关详细信息,请参阅 Azure Monitor 警报。
Azure 资源的常见警报具有许多来源。 有关 Azure 资源常见警报的示例,请参阅示例日志警报查询。 Azure Monitor 基线警报 (AMBA) 站点提供了实现重要平台指标警报、仪表板和指南的半自动化方法。 该站点适用于持续扩展的 Azure 服务子集,包括属于 Azure 登陆区域 (ALZ) 的所有服务。
通用警报模式对 Azure Monitor 警报通知的使用体验进行了标准化。 有关详细信息,请参阅常见警报架构。
警报类型
可以针对 Azure Monitor 数据平台中的任何指标或日志数据源发出警报。 警报具有许多不同类型,具体取决于要监视的服务以及要收集的监视数据。 不同类型的警报各有优缺点。 有关详细信息,请参阅选择正确的监视警报类型。
以下列表介绍了可以创建的 Azure Monitor 警报类型:
- 指标警报会定期评估资源指标。 指标可以是平台指标、自定义指标、Azure Monitor 中的日志转换为的指标或 Application Insights 指标。 指标警报还可以应用多个条件和动态阈值。
- 日志警报支持用户使用 Log Analytics 查询按照预定义的频率评估资源日志。
- 当发生匹配所定义条件的新活动日志事件时,会触发活动日志警报。 资源运行状况警报和服务运行状况警报是报告服务和资源运行状况的活动日志警报。
某些 Azure 服务还支持智能检测警报、Prometheus 警报或建议的警报规则。
对于某些服务,你可以通过将相同的指标警报规则应用于同一 Azure 区域中的多个相同类型资源,进行大规模的监视。 将为每个受监视的资源发送单独通知。 有关受支持的 Azure 服务和云,请参阅使用一项警报规则监视多个资源。
IoT 中心警报规则
可以为 Azure IoT 中心监视数据引用中列出的任何指标、日志条目或活动日志条目设置警报。
针对设备断开连接设置指标警报
可根据 IoT 中心发出的平台指标设置警报。 通过指标警报,你可通知用户他们关注的情况已发生,还可触发可自动响应该情况的操作。
“已连接设备”指标指示连接到 IoT 中心的设备数。 如果此指标低于阈值,则可以触发警报:
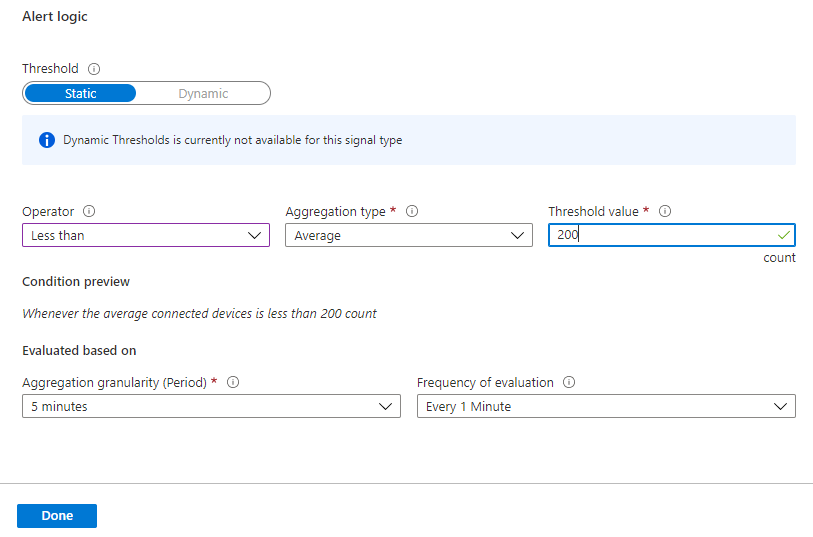
可使用指标警报规则大规模地监视设备断开连接异常情况。 即,使用警报来确定何时有大量设备意外断开连接。 如果检测到这种情况,你可以查看日志以帮助排查问题。 但是,若要近实时地监视每台设备的断开连接和关键设备的断开连接,必须使用事件网格。
若要了解有关 IoT 中心警报的详细信息,请参阅“监视 IoT 中心”中的“警报”部分。 有关在 IoT 中心创建警报的演练,请参阅 教程:在 IoT 中心设置和使用指标和日志。 有关警报的更详细概述,请参阅 Azure Monitor 文档中的 Azure Monitor 警报是什么?
顾问建议
对于某些服务,如果在资源操作期间出现严重情况或即将发生变化,则门户中的服务“概述”页面上会显示一个警报。 可以在左侧菜单“监视”下的“顾问建议”中找到警报的详细信息和建议补丁。 在正常操作期间,不会显示任何顾问建议。
有关 Azure 顾问的详细信息,请参阅 Azure 顾问概述。
相关内容
- 有关为 IoT 中心创建的指标、日志和其他重要值的参考信息,请参阅 Azure IoT 中心监视数据参考。
- 有关监视 Azure 资源的一般详细信息,请参阅使用 Azure Monitor 监视 Azure 资源。
- 请参阅监视、诊断和排查与 Azure IoT 中心的设备连接问题了解如何监视设备连接。