Note
Access to this page requires authorization. You can try signing in or changing directories.
Access to this page requires authorization. You can try changing directories.
APPLIES TO: All API Management tiers
With Azure Monitor, you can visualize, query, route, archive, and take actions on the metrics or logs coming from your Azure API Management service. For an overview of Azure Monitor for API Management, see Monitor API Management.
In this tutorial, you learn how to:
- View metrics of your API
- Set up an alert rule
- View activity logs
- Enable and view resource logs
Note
API Management supports a range of additional tools to observe APIs, including built-in analytics and integration with Application Insights. Learn more
Prerequisites
- Learn the Azure API Management terminology.
- Complete the following quickstart: Create an Azure API Management instance.
- Also, complete the following tutorial: Import and publish your first API.
View metrics of your APIs
API Management emits metrics every minute, giving you near real-time visibility into the state and health of your APIs. The following are the most frequently used metrics. For a list of all available metrics, see Metrics.
Capacity - helps you make decisions about upgrading/downgrading your API Management services. The metric is emitted per minute and reflects the estimated gateway capacity at the time of reporting. The metric ranges from 0-100 calculated based on gateway resources such as CPU and memory utilization and other factors.
Requests - helps you analyze API traffic going through your API Management services. The metric is emitted per minute and reports the number of gateway requests with dimensions. Filter requests by response codes, location, hostname, and errors.
Important
The following metrics have been retired: Total Gateway Requests, Successful Gateway Requests, Unauthorized Gateway Requests, Failed Gateway Requests, Other Gateway Requests. Please migrate to the Requests metric which provides closely similar functionality.
To access metrics:
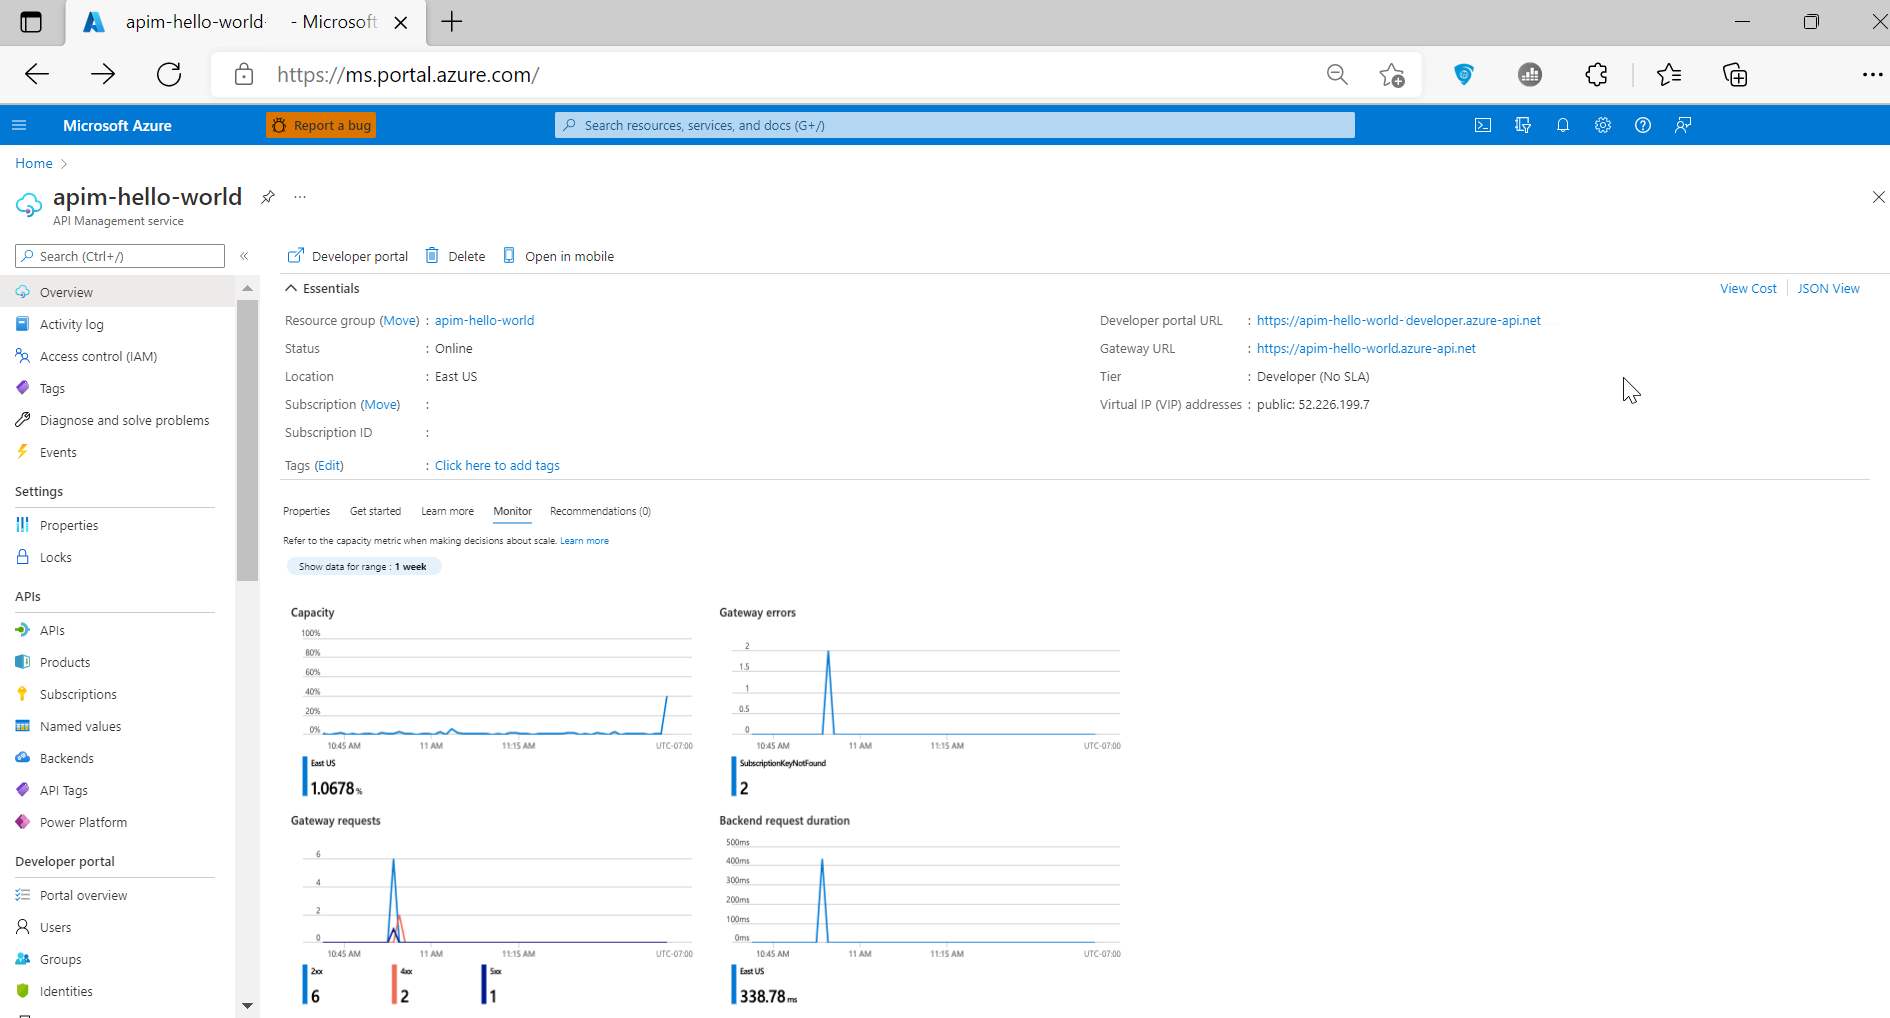
In the Azure portal, navigate to your API Management instance. On the Overview page, on the Monitor tab, review key metrics for your APIs.
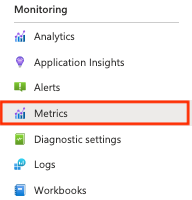
To investigate metrics in detail, select Monitoring > Metrics from the left menu.
From the drop-down, select metrics you're interested in. For example, Requests.
The chart shows the total number of API calls. Adjust the time range to focus on periods of interest.
You can filter the chart using the dimensions of the Requests metric. For example, select Add filter, select Backend Response Code Category, enter
500as the value. The chart shows the number of requests failed in the API backend.
Set up an alert rule
You can receive alerts based on metrics and activity logs. In Azure Monitor, configure an alert rule to perform an action when it triggers. Common actions include:
- Send an email notification
- Call a webhook
- Invoke an Azure Logic App
To configure an example alert rule based on a request metric:
In the Azure portal, navigate to your API Management instance.
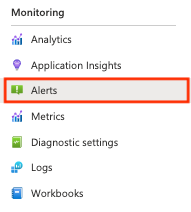
Select Monitoring > Alerts from the left menu.
Select + Create > Alert rule.
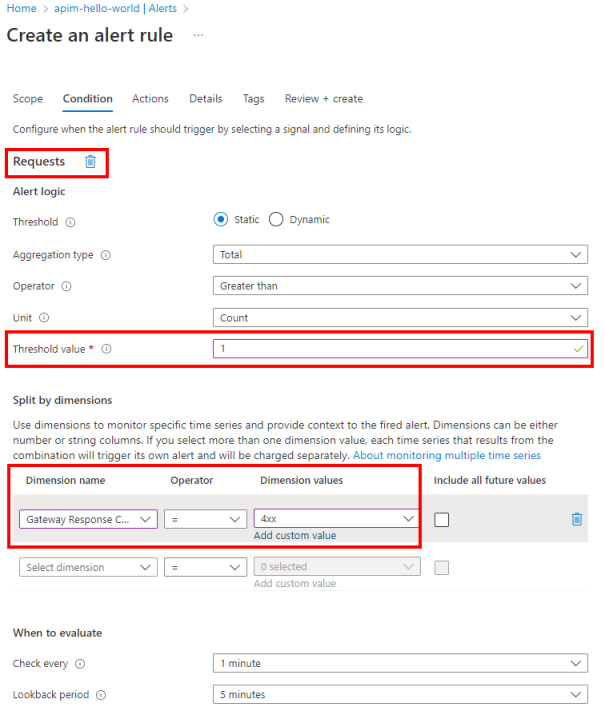
On the Condition tab:
- In Signal name, select Requests.
- In Alert logic, review or modify the default values for the alert. For example, update the static Threshold, which is the number of occurrences after which the alert should be triggered.
- In Split by dimensions, in Dimension name, select Gateway Response Code Category.
- In Dimension values, select 4xx, for client errors such as unauthorized or invalid requests. If the dimension value doesn't appear, select Add custom value and enter 4xx.
- In When to evaluate, accept the default settings, or select other settings to configure how often the rule runs. Select Next.
On the Actions tab, select or create one or more action groups to notify users about the alert and take an action. For example, create a new action group to send a notification email to
admin@contoso.com. For detailed steps, see Create and manage action groups in the Azure portal.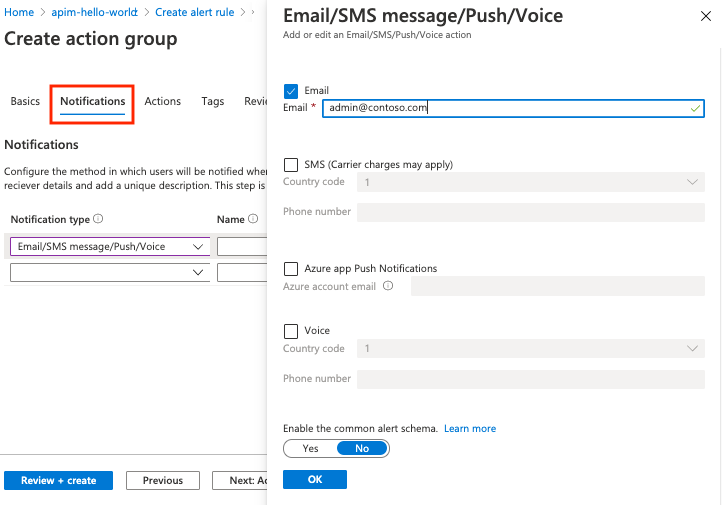
On the Details tab of Create an alert rule, enter a name and description of the alert rule and select the severity level.
Optionally configure the remaining settings. Then, on the Review + create tab, select Create.
Optionally test the alert rule by using an HTTP client to simulate a request that triggers the alert. For example, run the following command in a terminal, substituting the API Management hostname with the hostname of your API Management instance:
curl GET https://contoso.azure-api.cn/non-existent-endpoint HTTP/1.1An alert triggers based on the evaluation period, and it will send email to admin@contoso.com.
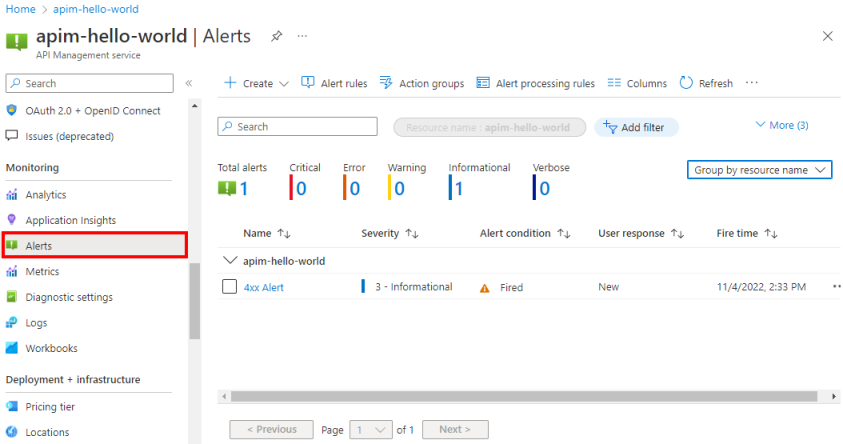
Alerts also appear on the Alerts page for the API Management instance.
Activity logs
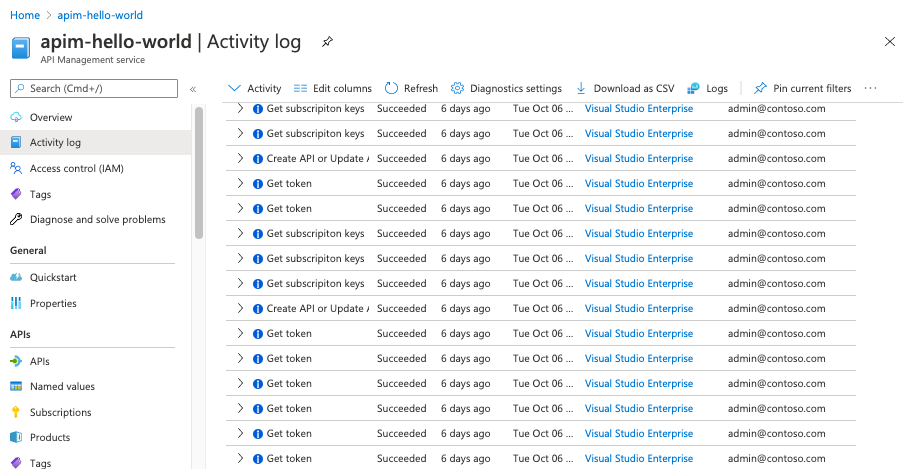
Activity logs provide insight into the operations on your API Management services. Using activity logs, you can determine the "what, who, and when" for any write operations (PUT, POST, DELETE) taken on your API Management services.
Note
Activity logs do not include read (GET) operations or operations performed in the Azure portal.
You can access activity logs in your API Management service, or access logs of all your Azure resources in Azure Monitor.
To view the activity log:
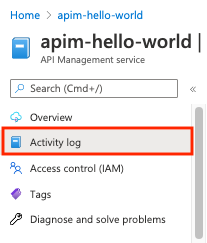
In the Azure portal, navigate to your API Management instance.
Select Activity log.
Select the desired filtering scope and then Apply.
Resource logs
Resource logs (Azure Monitor logs) provide rich information about API Management operations and errors that are important for auditing and troubleshooting purposes. When enabled through a diagnostic setting, the logs collect information about the API requests that are received and processed by the API Management gateway.
Note
The Consumption tier doesn't support the collection of resource logs.
For more information about using resource logs for API Management, see:
Modify API logging settings
When you use the portal to create a diagnostic setting to enable collection of API Management gateway or generative AI gateway (LLM) logs, logging is enabled with default settings. Default settings do not include details of requests or responses such as request or response bodies. You can adjust the logging settings for all APIs, or override them for individual APIs. For example, adjust the sampling rate or the verbosity of the gateway log data, enable logging of LLM request or response messages, or disable logging for some APIs.
For details about the logging settings, see the Diagnostic - Create or Update and the API diagnostic - Create or Update REST API reference pages.
To configure logging settings for all APIs:
- In the left menu of your API Management instance, select APIs > APIs > All APIs.
- Select the Settings tab from the top bar.
- Scroll down to the Diagnostic Logs section, and select the Azure Monitor tab.
- Review the settings and make changes if needed. Select Save.
To configure logging settings for a specific API:
- In the left menu of your API Management instance, select APIs > APIs and then the name of the API.
- Select the Settings tab from the top bar.
- Scroll down to the Diagnostic Logs section, and select the Azure Monitor tab.
- Review the settings and make changes if needed. Select Save.
Important
API Management enforces a 32 KB limit for the size of log entries sent to Azure Monitor. The behavior when a log entry exceeds the limit depends on the log category and the data attributes that are logged:
- API Management gateway logs - Logged request or response payloads in a log entry, if collected, can be up to 8,192 bytes each. If the combined size of all attributes in an entry exceeds 32 KB, API Management trims the entry by removing all body and trace content.
- Generative AI gateway logs - LLM request or response messages up to 32 KB in size, if collected, are sent in a single entry. Messages larger than 32 KB are split and logged in 32 KB chunks with sequence numbers for later reconstruction. Request messages and response messages can't exceed 2 MB each.
Next steps
In this tutorial, you learned how to:
- View metrics of your API
- Set up an alert rule
- View activity logs
- Enable and view resource logs
Advance to the next tutorial: