Note
Access to this page requires authorization. You can try signing in or changing directories.
Access to this page requires authorization. You can try changing directories.
As described in Kubernetes monitoring in Azure Monitor, multiple features of Azure Monitor work together to provide complete monitoring of your Azure Kubernetes Service (AKS) clusters. This article describes how to enable the following features for AKS clusters:
- Prometheus metrics
- Managed Grafana
- Container logging
- Control plane logs
Prerequisites
- You need at least Contributor access to the cluster for onboarding.
- To link an Azure Monitor Workspace with an existing Managed Grafana workspace as part of onboarding, you need either Owner access or at least Contributor and User Access Administrator roles.
- You need Monitoring Reader or Monitoring Contributor roles to view data after monitoring is enabled.
Important
If your clusters connect to the Azure Monitor workspace or Log Analytics workspace by using Azure private link, see Enable private link for monitoring virtual machines and Kubernetes clusters in Azure Monitor.
Create workspaces
The following table describes the workspaces that are required to support the Azure Monitor features enabled in this article. If you don't already have an existing workspace of each type, you can create them as part of the onboarding process. See Design a Log Analytics workspace architecture for guidance on how many workspaces to create and where they should be placed.
| Feature | Workspace | Notes |
|---|---|---|
| Managed Prometheus | Azure Monitor workspace | If you don't specify an existing Azure Monitor workspace when onboarding, the default workspace for the resource group is used. If a default workspace doesn't already exist in the cluster's region, one with a name in the format DefaultAzureMonitorWorkspace-<mapped_region> is created in a resource group with the name DefaultRG-<cluster_region>.Contributor permission is enough for enabling the addon to send data to the Azure Monitor workspace. You need Owner level permission to link your Azure Monitor Workspace to view metrics in Azure Managed Grafana. This is required because the user executing the onboarding step, needs to be able to give the Azure Managed Grafana System Identity Monitoring Reader role on the Azure Monitor Workspace to query the metrics. |
| Container logging Control plane logs Container insights |
Log Analytics workspace | You can attach a cluster to a Log Analytics workspace in a different Azure subscription in the same Microsoft Entra tenant, but you must use the Azure CLI or an Azure Resource Manager template. You can't currently perform this configuration with the Azure portal. If you're connecting an existing cluster to a Log Analytics workspace in another subscription, the Microsoft.ContainerService resource provider must be registered in the subscription with the Log Analytics workspace. For more information, see Register resource provider. If you don't specify an existing Log Analytics workspace, the default workspace for the resource group is used. If a default workspace doesn't already exist in the cluster's region, one is created with a name in the format DefaultWorkspace-<GUID>-<Region>. |
| Managed Grafana | Azure Managed Grafana workspace | Link your Grafana workspace to your Azure Monitor workspace to make the Prometheus metrics collected from your cluster available to Grafana dashboards. |
Prometheus metrics and container insights
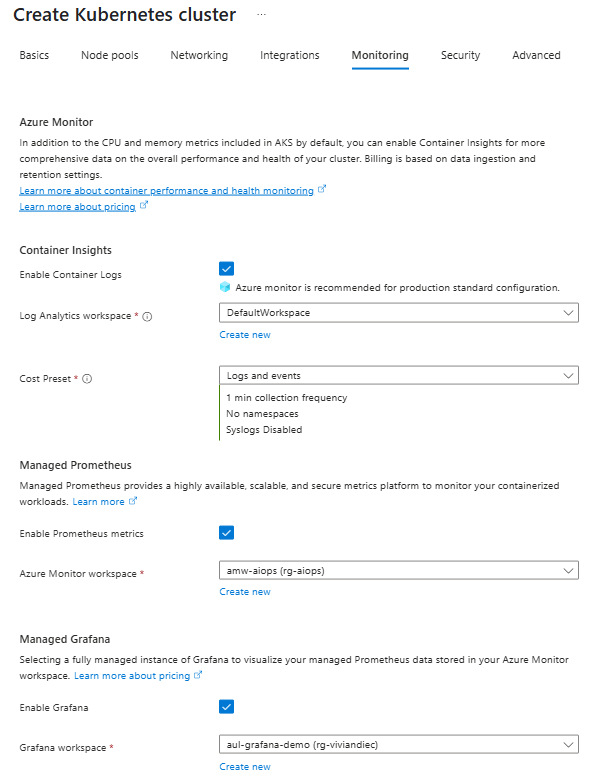
When you enable Prometheus and container insights on a cluster, a containerized version of the Azure Monitor agent is installed in the cluster. You can configure these features at the same time on a new or existing cluster, or enable each feature separately.
Enable Managed Grafana for your cluster at the same time that you enable scraping of Prometheus metrics. See Link a Grafana workspace for options to connect your Azure Monitor workspace and Azure Managed Grafana workspace.
Prerequisites
- The cluster must use managed identity authentication.
- The following resource providers must be registered in the subscription of the cluster and the Azure Monitor workspace:
- Microsoft.ContainerService
- Microsoft.Insights
- Microsoft.AlertsManagement
- Microsoft.Monitor
- The following resource providers must be registered in the subscription of the Grafana workspace subscription:
- Microsoft.Dashboard
- Managed identity authentication is default in CLI version 2.49.0 or higher.
- The
aks-previewextension must be uninstalled from AKS clusters using the commandaz extension remove --name aks-preview.
Enable Prometheus metrics on an AKS cluster
Enable Prometheus metrics on an AKS cluster using the --enable-azure-monitor-metrics option with the az aks create command for a new cluster or the az aks update command for an existing cluster. This option uses the configuration described in Default Prometheus metrics configuration in Azure Monitor. To modify this configuration, see Customize scraping of Prometheus metrics in Azure Monitor managed service for Prometheus.
Example commands:
### Use default Azure Monitor workspace
az aks create/update --enable-azure-monitor-metrics --name <cluster-name> --resource-group <cluster-resource-group>

### Use existing Azure Monitor workspace
az aks create/update --enable-azure-monitor-metrics --name <cluster-name> --resource-group <cluster-resource-group> --azure-monitor-workspace-resource-id <workspace-name-resource-id>

### Use an existing Azure Monitor workspace and link with an existing Grafana workspace
az aks create/update --enable-azure-monitor-metrics --name <cluster-name> --resource-group <cluster-resource-group> --azure-monitor-workspace-resource-id <azure-monitor-workspace-name-resource-id> --grafana-resource-id  <grafana-workspace-name-resource-id>

### Use optional parameters
az aks create/update --enable-azure-monitor-metrics --name <cluster-name> --resource-group <cluster-resource-group> --ksm-metric-labels-allow-list "namespaces=[k8s-label-1,k8s-label-n]" --ksm-metric-annotations-allow-list "pods=[k8s-annotation-1,k8s-annotation-n]"
Optional parameters
The example commands allow the following optional parameters. The parameter name is different for each, but their use is the same.
| Parameter | Name and description |
|---|---|
| Annotation keys | --ksm-metric-annotations-allow-listComma-separated list of Kubernetes annotations keys used in the resource's kube_resource_annotations metric. For example, kube_pod_annotations is the annotations metric for the pods resource. By default, this metric contains only name and namespace labels. To include more annotations, provide a list of resource names in their plural form and Kubernetes annotation keys that you want to allow for them. A single * can be provided for each resource to allow any annotations, but this has severe performance implications. For example, pods=[kubernetes.io/team,...],namespaces=[kubernetes.io/team],.... |
| Label keys | --ksm-metric-labels-allow-listComma-separated list of more Kubernetes label keys that is used in the resource's kube_resource_labels metric kube_resource_labels metric. For example, kube_pod_labels is the labels metric for the pods resource. By default this metric contains only name and namespace labels. To include more labels, provide a list of resource names in their plural form and Kubernetes label keys that you want to allow for them A single * can be provided for each resource to allow any labels, but i this has severe performance implications. For example, pods=[app],namespaces=[k8s-label-1,k8s-label-n,...],.... |
| Recording rules | --enable-windows-recording-rulesLets you enable the recording rule groups required for proper functioning of the Windows dashboards. |
Note
The parameters set using --ksm-metric-annotations-allow-list and --ksm-metric-labels-allow-list can be overridden or alternatively set using the ama-metrics-settings-configmap.
Enable container insights and logging on an AKS cluster
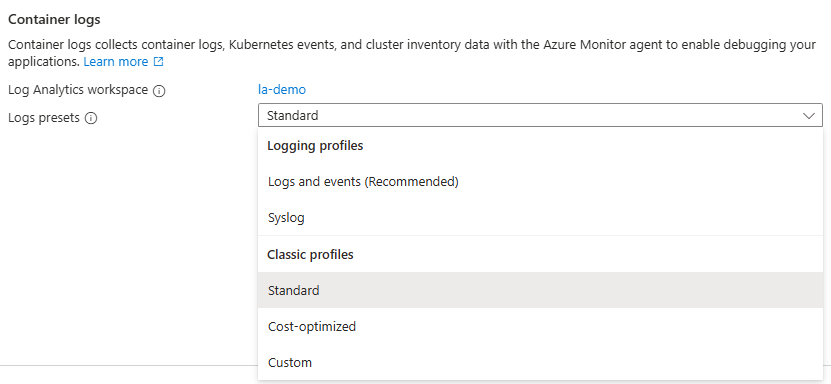
Enable container insights and container logging on an AKS cluster using the --addon monitoring option with the az aks create command for a new cluster or the az aks enable-addon command to update an existing cluster.
Example commands:
### Use default Log Analytics workspace
az aks enable-addons --addon monitoring --name <cluster-name> --resource-group <cluster-resource-group-name>

### Use existing Log Analytics workspace
az aks enable-addons --addon monitoring --name <cluster-name> --resource-group <cluster-resource-group-name> --workspace-resource-id <workspace-resource-id>

### Use custom log configuration file
az aks enable-addons --addon monitoring --name <cluster-name> --resource-group <cluster-resource-group-name> --workspace-resource-id <workspace-resource-id> --data-collection-settings dataCollectionSettings.json
Log configuration file
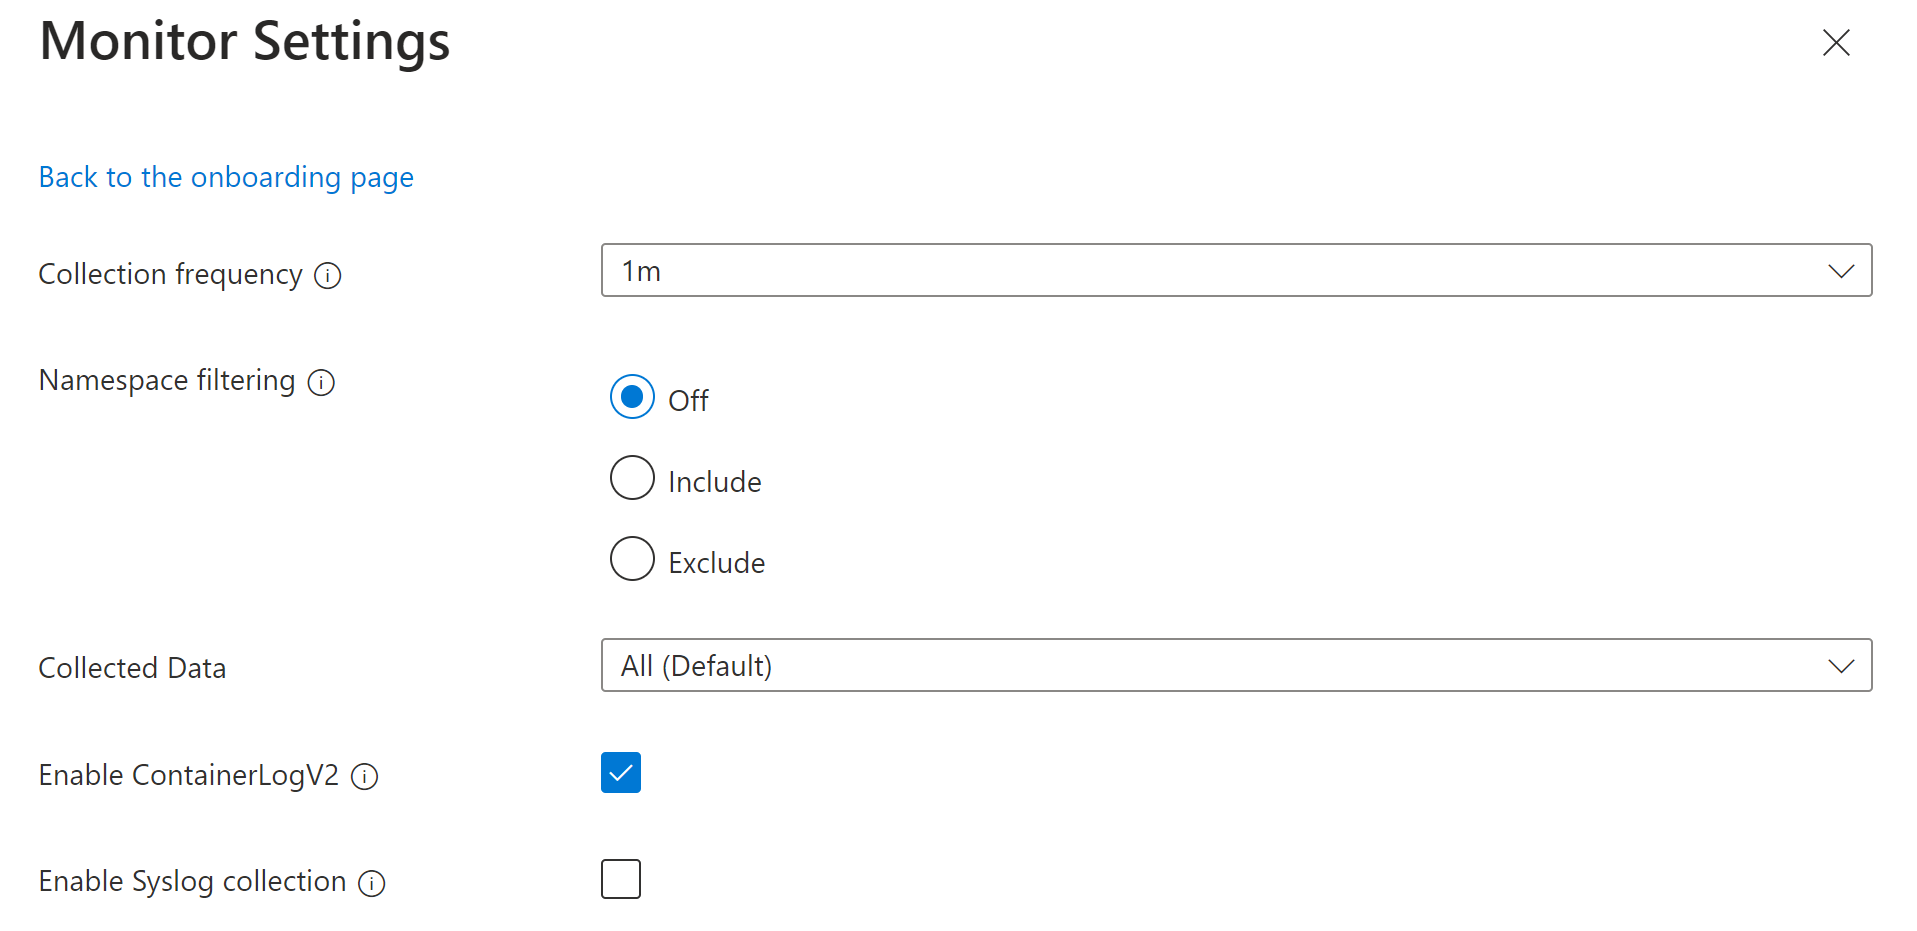
To customize log collection settings for the cluster, you can provide the configuration as a JSON file using the following format. If you don't provide a configuration file, the default settings identified in the table are used.
{
  "interval": "1m",
  "namespaceFilteringMode": "Include",
  "namespaces": ["kube-system"],
  "enableContainerLogV2": true,
  "streams": ["Microsoft-Perf", "Microsoft-ContainerLogV2"]
}
The following table describes each of the settings in the log configuration file:
| Name | Description |
|---|---|
interval |
Determines how often the agent collects data. Valid values are 1m - 30m in 1m intervals If the value is outside the allowed range, then it defaults to 1m. Default: 1m. |
namespaceFilteringMode |
Include: Collects only data from the values in the namespaces field. Exclude: Collects data from all namespaces except for the values in the namespaces field. Off: Ignores any namespace selections and collect data on all namespaces. Default: Off |
namespaces |
Array of comma separated Kubernetes namespaces to collect inventory and perf data based on the namespaceFilteringMode. For example, namespaces = ["kube-system", "default"] with an Include setting collects only these two namespaces. With an Exclude setting, the agent collects data from all other namespaces except for kube-system and default. With an Off setting, the agent collects data from all namespaces including kube-system and default. Invalid and unrecognized namespaces are ignored. None. |
enableContainerLogV2 |
Boolean flag to enable ContainerLogV2 schema. If set to true, the stdout/stderr Logs are ingested to ContainerLogV2 table. If not, the container logs are ingested to ContainerLog table, unless otherwise specified in the ConfigMap. When specifying the individual streams, you must include the corresponding table for ContainerLog or ContainerLogV2. Default: True |
streams |
An array of table streams to collect. See Stream values for a list of the valid streams and their corresponding tables. Default: Microsoft-ContainerInsights-Group-Default |
Stream values
When you specify the tables to collect using CLI or BICEP/ARM, you specify stream names that correspond to particular tables in the Log Analytics workspace. The following table lists the stream names and their corresponding table.
Note
If you're familiar with the structure of a data collection rule, the stream names in this table are specified in the Data flows section of the DCR.
| Stream | Container insights table |
|---|---|
| Microsoft-ContainerInventory | ContainerInventory |
| Microsoft-ContainerLog | ContainerLog |
| Microsoft-ContainerLogV2 | ContainerLogV2 |
| Microsoft-ContainerLogV2-HighScale | ContainerLogV2 (High scale mode)1 |
| Microsoft-ContainerNodeInventory | ContainerNodeInventory |
| Microsoft-InsightsMetrics | InsightsMetrics |
| Microsoft-KubeEvents | KubeEvents |
| Microsoft-KubeMonAgentEvents | KubeMonAgentEvents |
| Microsoft-KubeNodeInventory | KubeNodeInventory |
| Microsoft-KubePodInventory | KubePodInventory |
| Microsoft-KubePVInventory | KubePVInventory |
| Microsoft-KubeServices | KubeServices |
| Microsoft-Perf | Perf |
| Microsoft-ContainerInsights-Group-Default | Group stream that includes all of the above streams.2 |
1 Don't use both Microsoft-ContainerLogV2 and Microsoft-ContainerLogV2-HighScale together. This will result in duplicate data. 2 Use the group stream as a shorthand to specifying all the individual streams. If you want to collect a specific set of streams then specify each stream individually instead of using the group stream.
Applicable tables and metrics
The settings for collection frequency and namespace filtering don't apply to all log data. The following tables list the tables in the Log Analytics workspace along with the settings that apply to each.
| Table name | Interval? | Namespaces? | Remarks |
|---|---|---|---|
| ContainerInventory | Yes | Yes | |
| ContainerNodeInventory | Yes | No | Data collection setting for namespaces isn't applicable since Kubernetes Node isn't a namespace scoped resource |
| KubeNodeInventory | Yes | No | Data collection setting for namespaces isn't applicable Kubernetes Node isn't a namespace scoped resource |
| KubePodInventory | Yes | Yes | |
| KubePVInventory | Yes | Yes | |
| KubeServices | Yes | Yes | |
| KubeEvents | No | Yes | Data collection setting for interval isn't applicable for the Kubernetes Events |
| Perf | Yes | Yes | Data collection setting for namespaces isn't applicable for the Kubernetes Node related metrics since the Kubernetes Node isn't a namespace scoped object. |
| InsightsMetrics | Yes | Yes | Data collection settings are only applicable for the metrics collecting the following namespaces: container.azm.ms/kubestate, container.azm.ms/pv, and container.azm.ms/gpu. |
Note
Namespace filtering doesn't apply to ama-logs agent records. As a result, even if the kube-system namespace is listed among excluded namespaces, records associated to ama-logs agent container are still ingested.
| Metric namespace | Interval? | Namespaces? | Remarks |
|---|---|---|---|
| Insights.container/nodes | Yes | No | Node isn't a namespace scoped resource |
| Insights.container/pods | Yes | Yes | |
| Insights.container/containers | Yes | Yes | |
| Insights.container/persistentvolumes | Yes | Yes |
Special scenarios
Use the following resources for configuration requirements for particular scenarios:
- If you're using private link, see Enable private link for Kubernetes monitoring in Azure Monitor.
- To enable high scale mode, follow the onboarding process at Enable high scale mode for Monitoring add-on. You must also update the ConfigMap as described in Update ConfigMap, and the DCR stream needs to be changed from
Microsoft-ContainerLogV2toMicrosoft-ContainerLogV2-HighScale.
Enable control plane logs on an AKS cluster
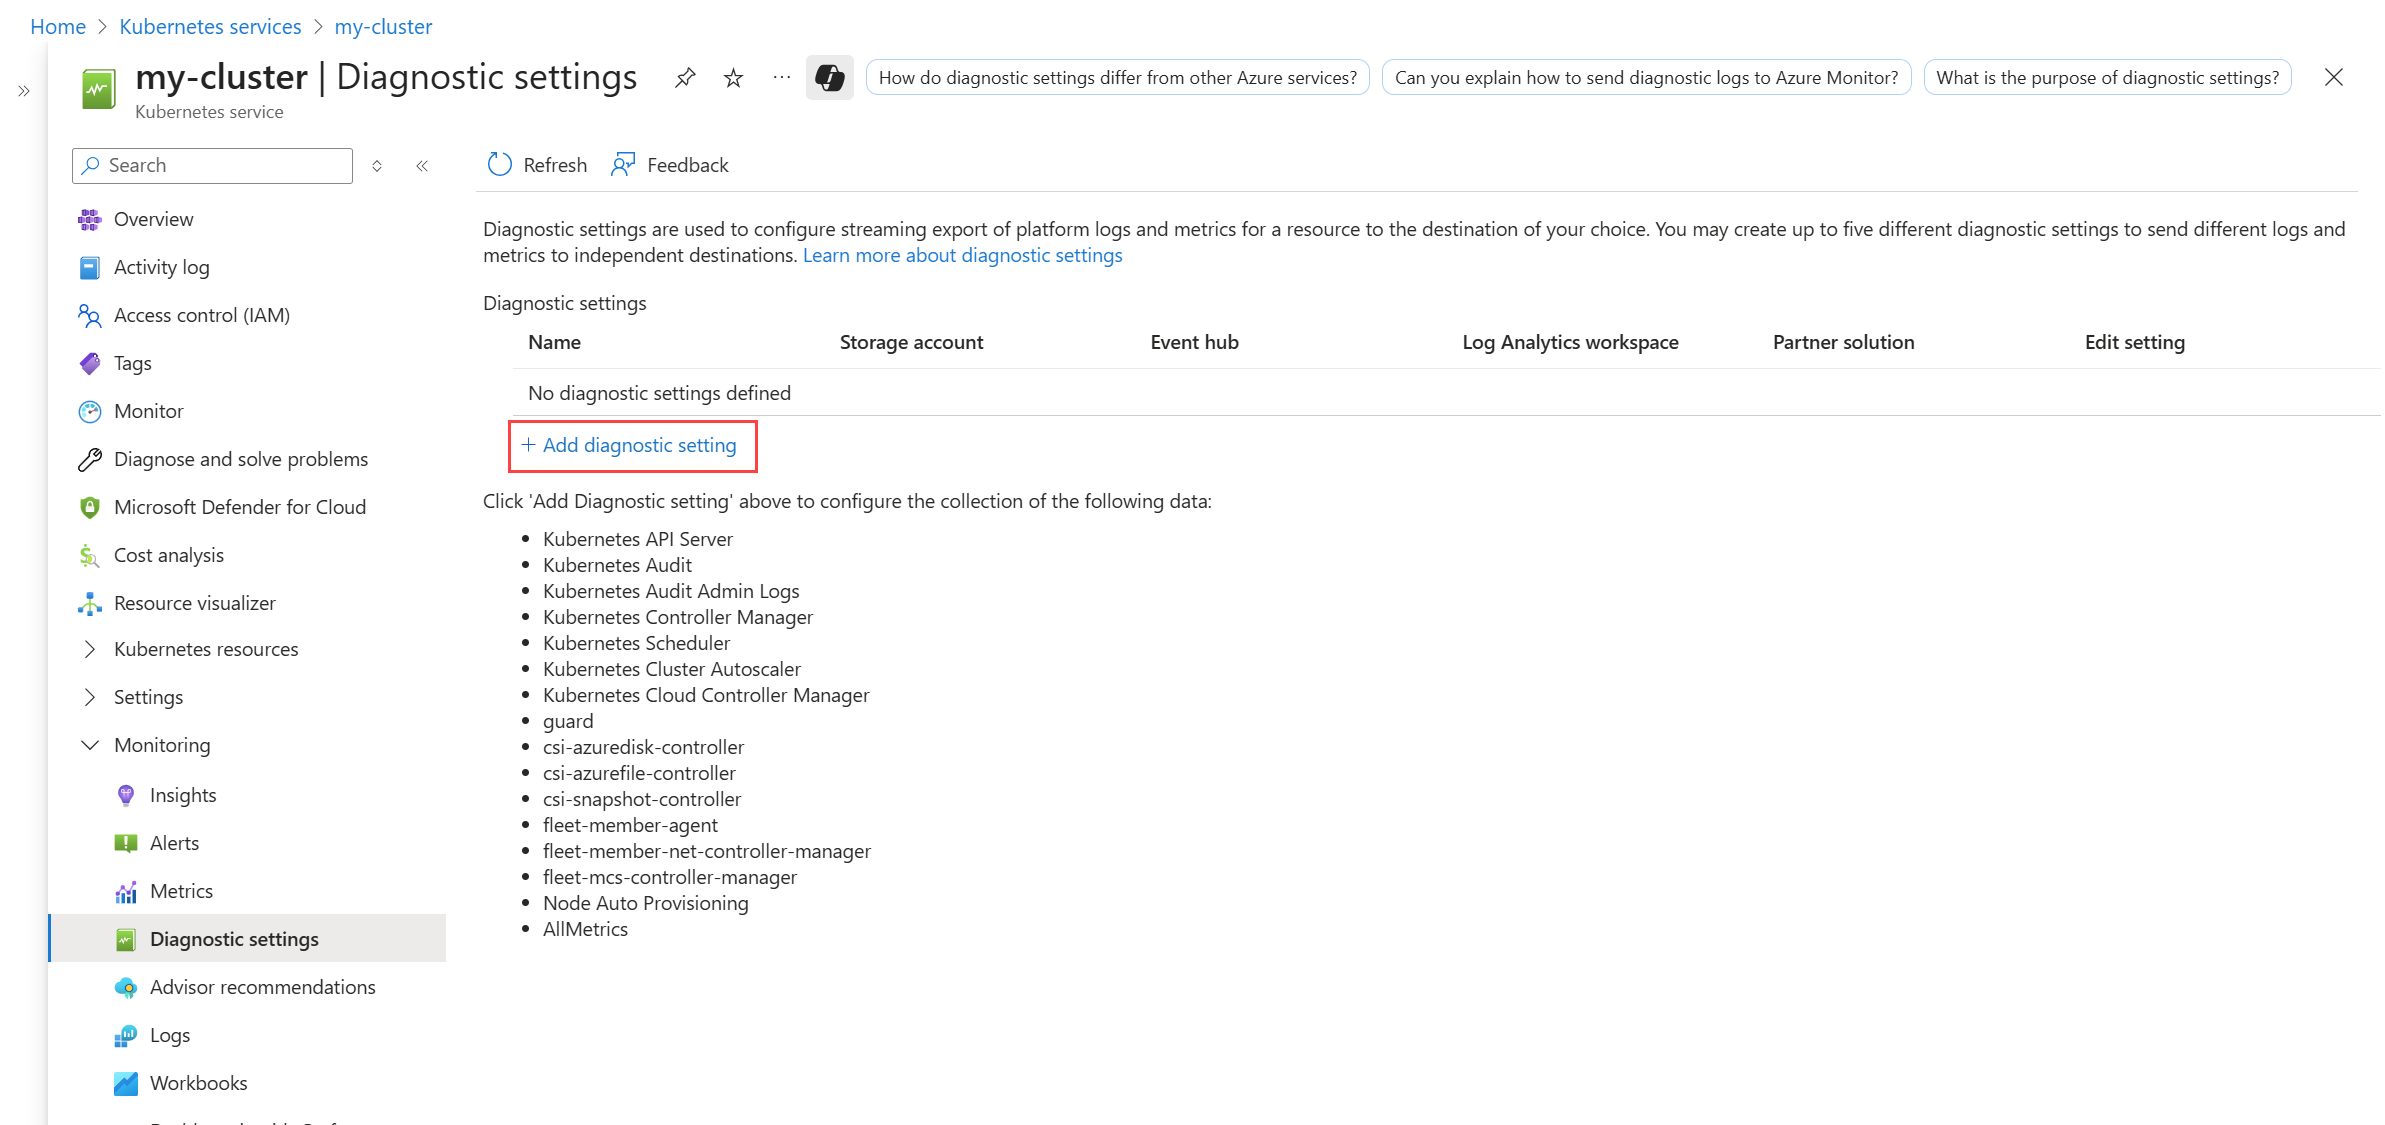
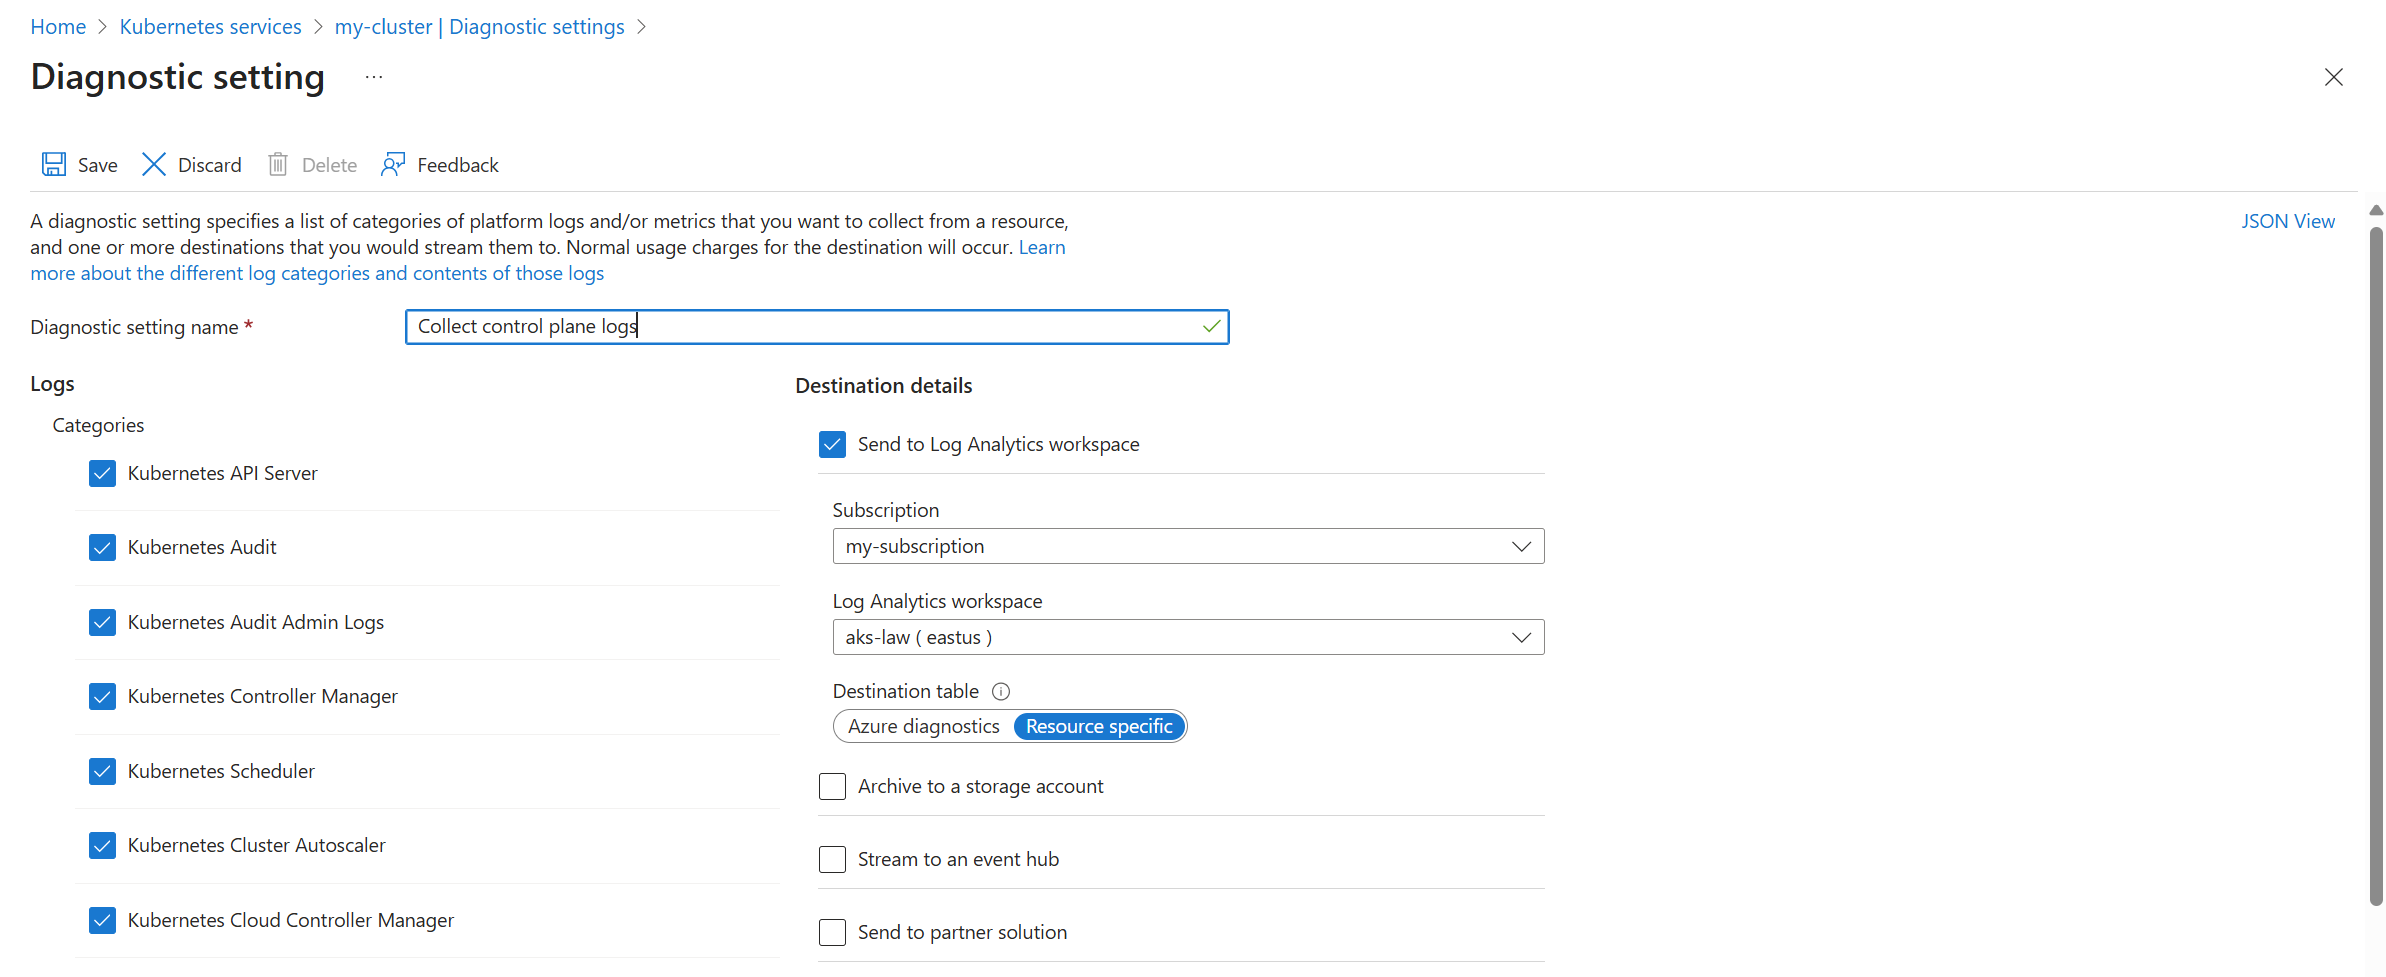
Control plane logs are implemented as resource logs in Azure Monitor. To collect these logs, create a diagnostic setting for the cluster. Send them to the same Log Analytics workspace as your container logs.
Use the az monitor diagnostic-settings create command to create a diagnostic setting with the Azure CLI. See the documentation for this command for descriptions of its parameters.
The following example creates a diagnostic setting that sends all Kubernetes categories to a Log Analytics workspace. This includes resource-specific mode to send the logs to specific tables listed in Supported resource logs for Microsoft.ContainerService/fleets.
az monitor diagnostic-settings create \
--name 'Collect control plane logs' \
--resource  /subscriptions/<subscription ID>/resourceGroups/<resource group name>/providers/Microsoft.ContainerService/managedClusters/<cluster-name> \
--workspace /subscriptions/<subscription ID>/resourcegroups/<resource group name>/providers/microsoft.operationalinsights/workspaces/<log analytics workspace name> \
--logs '[{"category": "karpenter-events","enabled": true},{"category": "kube-audit","enabled": true},
{"category": "kube-apiserver","enabled": true},{"category": "kube-audit-admin","enabled": true},{"category": "kube-controller-manager","enabled": true},{"category": "kube-scheduler","enabled": true},{"category": "cluster-autoscaler","enabled": true},{"category": "cloud-controller-manager","enabled": true},{"category": "guard","enabled": true},{"category": "csi-azuredisk-controller","enabled": true},{"category": "csi-azurefile-controller","enabled": true},{"category": "csi-snapshot-controller","enabled": true},{"category": "fleet-member-agent","enabled": true},{"category": "fleet-member-net-controller-manager","enabled": true},{"category": "fleet-mcs-controller-manager","enabled": true}]'
--metrics '[{"category": "AllMetrics","enabled": true}]' \
--export-to-resource-specific true
Enable Windows metrics (Preview)
Windows metric collection is enabled for AKS clusters as of version 6.4.0-main-02-22-2023-3ee44b9e of the Managed Prometheus addon container. Onboarding to the Azure Monitor Metrics add-on enables the Windows DaemonSet pods to start running on your node pools. Both Windows Server 2019 and Windows Server 2022 are supported. Follow these steps to enable the pods to collect metrics from your Windows node pools.
Note
There's no CPU/Memory limit in windows-exporter-daemonset.yaml so it might overprovision the Windows nodes. For details see Resource reservation
As you deploy workloads, set resource memory and CPU limits on containers. This also subtracts from NodeAllocatable and helps the cluster-wide scheduler in determining which pods to place on which nodes. Scheduling pods without limits might overprovision the Windows nodes and in extreme cases can cause the nodes to become unhealthy.
Install Windows exporter
Manually install windows-exporter on AKS nodes to access Windows metrics by deploying the windows-exporter-daemonset YAML file. Enable the following collectors. For more collectors, see Prometheus exporter for Windows metrics.
[defaults]containermemoryprocesscpu_info
Deploy the windows-exporter-daemonset YAML file. If there are any taints applied in the node, you need to apply the appropriate tolerations.
kubectl apply -f windows-exporter-daemonset.yaml
Enable Windows metrics
Set the windowsexporter and windowskubeproxy Booleans to true in your metrics settings ConfigMap and apply it to the cluster. See Customize collection of Prometheus metrics from your Kubernetes cluster using ConfigMap.
Enable recording rules
Enable the recording rules that are required for the out-of-the-box dashboards:
- If onboarding using CLI, include the option
--enable-windows-recording-rules. - If onboarding using an ARM template, Bicep, or Azure Policy, set
enableWindowsRecordingRulestotruein the parameters file. - If the cluster is already onboarded, use this ARM template and this parameter file to create the rule groups. This adds the required recording rules and isn't an ARM operation on the cluster and doesn't impact current monitoring state of the cluster.
Verify deployment
Use the kubectl command line tool to verify that the agent is deployed properly.
Managed Prometheus
Verify that the DaemonSet was deployed properly on the Linux node pools
kubectl get ds ama-metrics-node --namespace=kube-system
The number of pods should be equal to the number of Linux nodes on the cluster. The output should resemble the following example:
User@aksuser:~$ kubectl get ds ama-metrics-node --namespace=kube-system
NAME               DESIRED   CURRENT   READY   UP-TO-DATE   AVAILABLE   NODE SELECTOR   AGE
ama-metrics-node   1         1         1       1            1           <none>          10h
Verify that Windows nodes were deployed properly
kubectl get ds ama-metrics-win-node --namespace=kube-system
The number of pods should be equal to the number of Windows nodes on the cluster. The output should resemble the following example:
User@aksuser:~$ kubectl get ds ama-metrics-node --namespace=kube-system
NAME                   DESIRED   CURRENT   READY   UP-TO-DATE   AVAILABLE   NODE SELECTOR   AGE
ama-metrics-win-node   3         3         3       3            3           <none>          10h
Verify that the two ReplicaSets were deployed for Prometheus
kubectl get rs --namespace=kube-system
The output should resemble the following example:
User@aksuser:~$kubectl get rs --namespace=kube-system
NAME                            DESIRED   CURRENT   READY   AGE
ama-metrics-5c974985b8          1         1         1       11h
ama-metrics-ksm-5fcf8dffcd      1         1         1       11h
Container insights and logging
Verify that the DaemonSets were deployed properly on the Linux node pools
kubectl get ds ama-logs --namespace=kube-system
The number of pods should be equal to the number of Linux nodes on the cluster. The output should resemble the following example:
User@aksuser:~$ kubectl get ds ama-logs --namespace=kube-system
NAME       DESIRED   CURRENT   READY     UP-TO-DATE   AVAILABLE   NODE SELECTOR   AGE
ama-logs   2         2         2         2            2           <none>          1d
Verify that Windows nodes were deployed properly
kubectl get ds ama-logs-windows --namespace=kube-system
The number of pods should be equal to the number of Windows nodes on the cluster. The output should resemble the following example:
User@aksuser:~$ kubectl get ds ama-logs-windows --namespace=kube-system
NAME                   DESIRED   CURRENT   READY     UP-TO-DATE   AVAILABLE   NODE SELECTOR     AGE
ama-logs-windows           2         2         2         2            2       <none>            1d
Verify deployment of the container logging solution
kubectl get deployment ama-logs-rs --namespace=kube-system
The output should resemble the following example:
User@aksuser:~$ kubectl get deployment ama-logs-rs --namespace=kube-system
NAME          READY   UP-TO-DATE   AVAILABLE   AGE
ama-logs-rs   1/1     1            1           24d
View configuration with CLI
Use the aks show command to find out whether the solution is enabled, the Log Analytics workspace resource ID, and summary information about the cluster.
az aks show --resource-group <resourceGroupofAKSCluster> --name <nameofAksCluster>
The command returns JSON-formatted information about the solution. The addonProfiles section should include information on the omsagent as in the following example:
"addonProfiles": {
    "omsagent": {
        "config": {
            "logAnalyticsWorkspaceResourceID": "/subscriptions/aaaa0a0a-bb1b-cc2c-dd3d-eeeeee4e4e4e/resourcegroups/my-resource-group/providers/microsoft.operationalinsights/workspaces/my-workspace",
            "useAADAuth": "true"
        },
        "enabled": true,
        "identity": null
    },
}
Related content
- If you experience issues attempting to onboard, review the Troubleshooting guide.
- Learn how to Analyze Kubernetes monitoring data in the Azure portal Container insights.


