Note
Access to this page requires authorization. You can try signing in or changing directories.
Access to this page requires authorization. You can try changing directories.
The data profile feature in the Azure Data Explorer web UI allows you to quickly gain insights into the data within your tables. It features a time chart illustrating data distribution according to a specified datetime field and presents each column of the table along with essential related statistics. This article explains how to access and understand the data profile of a table.
Prerequisites
- A Microsoft account or a Microsoft Entra user identity. An Azure subscription isn't required.
- Sign in to the Azure Data Explorer web UI.
Open the data profile
To open the data profile view for a table:
From the left menu, select Query.
Right-click the desired table, and select Data profile:
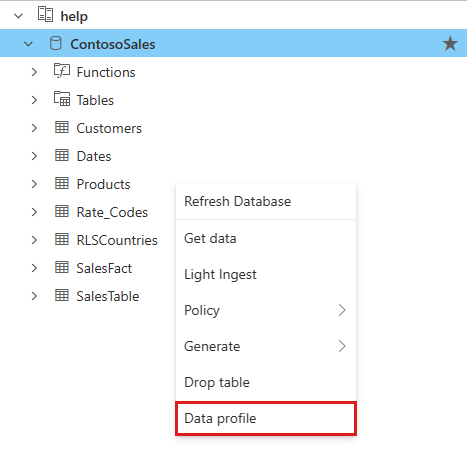
The data profile for the selected table view opens in a side window.
Note
The data profile is based on data from the hot cache.
Filter data by time range
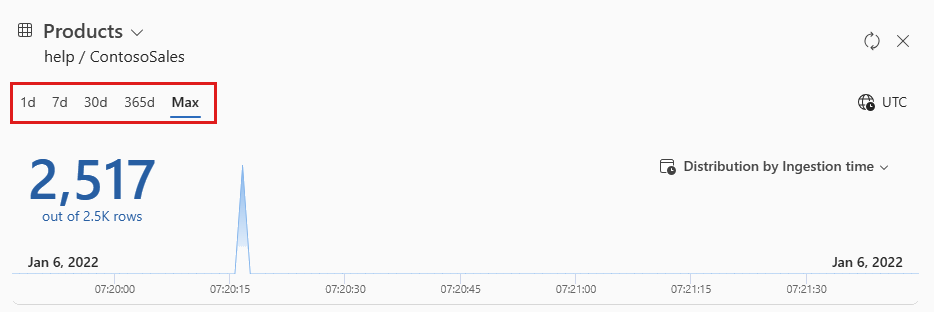
To filter the data presented in the data profile by ingestion time, select one of the tabs at the top of the profile. These tabs allow you to filter by one day (1d), one week (7d), one month (30d), one year (365d) or the full time range of your data (max).
View data distribution by other datetime columns
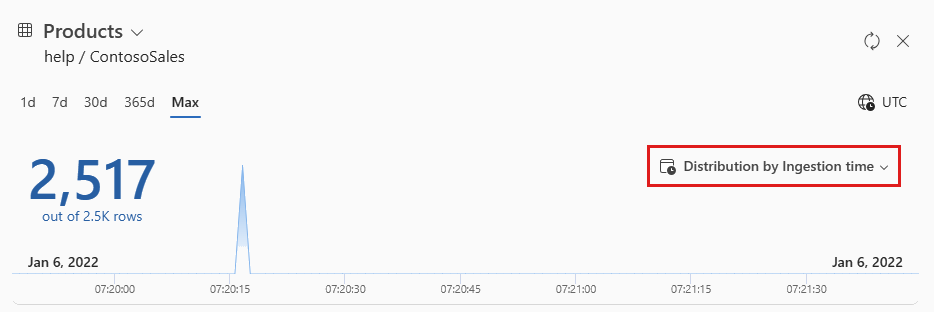
By default, the time chart shows the data distribution by ingestion time. To view the distribution by a different datetime column, select the dropdown tab at the top right of the chart.
View columns and their top values
You can browse the table schema in the profile by looking at the columns or finding a particular column. You can also choose columns to see their top values, value distributions, and sample values depending on their data type, as follows:
| Type | Statistic | On selection |
|---|---|---|
| string | Count of unique values | Top 10 values |
| numeric | Minimum and maximum values | Top 10 values |
| datetime | Date range | Top 10 values |
| dynamic | No specific statistic | Random sampled value |
| bool | No specific statistic | Count of true and false |
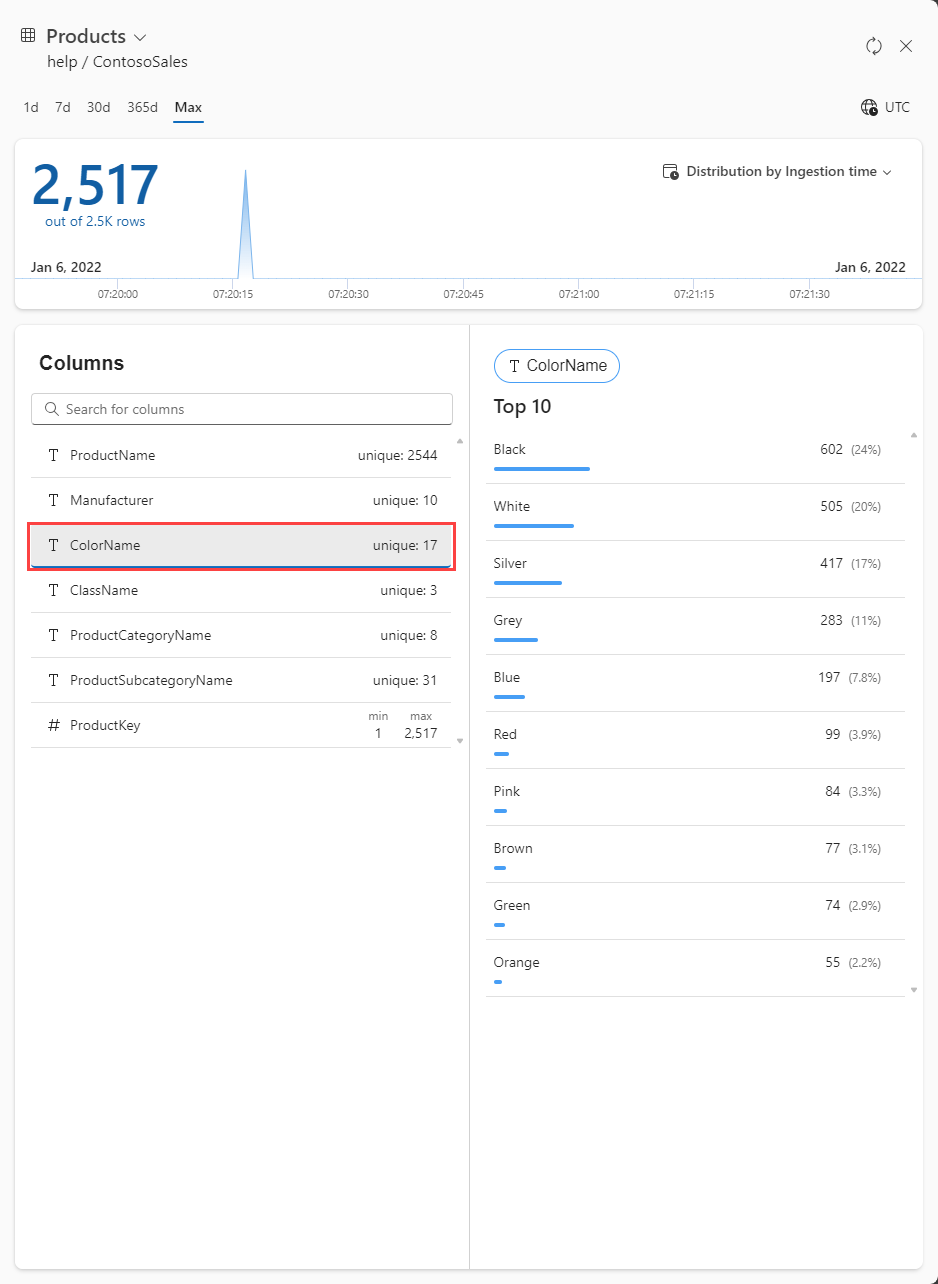
For example, in the following image, the ColorName column of type string is selected: