Note
Access to this page requires authorization. You can try signing in or changing directories.
Access to this page requires authorization. You can try changing directories.
The Azure Data Explorer web UI provides an end-to-end data exploration experience from data ingestion to data query and customizable dashboards to visualize data and insights. This article provides an overview of the web UI query page and explains how it can be used to interact with your data.
In the query page, you can:

On the Azure Data Explorer web UI home page, there are guides to help get you started querying different types of data.
View clusters and databases
The connection pane on the left-hand side of the query page allows you to browse and switch between your clusters and databases. Under each cluster, you can see the databases included in that cluster. Under each database, you can see the tables, functions, external tables, and materialized views included in that database.
From the connection pane, right-click on a database to open a menu with options to Ingest data, Create table, and more.

To learn how to add a connection, see Add a cluster connection in the Azure Data Explorer web UI.
Tip
- Add clusters and databases to your favorites list with the star icon next to the resource name. To view only your favorite resources, select the star icon next to the filter text box.
- Add clusters to groups for easier management. Groups display below favorites.
Gain quick insights into table data
The data profile feature provides quick access to column names, types, essential statistics, and top values within each column.
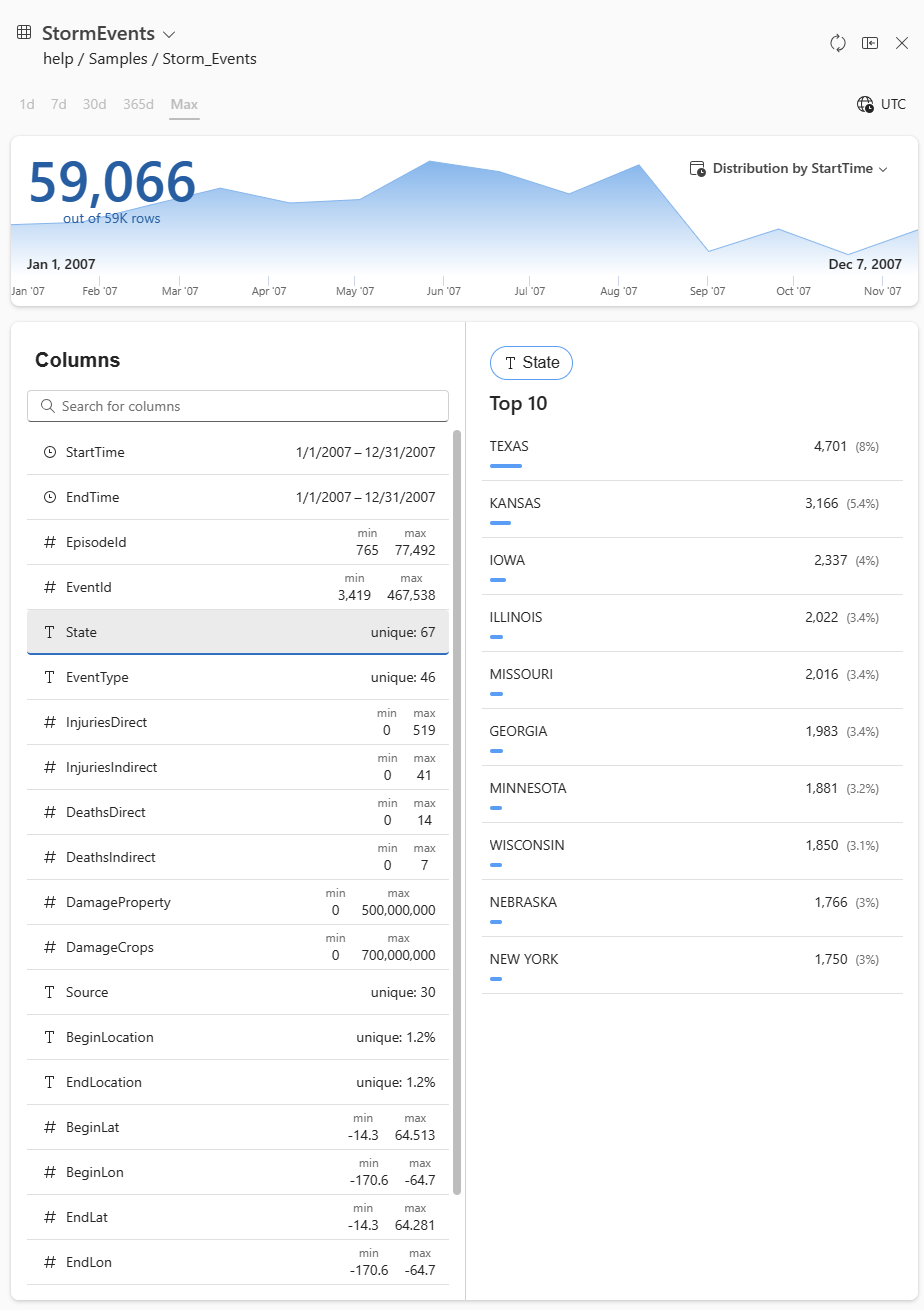
For more information, see Gain quick insights into table data.
Write and run queries
Use the query editor to interact with your data by running queries in the context of a specific database. To set the query context, select the relevant database from the left panel. The query context is displayed in the top toolbar.

The editor offers Kusto Query Language (KQL) Intellisense and autocompletion, providing helpful suggestions as you write your query. The editor also alerts you when accessing data outside the selected database and suggests query optimizations. To return all records matching the query, select Run or press Shift + Enter. To see a preview of 50 results, select the dropdown menu on the Run button and select Preview results or press Alt + Shift + Enter.

Manage queries in multiple contexts
With the use of query tabs, you can work on multiple queries simultaneously, all with their own query context. The query tabs allow you to switch between different databases and clusters without losing your work. To rename a query tab, double-click on the tab title or select the pencil icon on the tab. To get a comprehensive view of all existing tabs, use the tabs list located in the top right corner.

Note
The default name of a query tab is based on the cluster and context database.
Explore and transform query results
After you execute a query, the results are displayed in the results grid located below the query editor. The results grid presents query results in a tabular format, and provides functionality to sort, filter, group, and visualize the data in various ways. For more information, see Azure Data Explorer web UI results grid.
You can also view query statistics such as query duration, CPU and memory usage, and data scanned. These statistics can be useful when trying to optimize your queries. For information on potential optimizations, see Query best practices.

Recall previous queries
The recall query button allows you to quickly retrieve a previously executed query. Select the query you want and select Recall to run it again from the data stored in the browser's cache.

Note
The results for the last 50 queries are stored in the cache, so if the browser cache is cleared then the results are removed.
Share and export queries
In the query page toolbar, there are several options to manage your queries and query results. You can pin a query to a dashboard, copy queries, copy query results, and export data to Power BI, Excel, and CSV formats. For more information, see Share queries from Azure Data Explorer web UI.

Related content
- Explore query results with the web UI results grid
- Visualize data with Azure Data Explorer dashboards
- Customize settings in the web UI