Note
Access to this page requires authorization. You can try signing in or changing directories.
Access to this page requires authorization. You can try changing directories.
Applies to:  IoT Edge 1.6
Important
IoT Edge 1.6 LTS is the supported release. IoT Edge 1.5 LTS support ends on November 10, 2026; IoT Edge 1.4 LTS reached end of life on November 12, 2024. If you're using an earlier release, see Update IoT Edge.
You can remotely monitor your IoT Edge fleet by using Azure Monitor and built-in metrics integration. To enable this capability on your device, add the metrics-collector module to your deployment and configure it to collect and transport module metrics to Azure Monitor.
Metrics Collector 2.0 sends direct uploads to a Log Analytics custom table by using a DCR and Microsoft Entra authentication. To upgrade from workspace-key authentication, see Migrate the metrics collector.
To configure monitoring on your IoT Edge device, follow the tutorial for monitoring IoT Edge devices. You learn how to add the metrics-collector module to your device. This article gives you an overview of the monitoring architecture and explains your options for configuring metrics on your device.
Architecture
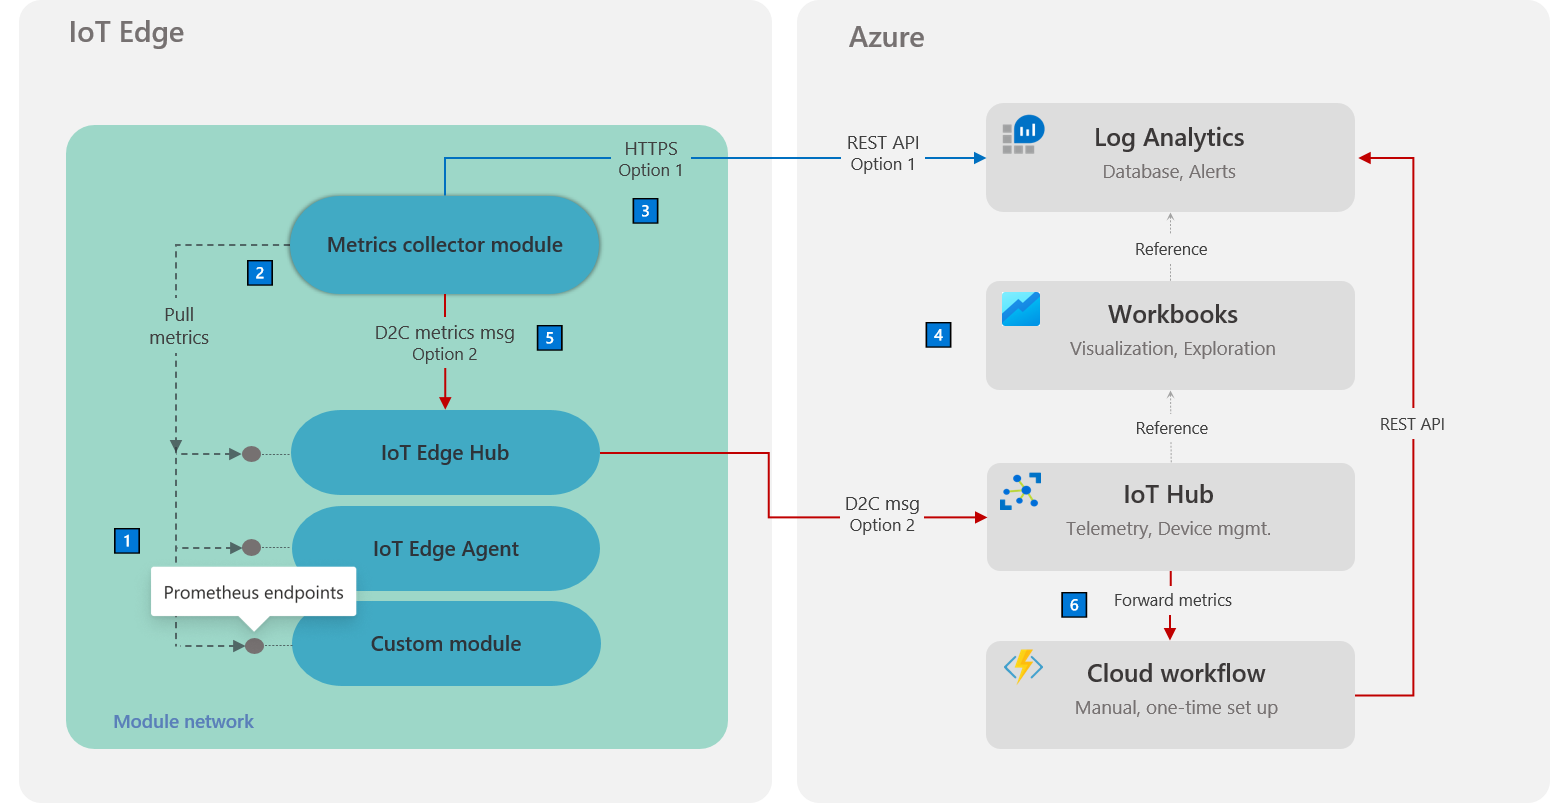
| Note | Description |
|---|---|
| 1 | All modules must emit metrics by using the Prometheus data model. While built-in metrics enable broad workload visibility by default, custom modules can also emit scenario-specific metrics to enhance the monitoring solution. Learn how to instrument custom modules by using open-source libraries in the Add custom metrics article. |
| 2️ | The metrics-collector module is a Microsoft-supplied IoT Edge module that collects workload module metrics and transports them off-device. Metrics collection uses a pull model. You can configure collection frequency, endpoints, and filters to control the data egressed from the module. For more information, see the Metrics collector configuration section in this article. |
| 3️ | Option 1 sends metrics directly to a Log Analytics custom table.1 Configure a DCR and Microsoft Entra identity. |
| 4️ | ResourceId identifies the IoT hub. The collector stores this value in ordinary ResourceId. The workbooks query the workspace and filter this column for the intended resources. |
| 5️ | Option 2 sends the metrics to IoT Hub.1 You can configure the collector module to send the collected metrics as UTF-8 encoded JSON device-to-cloud messages via the edgeHub module. This option unlocks monitoring of locked-down IoT Edge devices that are allowed external access to only the IoT Hub endpoint. It also enables monitoring of child IoT Edge devices in a nested configuration where child devices can only access their parent device. |
| 6️ | When metrics are routed via IoT Hub, a (one-time) cloud workflow needs to be set up. The workflow processes messages arriving from the metrics-collector module and sends them to the Log Analytics workspace. The workflow enables the curated visualizations and alerts functionality even for metrics arriving via this optional path. For more information about how to set up this cloud workflow, see the Route metrics section in this article. |
1 Currently, using option 1 to directly transport metrics to Log Analytics from the IoT Edge device is the simpler path that requires minimal setup. The first option is preferred unless your specific scenario demands the option 2 approach so that the IoT Edge device communicates only with IoT Hub.
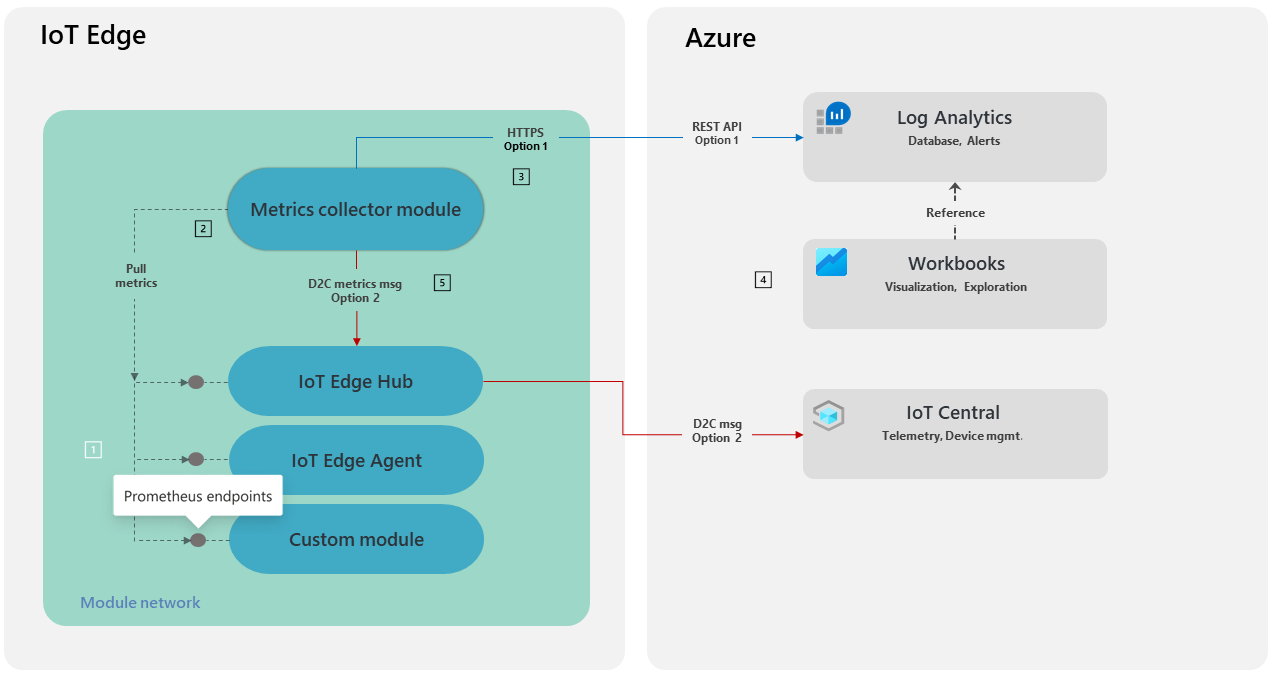
Metrics collector module
You can add a Microsoft-supplied metrics-collector module to an IoT Edge deployment to collect module metrics and send them to Azure Monitor. The module code is open source and available in the IoT Edge GitHub repo.
Use the image mcr.microsoft.com/azureiotedge-metrics-collector:2.0.0. For available image tags and architectures, see Microsoft Artifact Registry.
Transport options
UploadTarget |
Destination | Requirements |
|---|---|---|
AzureMonitor (default) |
Log Analytics custom table | DCR, HTTPS ingestion endpoint, custom table, and Microsoft Entra identity. |
IotMessage |
IoT Hub or IoT Central through edgeHub | An edgeHub route for metricOutput. Forwarding to Log Analytics requires a separate cloud workflow. |
An upgrade doesn't migrate existing history, saved workbooks, or alert rules. To upgrade, see Migrate the metrics collector.
Metrics collector configuration
Configure Metrics Collector 2.0 by using environment variables. At a minimum, specify the variables marked as Required in this table.
| Environment variable name | Description |
|---|---|
ResourceId |
Resource ID of the IoT hub that the device communicates with. For more information, see Resource ID. Required Default value: none |
UploadTarget |
Controls whether metrics are sent directly to Azure Monitor over HTTPS or to IoT Hub as D2C messages. For more information, see Upload target. Can be either AzureMonitor or IoTMessage Not required Default value: AzureMonitor |
DataCollectionEndpoint |
HTTPS logs-ingestion base endpoint from the DCR or DCE. Required for AzureMonitor. Default value: none |
DataCollectionRuleId |
DCR immutable ID, starting with dcr-, not its name or ARM ID. Required for AzureMonitor. Default value: none |
DataCollectionStreamName |
Exact DCR input-stream name, not the destination table name. Required for AzureMonitor. Default value: none |
ScrapeFrequencyInSecs |
Recurring time interval in seconds in which to collect and transport metrics. Example: 600 Not required Default value: 300 |
MetricsEndpointsCSV |
Comma-separated list (without spaces) of endpoints to collect Prometheus metrics from. All module endpoints to collect metrics from must appear in this list. Example: http://edgeAgent:9600/metrics,http://edgeHub:9600/metrics,http://MetricsSpewer:9417/metrics Not required Default value: http://edgeHub:9600/metrics,http://edgeAgent:9600/metrics |
AllowedMetrics |
List of metrics to collect, all other metrics are ignored. Set to an empty string to disable. For more information, see Allow and block lists. Example: metricToScrape{quantile="0.99"}[http://MetricsSpewer:9417/metrics] Not required Default value: empty |
BlockedMetrics |
List of metrics to ignore. Overrides AllowedMetrics, so a metric isn't reported if it's included in both lists. For more information, see Allow and block lists. Example: metricToIgnore{quantile="0.5"}[http://VeryNoisyModule:9001/metrics], docker_container_disk_write_bytes Not required Default value: empty |
CompressForUpload |
Controls compression for IotMessage. The Logs Ingestion SDK manages direct-upload compression independently. Example: true Not required Default value: true |
AzureDomain |
Selects the authentication authority and ingestion audience: azure.com, azure.us, or azure.cn (azure.com.cn is also accepted). The ingestion endpoint must match this cloud. Example: azure.us Not required Default value: azure.com |
ScrapeFrequencyInSecs must be at least 1. TransformForIoTCentral defaults to false and applies only to IotMessage. IotHubConnectFrequency defaults to one day (1.00:00:00).
For AzureMonitor, the endpoint must match the selected cloud. LogAnalyticsWorkspaceId and LogAnalyticsSharedKey aren't used by Metrics Collector 2.0.
Authentication and table configuration
Use Configure authentication to choose a certificate, managed identity, or federated identity. The identity needs Monitoring Metrics Publisher on the DCR.
The collector tries environment credentials, workload identity, and managed identity in that order. It doesn't use developer sign-ins on the host.
Use Configure the collector schema for the seven input-stream and table columns. Curated workbooks default to IoTEdgeMetrics_CL, with numeric Value, JSON-string Tags, and ordinary ResourceId. For another table with the same schema, set the workbook's MetricsTableName parameter.
For generic table, DCR, endpoint, and permission setup, use the Logs Ingestion portal tutorial.
Resource ID
The metrics-collector module needs the Azure Resource Manager ID of the IoT hub that the IoT Edge device belongs to. Enter this ID as the value for the ResourceId environment variable. The collector stores it in the ordinary ResourceId column, preserving its case. Query the workspace and apply tolower() to both the stored and selected IDs before matching. This guide uses the pass-through schema described in Resource matching and query scope.
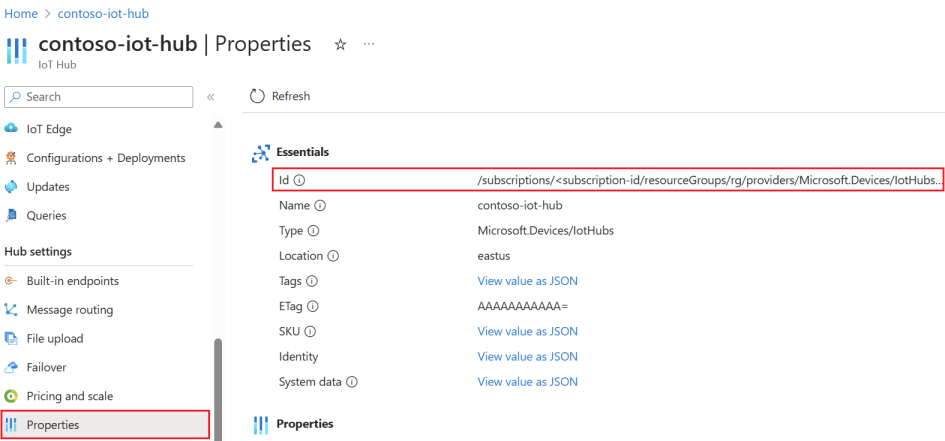
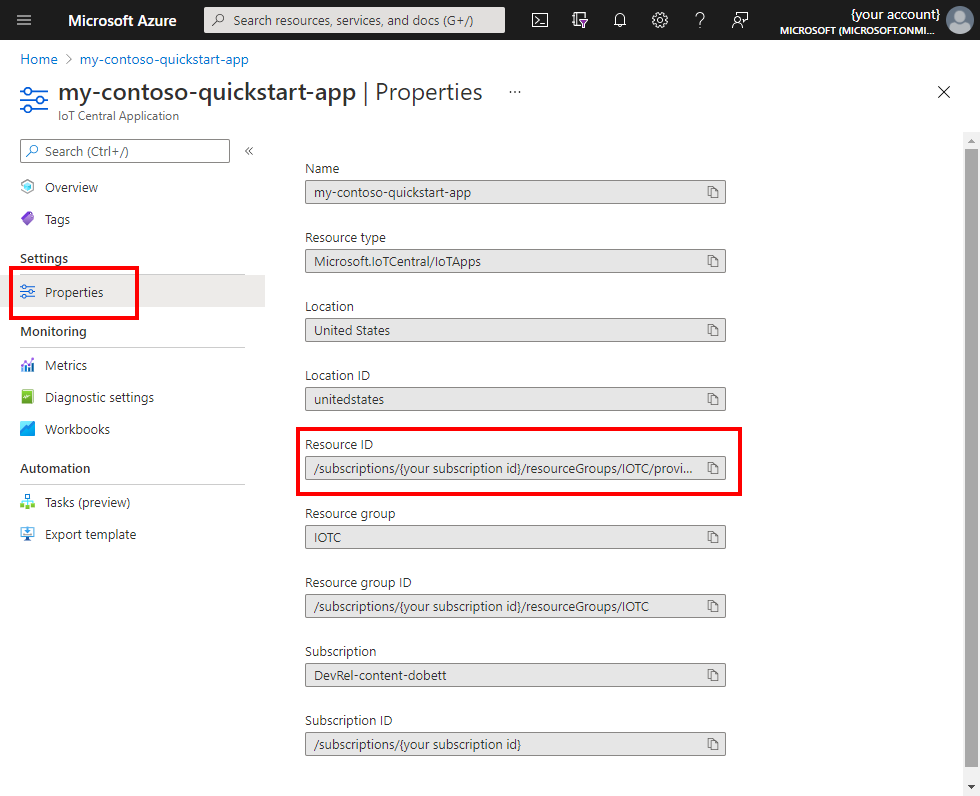
The resource ID uses the following format: /subscriptions/<subscription id>/resourceGroups/<resource group name>/providers/Microsoft.Devices/IoTHubs/<iot hub name>. You can find the resource ID in the Properties page of the IoT hub in the Azure portal.
Or, you can use the az resource show command to get the ID:
az resource show -g <resource group> -n <hub name> --resource-type "Microsoft.Devices/IoTHubs"
Upload target
The UploadTarget configuration option controls whether metrics are sent directly to Azure Monitor or to IoT Hub.
If you set UploadTarget to IotMessage, the module publishes your metrics as IoT messages. The endpoint /messages/modules/<metrics collector module name>/outputs/metricOutput emits these messages as UTF8-encoded JSON. For example, if your IoT Edge Metrics Collector module is named IoTEdgeMetricsCollector, the endpoint is /messages/modules/IoTEdgeMetricsCollector/outputs/metricOutput. The uncompressed message format is as follows:
[{
    "TimeGeneratedUtc": "<time generated>",
    "Name": "<prometheus metric name>",
    "Value": 1.0,
    "Labels": {
        "<label name>": "<label value>"
    }
}, {
    "TimeGeneratedUtc": "2020-07-28T20:00:43.2770247Z",
    "Name": "docker_container_disk_write_bytes",
    "Value": 0.0,
    "Labels": {
        "name": "AzureMonitorForIotEdgeModule"
    }
}]
Allow and block lists
The AllowedMetrics and BlockedMetrics configuration options accept space- or comma-separated lists of metric selectors. A metric matches the list and is included or excluded if it matches one or more metrics in either list.
Metric selectors use a format similar to a subset of the PromQL query language.
metricToSelect{quantile="0.5",otherLabel=~"(Re[ge]*|x)"}[http://VeryNoisyModule:9001/metrics]
Metric selectors consist of three parts:
Metric name (metricToSelect).
- You can use wildcards
*(any characters) and?(any single character) in metric names. For example,*CPUmatchesmaxCPUandminCPUbut notCPUMaximum.???CPUmatchesmaxCPUandminCPUbut notmaximumCPU. - This component is required in a metrics selector.
Label-based selectors ({quantile="0.5",otherLabel=~"(Re[ge]*|x)"}).
- Include multiple metric values in the curly brackets. Separate the label expressions with commas and enclose each value in double quotes.
- A metric is matched if at least all labels in the selector are present and also match.
- Like PromQL, the following matching operators are allowed.
=Match labels exactly equal to the provided string (case sensitive).!=Match labels not exactly equal to the provided string.=~Match labels to a provided regex. ex:label=~"(CPU|Mem|[0-9]*)"!~Match labels that don't fit a provided regex.- The collector adds
^and$to the regex. Group alternatives in parentheses to match the entire value. - This component is optional in a metrics selector.
Endpoint selector ([http://VeryNoisyModule:9001/metrics]).
- The URL should exactly match a URL listed in
MetricsEndpointsCSV. - This component is optional in a metrics selector.
A metric must match all parts of a given selector to be selected. It must match the name and have all the same labels with matching values and come from the given endpoint. For example, mem{quantile="0.5",otherLabel="foobar"}[http://VeryNoisyModule:9001/metrics] doesn't match the selector mem{quantile="0.5",otherLabel=~"foo"}[http://VeryNoisyModule:9001/metrics]. Use multiple selectors to create OR-like behavior instead of AND-like behavior.
For example, to allow the custom metric mem with any label from a module module1 but only allow the same metric from module2 with the label agg=p99, add the following selector to AllowedMetrics:
mem{}[http://module1:9001/metrics] mem{agg="p99"}[http://module2:9001/metrics]
Or, to allow the custom metrics mem and cpu for any labels or endpoint, add the following to AllowedMetrics:
mem cpu
Enable in restricted network access scenarios
For direct upload, allow outbound HTTPS access to the configured logs-ingestion endpoint. Allow the identity endpoints required by your authentication method.
Use Azure Monitor endpoint guidance for DCR, DCE, and private network requirements. The legacy workspace ods.opinsights and oms.opinsights endpoints don't replace these requirements.
Proxy considerations
The metrics-collector module is written in .NET Core. Use the same guidance as for system modules to allow communication through a proxy server.
Metrics collection from local modules uses the http protocol. Exclude local communication from going through the proxy server by setting the NO_PROXY environment variable. Set NO_PROXY value to a comma-separated list of hostnames that should be excluded. Use module names for hostnames. For example: edgeHub,edgeAgent,myCustomModule.
Route metrics
Sometimes you need to ingest metrics through IoT Hub instead of sending them directly to Log Analytics. For example, when monitoring IoT Edge devices in a nested configuration where child devices have access only to the IoT Edge hub of their parent device. Another example is deploying an IoT Edge device with outbound network access only to IoT Hub.
To enable monitoring in this scenario, configure the metrics-collector module to send metrics as device-to-cloud (D2C) messages via the edgeHub module. Turn on the capability by setting the UploadTarget environment variable to IotMessage in the collector configuration.
Tip
Remember to add an edgeHub route to deliver metrics messages from the collector module to IoT Hub. The route looks like FROM /messages/modules/replace-with-collector-module-name/* INTO $upstream.
This option requires extra setup, a cloud workflow setup, to deliver metrics messages arriving at IoT Hub to the Log Analytics workspace. Without this setup, the other portions of the integration such as curated visualizations and alerts don't work.
Note
Be aware of extra costs with this option. Metrics messages count against your IoT Hub message quota. You're also charged for Log Analytics ingestion and cloud workflow resources.
Next steps
Explore the types of curated visualizations that Azure Monitor provides.