Note
Access to this page requires authorization. You can try signing in or changing directories.
Access to this page requires authorization. You can try changing directories.
This article describes how to monitor machines replicated by Azure Site Recovery, using Azure Monitor Logs and Log Analytics.
Azure Monitor Logs provides a log data platform that collects activity and resource logs, along with other monitoring data. Within Azure Monitor Logs, you use Log Analytics to write and test log queries and interactively analyze log data. You can visualize and query log results, and configure alerts to take actions based on monitored data.
For Site Recovery, use Azure Monitor Logs to help you do the following:
- Monitor Site Recovery health and status. For example, you can monitor replication health, test failover status, Site Recovery events, recovery point objectives (RPOs) for protected machines, and disk/data change rates.
- Set up alerts for Site Recovery. For example, you can configure alerts for machine health, test failover status, or Site Recovery job status.
Azure Monitor Logs support using with Site Recovery for Azure to Azure replication and VMware virtual machine/physical server to Azure replication.
Note
To get the churn data logs and upload rate logs for VMware and physical machines, you need to install a Azure monitoring agent on the Process Server. This agent sends the logs of the replicating machines to the workspace. This capability is available only for the 9.30 mobility agent version onwards.
Prerequisites
Here's what you need:
- At least one machine protected in a Recovery Services vault.
- A Log Analytics workspace to store Site Recovery logs. Learn about setting up a workspace.
- A basic understanding of how to write, run, and analyze log queries in Log Analytics. Learn more.
Review common monitoring questions before you start.
Configure Site Recovery to send logs
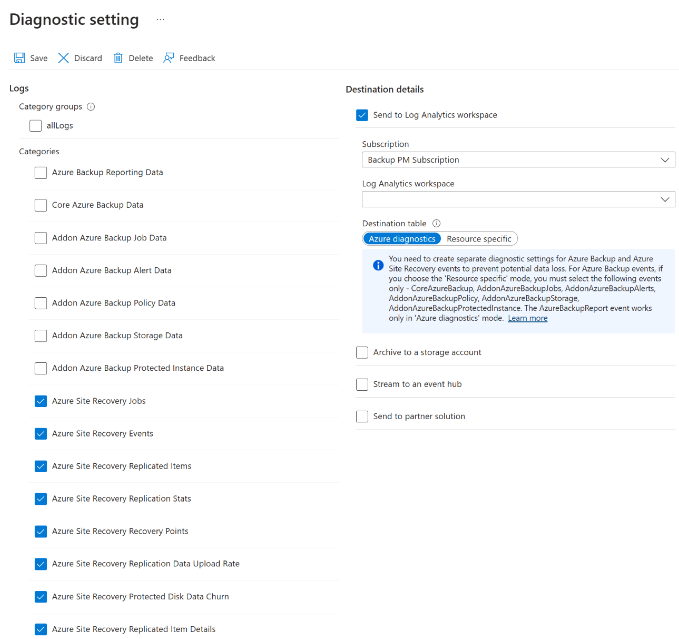
In the vault, select Diagnostic settings > Add diagnostic setting.
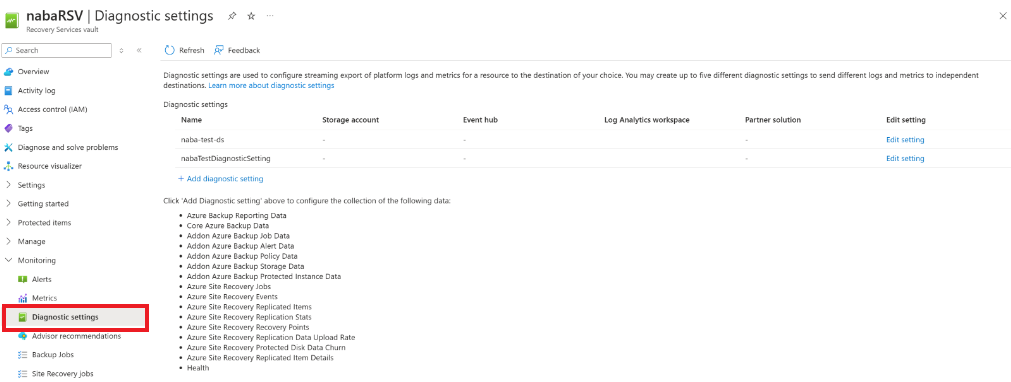
In Diagnostic settings, enter a name, and check the box Send to Log Analytics.
Select the Azure Monitor Logs subscription and the Log Analytics workspace.
Select Azure Diagnostics in the toggle.
From the log list, select all the logs with the prefix AzureSiteRecovery. Then select OK.
The Site Recovery logs start to feed into a table (AzureDiagnostics) in the selected workspace.
Configure Azure monitoring agent on the Process Server to send churn and upload rate logs
You can capture the data churn rate information and source data upload rate information for your VMware and physical machines at on-premises. To enable this feature, install a Microsoft monitoring agent on the Process Server.
Go to the Log Analytics workspace and select Advanced Settings.
Select Connected Sources and then select Windows Servers.
Download the Windows Agent (64-bit) on the Process Server.
Complete the agent installation by providing the obtained workspace ID and key.
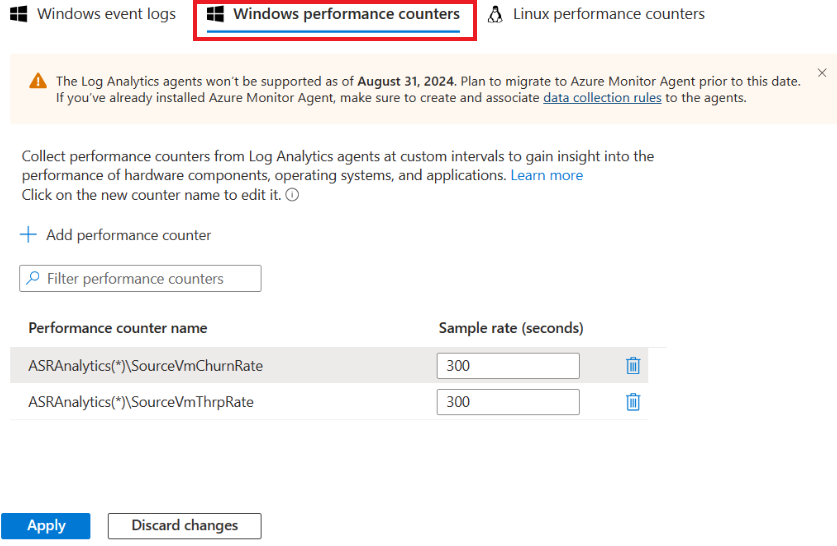
After the installation finishes, go to Log Analytics workspace and select Legacy agents management. Go to the Data page and select Windows Performance Counters.
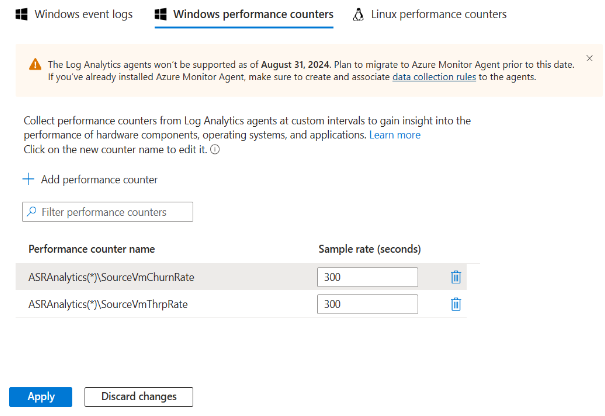
Select '+' to add the following two counters with a sample interval of 300 seconds:
- ASRAnalytics(*)\SourceVmChurnRate
- ASRAnalytics(*)\SourceVmThrpRate
The churn and upload rate data starts feeding into the workspace.
The following Site Recovery counters aren't searchable currently:
- ASRAnalytics(*)\SourceVmChurnRate
- ASRAnalytics(*)\SourceVmThrpRate
However, you can add them by pasting the names in full.
Note
Currently, you can't search for these counters. However, you can add them by copying and pasting their full names.
- SourceVmThrpRate shows the network throughput rate on the source.
- SourceVmChurnRate shows the data change rate on the disk at the source virtual machine.
Query the logs - examples
You retrieve data from logs using log queries written with the Kusto query language. This section provides a few examples of common queries you might use for Site Recovery monitoring.
Note
Some of the examples use replicationProviderName_s set to A2A. This value retrieves Azure virtual machines that are replicated to a secondary Azure region using Site Recovery. In these examples, you can replace A2A with InMageRcm if you want to retrieve on-premises VMware virtual machines or physical servers that are replicated to Azure using Site Recovery.
Query replication health
This query creates a pie chart for the current replication health of all protected Azure virtual machines. The chart breaks down the health into three states: Normal, Warning, or Critical.
AzureDiagnostics
| where replicationProviderName_s == "A2A"
| where isnotempty(name_s) and isnotnull(name_s)
| summarize hint.strategy=partitioned arg_max(TimeGenerated, *) by name_s
| project name_s , replicationHealth_s
| summarize count() by replicationHealth_s
| render piechart
Query Mobility service version
This query creates a pie chart for Azure virtual machines replicated with Site Recovery. The chart breaks down the virtual machines by the version of the Mobility agent that they're running.
AzureDiagnostics
| where replicationProviderName_s == "A2A"
| where isnotempty(name_s) and isnotnull(name_s)
| summarize hint.strategy=partitioned arg_max(TimeGenerated, *) by name_s
| project name_s , agentVersion_s
| summarize count() by agentVersion_s
| render piechart
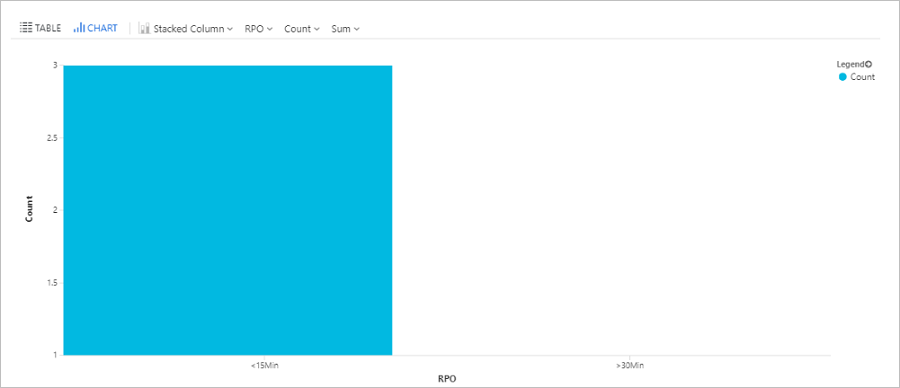
Query RPO time
This query creates a bar chart of Azure virtual machines replicated with Site Recovery. The chart breaks down the virtual machines by recovery point objective (RPO): Less than 15 minutes, between 15-30 minutes, more than 30 minutes.
AzureDiagnostics
| where replicationProviderName_s == "A2A"
| where isnotempty(name_s) and isnotnull(name_s)
| extend RPO = case(rpoInSeconds_d <= 900, "<15Min",
rpoInSeconds_d <= 1800, "15-30Min", ">30Min")
| summarize hint.strategy=partitioned arg_max(TimeGenerated, *) by name_s
| project name_s , RPO
| summarize Count = count() by RPO
| render barchart
Query Site Recovery jobs
This query retrieves all Site Recovery jobs (for all disaster recovery scenarios) that are triggered in the last 72 hours, and their completion state.
AzureDiagnostics
| where Category == "AzureSiteRecoveryJobs"
| where TimeGenerated >= ago(72h)
| project JobName = OperationName , VaultName = Resource , TargetName = affectedResourceName_s, State = ResultType
Query Site Recovery events
This query retrieves all Site Recovery events for all disaster recovery scenarios that the system raised in the last 72 hours, along with their severity.
AzureDiagnostics
| where Category == "AzureSiteRecoveryEvents"
| where TimeGenerated >= ago(72h)
| project AffectedObject=affectedResourceName_s , VaultName = Resource, Description_s = healthErrors_s , Severity = Level
Query test failover state (pie chart)
This query plots a pie chart for the test failover status of Azure virtual machines replicated with Site Recovery.
AzureDiagnostics
| where replicationProviderName_s == "A2A"
| where isnotempty(name_s) and isnotnull(name_s)
| where isnotempty(failoverHealth_s) and isnotnull(failoverHealth_s)
| summarize hint.strategy=partitioned arg_max(TimeGenerated, *) by name_s
| project name_s , Resource, failoverHealth_s
| summarize count() by failoverHealth_s
| render piechart
Query test failover state (table)
This query plots a table for the test failover status of Azure virtual machines replicated with Site Recovery.
AzureDiagnostics
| where replicationProviderName_s == "A2A"
| where isnotempty(name_s) and isnotnull(name_s)
| where isnotempty(failoverHealth_s) and isnotnull(failoverHealth_s)
| summarize hint.strategy=partitioned arg_max(TimeGenerated, *) by name_s
| project VirtualMachine = name_s , VaultName = Resource , TestFailoverStatus = failoverHealth_s
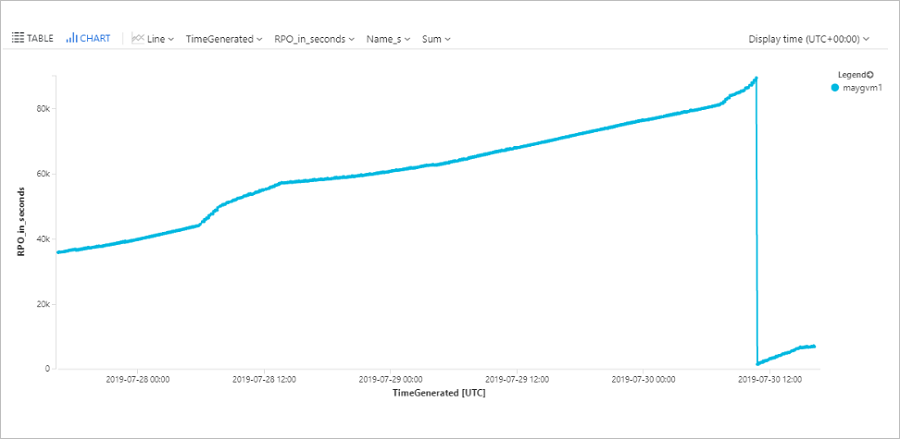
Query machine RPO
This query plots a trend graph that tracks the RPO of a specific Azure virtual machine (ContosoVM123) for the last 72 hours.
AzureDiagnostics
| where replicationProviderName_s == "A2A"
| where TimeGenerated > ago(72h)
| where isnotempty(name_s) and isnotnull(name_s)
| where name_s == "ContosoVM123"
| project TimeGenerated, name_s , RPO_in_seconds = rpoInSeconds_d
| render timechart
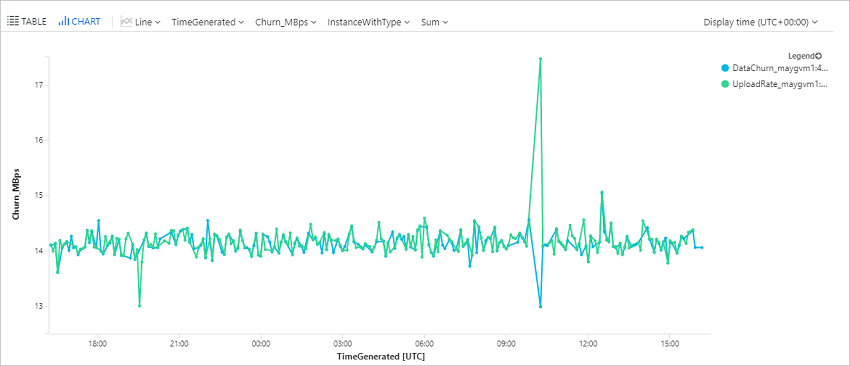
Query data change rate (churn) and upload rate for an Azure virtual machine
This query plots a trend graph for a specific Azure virtual machine (ContosoVM123) that represents the data change rate (Write Bytes per Second) and data upload rate.
AzureDiagnostics
| where Category in ("AzureSiteRecoveryProtectedDiskDataChurn", "AzureSiteRecoveryReplicationDataUploadRate")
| extend CategoryS = case(Category contains "Churn", "DataChurn",
Category contains "Upload", "UploadRate", "none")
| extend InstanceWithType=strcat(CategoryS, "_", InstanceName_s)
| where TimeGenerated > ago(24h)
| where InstanceName_s startswith "ContosoVM123"
| project TimeGenerated , InstanceWithType , Churn_MBps = todouble(Value_s)/1048576
| render timechart
Query data change rate (churn) and upload rate for a VMware or physical machine
Note
Ensure you set up the monitoring agent on the Process Server to fetch these logs. Refer steps to configure monitoring agent.
This query plots a trend graph for a specific disk, disk0, of a replicated item, win-9r7sfh9qlru, which represents the data change rate (Write Bytes per Second) and data upload rate. You can find the disk name on the Disks blade of the replicated item in the recovery services vault. The instance name to use in the query is the DNS name of the machine followed by _ and the disk name as in this example.
Perf
| where ObjectName == "ASRAnalytics"
| where InstanceName contains "win-9r7sfh9qlru_disk0"
| where TimeGenerated >= ago(4h)
| project TimeGenerated ,CounterName, Churn_MBps = todouble(CounterValue)/5242880
| render timechart
Process Server pushes this data every five minutes to the Log Analytics workspace. These data points represent the average computed for five minutes.
Query disaster recovery summary (Azure to Azure)
This query plots a summary table for Azure virtual machines replicated to a secondary Azure region. It shows the virtual machine name, replication, and protection status, RPO, test failover status, Mobility agent version, any active replication errors, and the source location.
AzureDiagnostics
| where replicationProviderName_s == "A2A"
| where isnotempty(name_s) and isnotnull(name_s)
| summarize hint.strategy=partitioned arg_max(TimeGenerated, *) by name_s
| project VirtualMachine = name_s , Vault = Resource , ReplicationHealth = replicationHealth_s, Status = protectionState_s, RPO_in_seconds = rpoInSeconds_d, TestFailoverStatus = failoverHealth_s, AgentVersion = agentVersion_s, ReplicationError = replicationHealthErrors_s, SourceLocation = primaryFabricName_s
Query disaster recovery summary (VMware/physical servers)
This query plots a summary table for VMware virtual machines and physical servers replicated to Azure. It shows the machine name, replication and protection status, RPO, test failover status, Mobility agent version, any active replication errors, and the relevant process server.
AzureDiagnostics
| where replicationProviderName_s == "InMageRcm"
| where isnotempty(name_s) and isnotnull(name_s)
| summarize hint.strategy=partitioned arg_max(TimeGenerated, *) by name_s
| project VirtualMachine = name_s , Vault = Resource , ReplicationHealth = replicationHealth_s, Status = protectionState_s, RPO_in_seconds = rpoInSeconds_d, TestFailoverStatus = failoverHealth_s, AgentVersion = agentVersion_s, ReplicationError = replicationHealthErrors_s, ProcessServer = processServerName_g
Set up alerts - examples
You can set up Site Recovery alerts based on Azure Monitor data. Learn more about setting up log alerts.
Note
Some of the examples use replicationProviderName_s set to A2A. This value sets alerts for Azure virtual machines that are replicated to a secondary Azure region. In these examples, you can replace A2A with InMageRcm if you want to set alerts for on-premises VMware virtual machines or physical servers replicated to Azure.
Multiple machines in a critical state
Set up an alert if more than 20 replicated Azure virtual machines go into a Critical state.
AzureDiagnostics
| where replicationProviderName_s == "A2A"
| where replicationHealth_s == "Critical"
| where isnotempty(name_s) and isnotnull(name_s)
| summarize hint.strategy=partitioned arg_max(TimeGenerated, *) by name_s
| summarize count()
For the alert, set Threshold value to 20.
Single machine in a critical state
Set up an alert if a specific replicated Azure virtual machine goes into a Critical state.
AzureDiagnostics
| where replicationProviderName_s == "A2A"
| where replicationHealth_s == "Critical"
| where name_s == "ContosoVM123"
| where isnotempty(name_s) and isnotnull(name_s)
| summarize hint.strategy=partitioned arg_max(TimeGenerated, *) by name_s
| summarize count()
For the alert, set Threshold value to 1.
Multiple machines exceed RPO
Set up an alert if the RPO for more than 20 Azure virtual machines exceeds 30 minutes.
AzureDiagnostics
| where replicationProviderName_s == "A2A"
| where isnotempty(name_s) and isnotnull(name_s)
| where rpoInSeconds_d > 1800
| summarize hint.strategy=partitioned arg_max(TimeGenerated, *) by name_s
| project name_s , rpoInSeconds_d
| summarize count()
For the alert, set Threshold value to 20.
Single machine exceeds RPO
Set up an alert if the RPO for a single Azure virtual machine exceeds 30 minutes.
AzureDiagnostics
| where replicationProviderName_s == "A2A"
| where isnotempty(name_s) and isnotnull(name_s)
| where name_s == "ContosoVM123"
| where rpoInSeconds_d > 1800
| summarize hint.strategy=partitioned arg_max(TimeGenerated, *) by name_s
| project name_s , rpoInSeconds_d
| summarize count()
For the alert, set Threshold value to 1.
Test failover for multiple machines exceeds 90 days
Set up an alert if the last successful test failover was more than 90 days, for more than 20 virtual machines.
AzureDiagnostics
| where replicationProviderName_s == "A2A"
| where Category == "AzureSiteRecoveryReplicatedItems"
| where isnotempty(name_s) and isnotnull(name_s)
| where lastSuccessfulTestFailoverTime_t <= ago(90d)
| summarize hint.strategy=partitioned arg_max(TimeGenerated, *) by name_s
| summarize count()
For the alert, set Threshold value to 20.
Test failover for a single machine exceeds 90 days
Set up an alert if the last successful test failover for a specific virtual machine was more than 90 days ago.
AzureDiagnostics
| where replicationProviderName_s == "A2A"
| where Category == "AzureSiteRecoveryReplicatedItems"
| where isnotempty(name_s) and isnotnull(name_s)
| where lastSuccessfulTestFailoverTime_t <= ago(90d)
| where name_s == "ContosoVM123"
| summarize hint.strategy=partitioned arg_max(TimeGenerated, *) by name_s
| summarize count()
For the alert, set Threshold value to 1.
Site Recovery job fails
Set up an alert if a Site Recovery job (in this case the Reprotect job) fails for any Site Recovery scenario, during the last day.
AzureDiagnostics
| where Category == "AzureSiteRecoveryJobs"
| where OperationName == "Reprotect"
| where ResultType == "Failed"
| summarize count()
For the alert, set Threshold value to 1, and Period to 1,440 minutes, to check failures in the last day.
Next steps
Learn about inbuilt Site Recovery monitoring.