重要
自 2027 年 3 月 31 日起,Azure Monitor 不再支持使用 sidecar 的 Prometheus 指标远程写入方案来将指标发送到 Azure Monitor 工作区。 将自托管 Prometheus 或 Prometheus Operator 配置为远程直接写入 Azure Monitor 工作区,而无需使用 sidecar。 有关指导,请参阅 将自管的 Prometheus 连接到 Azure Monitor 的托管 Prometheus 服务。
本文介绍如何设置 remote write,以便使用托管标识身份验证和 Azure Monitor 提供的 "sidecar" 容器,从运行在 Azure Kubernetes 服务 (AKS) 群集或启用了 Azure Arc 的 Kubernetes 群集的自行管理 Prometheus 服务器发送数据。 可以使用 AKS 创建的现有标识,也可以创建自己的标识。 此处对这两个选项均有介绍。
注意
配置在 Kubernetes 集群上运行的 Prometheus,以直接远程写入到 Azure Monitor 工作区。 若要了解详细信息,请参阅使用用户分配的托管标识将 Prometheus 数据发送到 Azure Monitor。 2027 年 3 月 31 日之后,将不再支持 Prometheus 远程写入 sidecar。
群集配置
本文适用于以下群集配置:
- Azure Kubernetes 服务群集
- 已启用 Azure Arc 的 Kubernetes 群集
先决条件
支持的版本
托管身份验证需要 Prometheus 版本大于 v2.45。
- 用户分配的托管身份验证需要使用 v2.45 以上的 Prometheus 版本。
- Microsoft Entra ID 应用程序身份验证需要高于 v2.48 的 Prometheus 版本。
- Prometheus 版本必须为 v3.50 或更高,以满足系统分配的托管标识身份验证要求。
Azure Monitor 工作区
本文介绍如何将 Prometheus 指标发送到 Azure Monitor 工作区。 若要创建 Azure Monitor 工作区,请参阅管理 Azure Monitor 工作区。
权限
完成本文中的步骤需要群集或资源的管理员权限。
为托管标识设置应用程序
使用托管标识身份验证为应用程序设置 Prometheus 远程写入的过程涉及到以下任务的完成:
- 获取群集节点资源组的名称。
- 获取用户分配的托管身份的客户端 ID。
- 为工作区数据收集规则中的托管标识分配“监视指标发布者”角色。
- 授予群集对托管标识的访问权限。
- 部署挎斗容器以设置远程写入。
以下部分描述了这些任务。
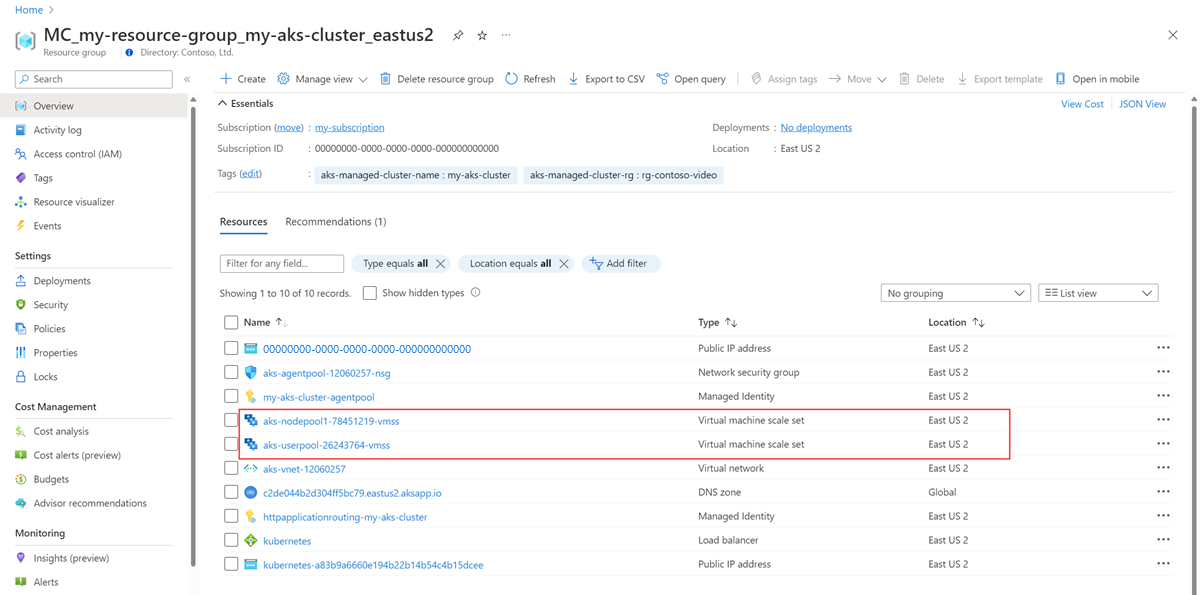
获取群集节点资源组的名称
群集的节点资源组包含在此过程中其他步骤中使用的资源。 此资源组名为 MC_<RESOURCE-GROUP>_<CLUSTER-NAME>_<REGION>。 可以使用 Azure 门户中的“资源组”菜单找到资源组名称。

获取用户分配托管标识的客户端 ID
需要获取你将要使用的身份的客户端 ID。 复制客户端 ID,以便稍后在进程中使用。
可以使用 AKS 创建的标识之一,而不用创建自己的客户端 ID。 若要详细了解标识,请参阅在 Azure Kubernetes 服务中使用托管标识。
本文使用 kubelet 标识。 此标识的名称是 <CLUSTER-NAME>-agentpool,它位于群集的节点资源组中。

选择 <CLUSTER-NAME>-agentpool 托管标识。 在“概述”页上,复制客户端 ID 的值。 有关详细信息,请参阅管理用户分配的托管标识。

将“监视指标发布者”角色分配给工作区数据收集规则中的托管标识
托管标识必须在与 Azure Monitor 工作区关联的数据收集规则上分配“监视指标发布者”角色。
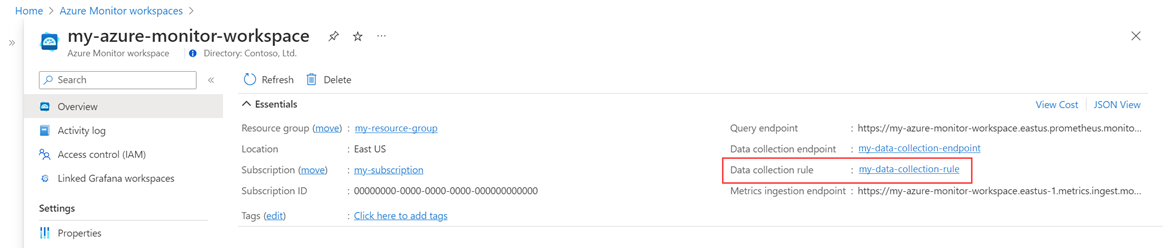
在 Azure Monitor 工作区的资源菜单上,选择“概述”。 对于数据收集规则,请选择该链接。
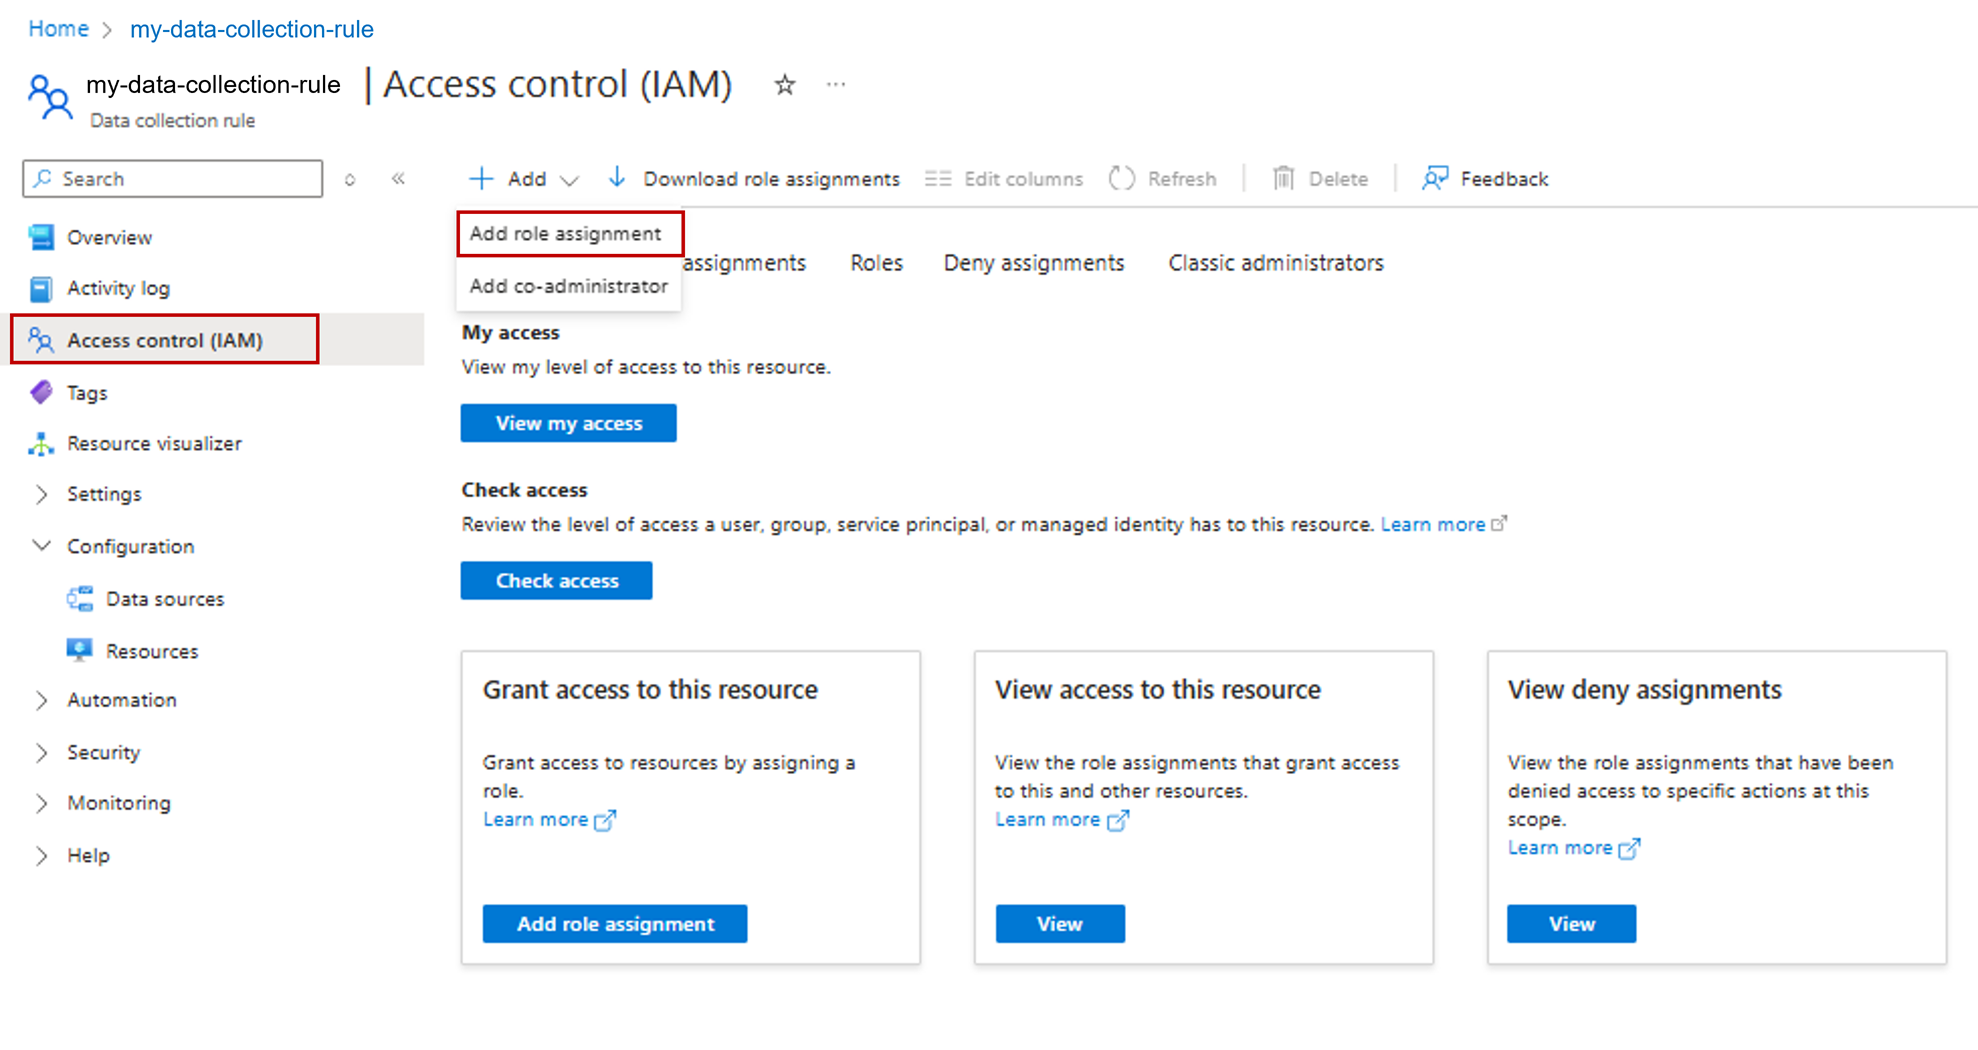
在数据收集规则的资源菜单上,选择“访问控制(IAM)”。
依次选择『添加』,然后选择『添加角色分配』。
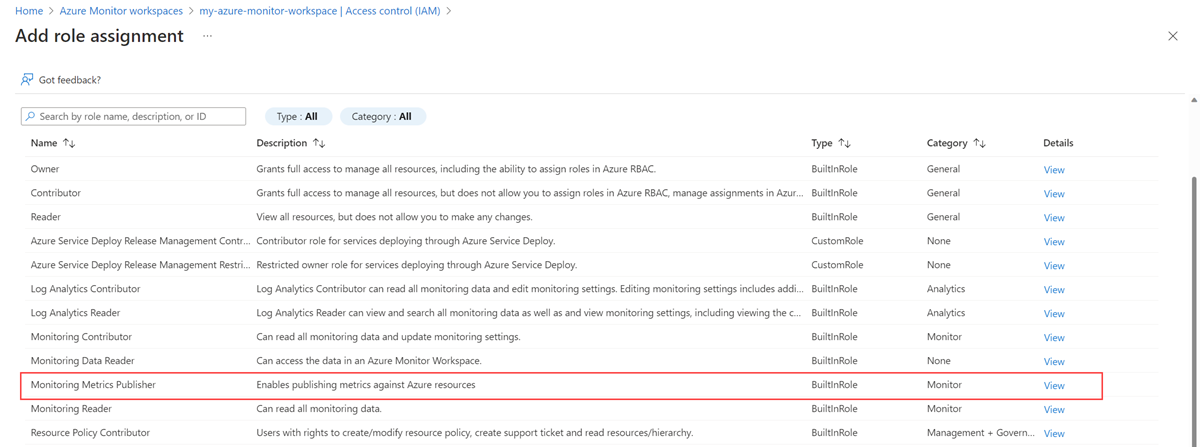
选择“监视指标发布者”角色,然后选择“下一步”。
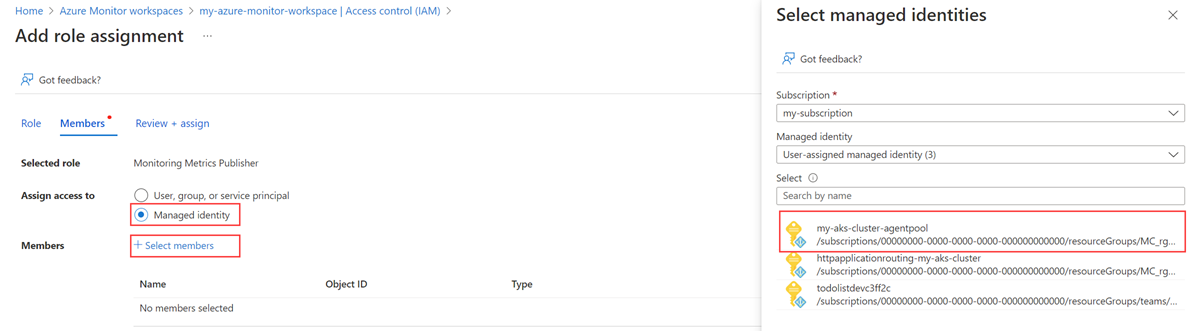
选择托管标识,然后选择选择成员。 选择包含用户分配的标识的订阅,然后选择“用户分配的托管标识”。 选择要使用的用户分配的标识,然后选择“选择”。
若要完成角色分配,请选择“查看 + 分配”。


授予 AKS 群集对托管标识的访问权限
如果使用 AKS 标识,则不需要此步骤。 AKS 标识已有访问群集的权限。
重要
要完成本部分中的步骤,须有对群集的所有者或用户访问管理员权限。
确定群集 节点资源组 中的虚拟机规模集。
在 Azure CLI 中对每个虚拟机规模集运行以下命令:
az vmss identity assign -g <NODE-RESOURCE-GROUP> -n <VMSS-NAME> --identities <USER-ASSIGNED-IDENTITY-RESOURCE-ID>

部署旁车容器以设置远程写入
复制以下 YAML 并将其保存到文件中。 YAML 使用端口 8081 作为侦听端口。 如果使用其他端口,请修改 YAML 中的该端口。
prometheus:
  prometheusSpec:
    externalLabels:
          cluster: <AKS-CLUSTER-NAME>

    ## https://prometheus.io/docs/prometheus/latest/configuration/configuration/#remote_write
    remoteWrite:
    - url: 'http://localhost:8081/api/v1/write'
  ## Azure Managed Prometheus currently exports some default mixins in Grafana.
  ## These mixins are compatible with Azure Monitor agent on your Azure Kubernetes Service cluster.
  ## However, these mixins aren't compatible with Prometheus metrics scraped by the Kube Prometheus stack.
  ## In order to make these mixins compatible, uncomment remote write relabel configuration below:

  ## writeRelabelConfigs:
  ##   - sourceLabels: [metrics_path]
  ##     regex: /metrics/cadvisor
  ##     targetLabel: job
  ##     replacement: cadvisor
  ##     action: replace
  ##   - sourceLabels: [job]
  ##     regex: 'node-exporter'
  ##     targetLabel: job
  ##     replacement: node
  ##     action: replace
    containers:
    - name: prom-remotewrite
      image: <CONTAINER-IMAGE-VERSION>
      imagePullPolicy: Always
      ports:
        - name: rw-port
          containerPort: 8081
      livenessProbe:
        httpGet:
          path: /health
          port: rw-port
        initialDelaySeconds: 10
        timeoutSeconds: 10
      readinessProbe:
        httpGet:
          path: /ready
          port: rw-port
        initialDelaySeconds: 10
        timeoutSeconds: 10
      env:
      - name: INGESTION_URL
        value: <INGESTION_URL>
      - name: LISTENING_PORT
        value: '8081'
      - name: IDENTITY_TYPE
        value: userAssigned
      - name: AZURE_CLIENT_ID
        value: <MANAGED-IDENTITY-CLIENT-ID>
      # Optional parameter
      - name: CLUSTER
        value: <CLUSTER-NAME>
      # Required for non-public clouds.
      # Supported CLOUD values: AZUREPUBLIC (default), AZUREGOVERNMENT, AZURECHINA, AZURECUSTOM.
      # For Azure Government, uncomment CLOUD and INGESTION_AAD_AUDIENCE.
      # - name: CLOUD
      #   value: AZUREGOVERNMENT
      # - name: INGESTION_AAD_AUDIENCE
      #   value: https://monitor.azure.us/.default
      # For other sovereign or custom clouds, use AZURECUSTOM and also set AAD_HOST_ENDPOINT.
      # - name: CLOUD
      #   value: AZURECUSTOM
      # - name: AAD_HOST_ENDPOINT
      #   value: <authority-host-url-for-your-cloud>
      # - name: INGESTION_AAD_AUDIENCE
      #   value: <audience-url-for-your-cloud>/.default
替换 YAML 中的以下值:
值 说明 <AKS-CLUSTER-NAME>AKS 群集的名称。 <CONTAINER-IMAGE-VERSION>mcr.microsoft.com/azuremonitor/containerinsights/ciprod/prometheus-remote-write/images:prom-remotewrite-20260414.1
远程写入容器映像版本。<INGESTION-URL>Azure Monitor 工作区的“概述”页中“指标引入终结点”的值。 <MANAGED-IDENTITY-CLIENT-ID>托管标识的概述页中的 客户端 ID 的值为。 <CLUSTER-NAME>运行 Prometheus 的群集的名称。
重要
对于由世纪互联云运营的 Microsoft Azure,请在 YAML 文件的 env 部分中添加以下环境变量:
Azure china:
- name: CLOUD
  value: AZURECHINA
- name: INGESTION_AAD_AUDIENCE
  value: https://monitor.azure.cn/.default
支持CLOUD的值是AZUREPUBLIC(默认值)、AZUREGOVERNMENT和AZURECHINAAZURECUSTOM。 对于没有内置支持的主权云或自定义云,请使用 AZURECUSTOM。 当 CLOUD 设置为 AZURECUSTOM 时,还必须将 AAD_HOST_ENDPOINT 设置为云的 Microsoft Entra 颁发机构主机 URL。 该值 INGESTION_AAD_AUDIENCE 必须包含 /.default 后缀,否则令牌获取失败。
使用 Helm 将该 YAML 文件应用于 Prometheus 配置,以进行更新:
# set context to your cluster
az aks get-credentials -g <aks-rg-name> -n <aks-cluster-name>

# use Helm to update your remote write config
helm upgrade -f <YAML-FILENAME>.yml prometheus prometheus-community/kube-prometheus-stack --namespace <namespace where Prometheus pod resides>
验证和故障排除
有关验证和故障排除信息,请参阅 Prometheus 远程写入的 Azure Monitor 托管服务。
后续步骤
- 从 AKS 群集收集 Prometheus 指标
- 详细了解适用于 Prometheus 的 Azure Monitor 托管服务
- 在适用于 Prometheus 的 Azure Monitor 托管服务中远程写入
- 使用 Microsoft Entra 身份验证将 Prometheus 数据发送到 Azure Monitor
- 使用 Microsoft Entra 工作负载 ID(预览版)进行身份验证,将 Prometheus 数据发送到 Azure Monitor
- 使用 Microsoft Entra Pod 托管标识(预览版)身份验证将 Prometheus 数据传送至 Azure Monitor
验证远程写入是否正常工作
使用以下方法验证 Prometheus 数据是否正在发送到 Azure Monitor 工作区。
Kubectl 命令
使用以下命令查看挎斗容器中的日志。 如果 avgBytesPerRequest 和 avgRequestDuration 的输出值为非零,则说明远程写入数据在传输中。
kubectl logs <Prometheus-Pod-Name> <Azure-Monitor-Side-Car-Container-Name> --namespace <namespace-where-Prometheus-is-running>
# example: kubectl logs prometheus-prometheus-kube-prometheus-prometheus-0 prom-remotewrite --namespace monitoring
此命令的输出具有以下格式:
time="2022-11-02T21:32:59Z" level=info msg="Metric packets published in last 1 minute" avgBytesPerRequest=19713 avgRequestDurationInSec=0.023 failedPublishing=0 successfullyPublished=122
使用 PromQL 的 Azure Monitor 性能指标浏览器
若要检查指标是否流向 Azure Monitor 工作区,请在 Azure 门户中的 Azure Monitor 工作区中选择“指标”。 使用指标资源管理器查询你期望从自托管 Prometheus 环境中获得的指标。 有关详细信息,请参阅指标浏览器。
Azure Monitor 工作区中的 Prometheus 探索器
Prometheus 资源管理器提供了在 Azure 环境中与 Prometheus 指标交互的便捷方法,使监视和故障排除更高效。 若要使用 Prometheus 资源管理器,请转到 Azure 门户中的 Azure Monitor 工作区,然后选择“Prometheus 资源管理器”以查询你期望从自托管 Prometheus 环境中获得的指标。 有关详细信息,请参阅 Prometheus 浏览器。
Grafana
在 Grafana 中使用 PromQL 查询,并验证结果是否返回预期数据。 若要详细了解如何配置适用于 Prometheus 的 Azure 托管服务的 Grafana,请参阅使用托管系统标识将适用于 Prometheus 的 Azure Monitor 托管服务用作 Grafana 的数据源