本教程介绍如何使用 Jupyter Notebook 生成适用于 Azure HDInsight 的 Apache Spark 机器学习应用程序。
MLlib 是 Spark 的自适应机器学习库,由常见的学习算法和实用工具组成。 (分类、回归、群集、协作筛选,以及维数约简。另外,还有底层优化基元。)
在本教程中,你将了解如何执行以下操作:
- 开发 Apache Spark 机器学习应用程序
先决条件
HDInsight 上的 Apache Spark 群集。 请参阅创建 Apache Spark 群集。
熟悉 Jupyter Notebook 和 Spark on HDInsight 的结合使用。 有关详细信息,请参阅使用 Apache Spark on HDInsight 加载数据并运行查询。
了解数据集
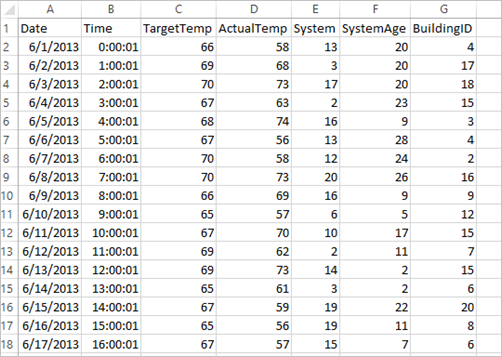
应用程序使用所有群集默认提供的示例 HVAC.csv 数据。 该文件位于 \HdiSamples\HdiSamples\SensorSampleData\hvac。 数据显示了安装有 HVAC 系统的一些建筑物的目标温度和实际温度。 System 列代表系统 ID,SystemAge 列代表建筑物安装 HVAC 系统的年数。 在指定系统 ID 和系统年数的情况下,可以预测建筑物的温度比目标温度高还是低。
使用 Spark MLlib 开发 Spark 机器学习应用程序
此应用程序使用 Spark ML 管道来执行文档分类。 ML 管道提供建立在数据帧基础之上的统一的一组高级 API。 数据帧可帮助用户创建和优化实用的机器学习管道。 在管道中,可将文档分割成单字、将单字转换成数字特征向量,最后使用特征向量和标签创建预测模型。 按下列步骤创建应用程序。
使用 PySpark 内核创建 Jupyter Notebook。 有关说明,请参阅创建 Jupyter Notebook 文件。
导入此方案所需的类型。 将以下代码段粘贴到空白单元格中,然后按 Shift+Enter。
from pyspark.ml import Pipeline
from pyspark.ml.classification import LogisticRegression
from pyspark.ml.feature import HashingTF, Tokenizer
from pyspark.sql import Row

import os
import sys
from pyspark.sql.types import *

from pyspark.mllib.classification import LogisticRegressionWithLBFGS
from pyspark.mllib.regression import LabeledPoint
from numpy import array
加载数据 (hvac.csv),分析数据,并使用它来训练模型。
# Define a type called LabelDocument
LabeledDocument = Row("BuildingID", "SystemInfo", "label")

# Define a function that parses the raw CSV file and returns an object of type LabeledDocument
def parseDocument(line):
    values = [str(x) for x in line.split(',')]
    if (values[3] > values[2]):
        hot = 1.0
    else:
        hot = 0.0

    textValue = str(values[4]) + " " + str(values[5])

    return LabeledDocument((values[6]), textValue, hot)

# Load the raw HVAC.csv file, parse it using the function
data = sc.textFile("/HdiSamples/HdiSamples/SensorSampleData/hvac/HVAC.csv")

documents = data.filter(lambda s: "Date" not in s).map(parseDocument)
training = documents.toDF()
在此代码片段中,定义用于比较实际温度与目标温度的函数。 如果实际温度较高,则表示建筑物处于高温状态,以值 1.0 表示。 否则建筑物处于低温状态,用值 0.0 表示。
配置包括三个阶段的 Spark 机器学习管道:
tokenizer、hashingTF和lr。tokenizer = Tokenizer(inputCol="SystemInfo", outputCol="words") hashingTF = HashingTF(inputCol=tokenizer.getOutputCol(), outputCol="features") lr = LogisticRegression(maxIter=10, regParam=0.01) pipeline = Pipeline(stages=[tokenizer, hashingTF, lr])有关管道及其工作原理的详细信息,请参阅 Apache Spark 机器学习管道。
将管道拟合到培训文档中。
model = pipeline.fit(training)验证训练文档以根据应用程序的进度创建检查点。
training.show()输出类似于:
+----------+----------+-----+
|BuildingID|SystemInfo|label|
+----------+----------+-----+
|         4|     13 20|  0.0|
|        17|      3 20|  0.0|
|        18|     17 20|  1.0|
|        15|      2 23|  0.0|
|         3|      16 9|  1.0|
|         4|     13 28|  0.0|
|         2|     12 24|  0.0|
|        16|     20 26|  1.0|
|         9|      16 9|  1.0|
|        12|       6 5|  0.0|
|        15|     10 17|  1.0|
|         7|      2 11|  0.0|
|        15|      14 2|  1.0|
|         6|       3 2|  0.0|
|        20|     19 22|  0.0|
|         8|     19 11|  0.0|
|         6|      15 7|  0.0|
|        13|      12 5|  0.0|
|         4|      8 22|  0.0|
|         7|      17 5|  0.0|
+----------+----------+-----+
将输出与原始 CSV 文件进行比较。 例如,CSV 文件中第一行包含此数据:
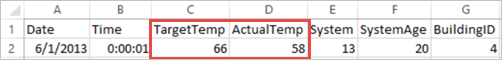
请注意,实际温度比目标温度低的情况表示建筑物处于低温状态。 第一行中的标签值为 0.0,表示建筑物温度不高 。
准备要对其运行已训练模型的数据集。 为此,需要传递系统 ID 和系统年数(在训练输出中以 SystemInfo 表示)。 模型将预测具有该系统 ID 和系统年数的建筑物温度是更高(由 1.0 表示)还是更低(由 0.0 表示)。
# SystemInfo here is a combination of system ID followed by system age
Document = Row("id", "SystemInfo")
test = sc.parallelize([("1L", "20 25"),
                ("2L", "4 15"),
                ("3L", "16 9"),
                ("4L", "9 22"),
                ("5L", "17 10"),
                ("6L", "7 22")]) \
    .map(lambda x: Document(*x)).toDF()
最后,对测试数据进行预测。
# Make predictions on test documents and print columns of interest
prediction = model.transform(test)
selected = prediction.select("SystemInfo", "prediction", "probability")
for row in selected.collect():
    print (row)
输出类似于:
Row(SystemInfo=u'20 25', prediction=1.0, probability=DenseVector([0.4999, 0.5001]))
Row(SystemInfo=u'4 15', prediction=0.0, probability=DenseVector([0.5016, 0.4984]))
Row(SystemInfo=u'16 9', prediction=1.0, probability=DenseVector([0.4785, 0.5215]))
Row(SystemInfo=u'9 22', prediction=1.0, probability=DenseVector([0.4549, 0.5451]))
Row(SystemInfo=u'17 10', prediction=1.0, probability=DenseVector([0.4925, 0.5075]))
Row(SystemInfo=u'7 22', prediction=0.0, probability=DenseVector([0.5015, 0.4985]))
观察预测结果中的第一行。 对于 ID 为 20 且系统年数为 25 年的 HVAC 系统,建筑物温度很高(预测结果=1.0)。 DenseVector (0.49999) 的第一个值对应于预测 0.0,第二个值 (0.5001) 对应于预测 1.0。 在输出中,即使第二个值只稍高一点,模型也仍旧显示 prediction=1.0。
关闭 Notebook 以释放资源。 为此,请在 Notebook 的“文件”菜单中选择“关闭并停止” 。 此操作会关闭 Notebook。
将 Anaconda scikit-learn 库用于 Spark 机器学习
HDInsight 中的 Apache Spark 群集包含 Anaconda 库。 它还包括适用于机器学习的 scikit-learn 库。 该库还包含用于直接从 Jupyter Notebook 生成示例应用程序的各种数据集。 有关使用 scikit-learn 库的示例,请参阅 https://scikit-learn.org/stable/auto_examples/index.html。
清理资源
如果不打算继续使用此应用程序,请使用以下步骤删除创建的群集:
登录 Azure 门户。
在顶部的“搜索”框中,键入 HDInsight。
选择“服务”下的“HDInsight 群集” 。
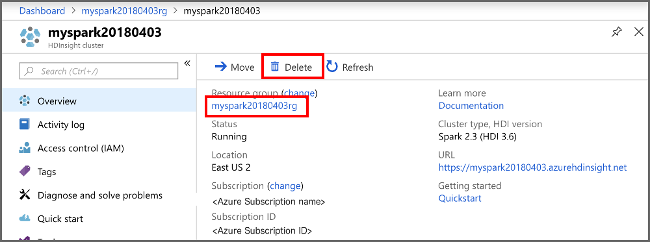
在显示的 HDInsight 群集列表中,选择为本教程创建的群集旁边的“...”。
选择“删除”。 请选择“是”。
后续步骤
本教程介绍如何使用 Jupyter Notebook 生成适用于 Azure HDInsight 的 Apache Spark 机器学习应用程序。 继续学习下一教程,了解如何将 IntelliJ IDEA 用于 Spark 作业。