Note
Access to this page requires authorization. You can try signing in or changing directories.
Access to this page requires authorization. You can try changing directories.
Azure Automation can send runbook job status and job streams to your Log Analytics workspace. This process does not involve workspace linking and is completely independent and allows you to perform simple investigations. Job logs and job streams are visible in the Azure portal, or with PowerShell for individual jobs. With Azure Monitor logs for your Automation account, you can:
- Get insights into the status of your Automation jobs.
- Trigger an email or alert based on your runbook job status (for example, failed or suspended).
- Write advanced queries across your job streams.
- Correlate jobs across Automation accounts.
- Use customized views and search queries to visualize your runbook results, runbook job status, and other related key indicators or metrics through an Azure dashboard.
- Get the audit logs related to Automation accounts, runbooks, and other asset create, modify and delete operations.
Using Azure Monitor logs, you can consolidate logs from different resources in the same workspace where it can be analyzed with queries to quickly retrieve, consolidate, and analyze the collected data. You can create and test queries using Log Analytics in the Azure portal and then either directly analyze the data using these tools or save queries for use with visualization or alert rules.
Azure Monitor uses a version of the Kusto query language (KQL) used by Azure Data Explorer that is suitable for simple log queries. It also includes advanced functionality such as aggregations, joins, and smart analytics. You can quickly learn the query language using multiple lessons.
Azure Automation diagnostic settings
You can forward the following platform logs and metric data using Automation diagnostic settings support:
| Data types | Description |
|---|---|
| Job Logs | Status of the runbook job in the Automation account. |
| Job Streams | Status of the job streams in the runbook defined in the Automation account. |
| DSCNodeStatus | Status of the DSC node. |
| AuditEvent | All resource logs that record customer interactions with data or the settings of the Azure Automation service. |
| Metrics | Total jobs, total update, deployment machine runs, total update deployment runs. |
Configure diagnostic settings in Azure portal
You can configure diagnostic settings in the Azure portal from the menu for the Automation account resource.
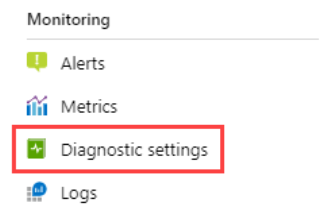
In the Automation account menu, under Monitoring select Diagnostic settings.
Click Add diagnostic setting.
Enter a setting name in the Diagnostic setting name if it doesn't already have one.
You can also view all categories of Logs and metrics.
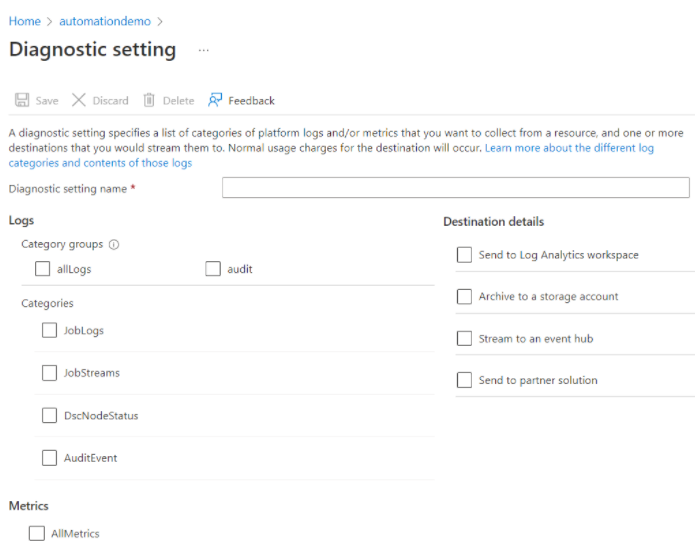
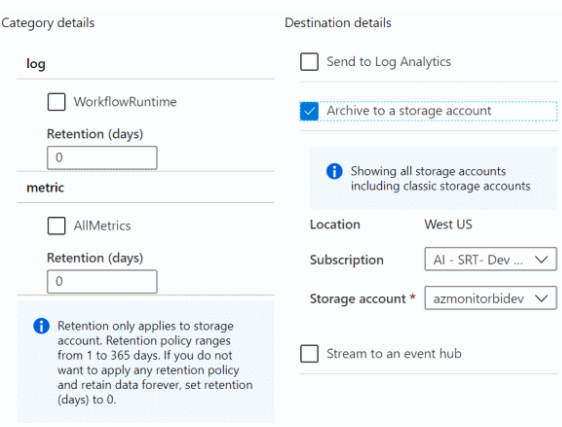
Logs and metrics to route : For logs, choose a category group or select the individual checkboxes for each category of data you want to send to the destinations specified. Choose AllMetrics if you want to store metrics into Azure Monitor logs.
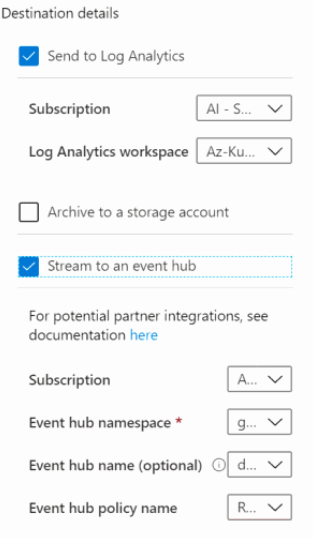
Destination details : Select the checkbox for each destination. As per the selection of each box, the options appear to allow you to add additional information.
Log Analytics : Enter the Subscription ID and workspace name. If you don't have a workspace, you must create one before proceeding.
Event Hubs: Specify the following criteria:
- Subscription: The same subscription as that of the Event Hub.
- Event Hub namespace: Create Event Hub if you don't have one yet.
- Event Hub name (optional): If you don't specify a name, an event hub is created for each log category. If you are sending multiple categories, specify a name to limit the number of Event Hubs created. See Azure Event Hubs quotas and limits for details.
- Event Hub policy (optional): A policy defines the permissions that the streaming mechanism has. See Event Hubs feature.
Storage: Choose the subscription, storage account, and retention policy.
Partner integration: You must first install a partner integration into your subscription. Configuration options will vary by partner.
Click Save.
After a few moments, the new setting appears in your list of settings for this resource, and logs are streamed to the specified destinations as new event data is generated. There can be 15 minutes time difference between the event emitted and its appearance in Log Analytics workspace.
Query the logs
To query the generated logs:
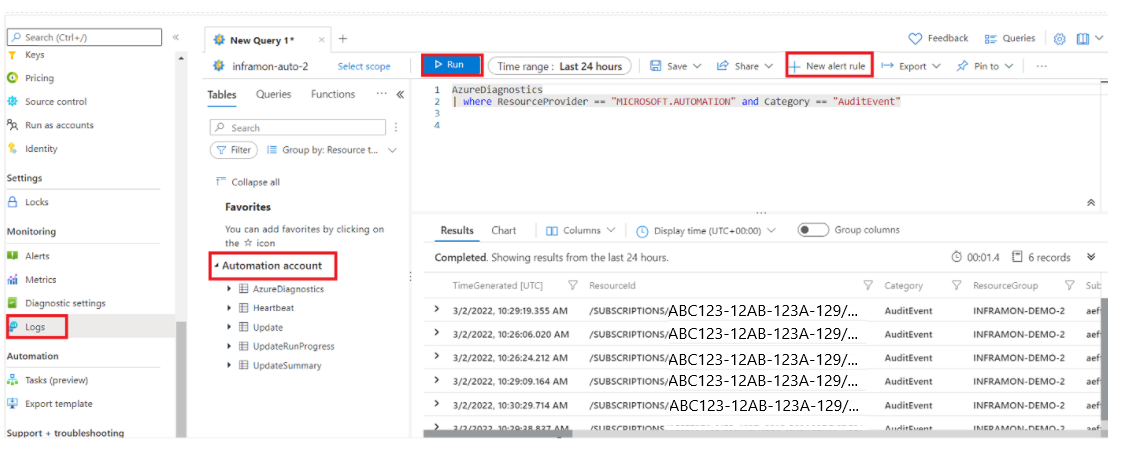
In your Automation account, under Monitoring, select Logs.
Under All Queries, select Automation Jobs.
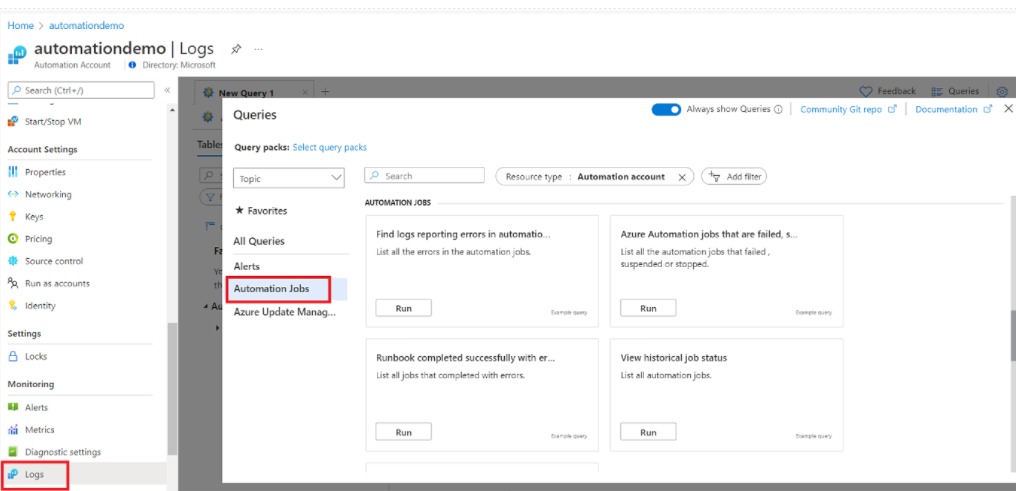
Select one of the queries you want to execute and click Run.
To execute a custom query, close the Queries window and paste your custom query in the new query window and click Run.
The output of the query is displayed in Results pane.
Click New alert rule to configure an Azure Monitor alert for this query.
Azure Monitor log records
Azure Automation diagnostics create the following types of records in Azure Monitor logs, tagged as AzureDiagnostics. The tables in the below sections are examples of records that Azure Automation generates and the data types that appear in log search results.
Job logs
| Property | Description |
|---|---|
| TimeGenerated | Date and time when the runbook job executed. |
| RunbookName_s | Name/names of the runbook. |
| Caller_s | Caller that initiated the operation. Possible values are either an email address or system for scheduled jobs. |
| Tenant_g | GUID (globally unique identifier) that identifies the tenant for the caller. |
| JobId_g | GUID that identifies the runbook job. |
| ResultType | Status of the runbook job. Possible values are: - Created - Started - Stopped - Suspended - Failed - Completed |
| Category | Classification of the type of data. For Automation, the value is JobLogs. |
| OperationName | Type of operation performed in Azure. For Automation, the value is Job. |
| Resource | Name of the Automation account |
| SourceSystem | System that Azure Monitor logs use to collect the data. The value is always Azure for Azure diagnostics. |
| ResultDescription | Runbook job result state. Possible values are: - Job is started - Job Failed - Job Completed |
| CorrelationId | Correlation GUID of the runbook job. |
| ResourceId | Azure Automation account resource ID of the runbook. |
| SubscriptionId | Azure subscription GUID for the Automation account. |
| ResourceGroup | Name of the resource group for the Automation account. |
| ResourceProvider | Name of the resource provider. The value is MICROSOFT.AUTOMATION. |
| ResourceType | Resource type. The value is AUTOMATIONACCOUNTS. |
Job streams
| Property | Description |
|---|---|
| TimeGenerated | Date and time when the runbook job was executed. |
| RunbookName_s | Name of the runbook. |
| Caller_s | Caller that initiated the operation. Possible values are either an email address or system for scheduled jobs. |
| StreamType_s | Type of job stream. Possible values are: -Progress - Output - Warning - Error - Debug - Verbose |
| Tenant_g | GUID that identifies the tenant for the caller. |
| JobId_g | GUID that identifies the runbook job. |
| ResultType | The status of the runbook job. Possible values are: - In Progress |
| Category | Classification of the type of data. For Automation, the value is JobStreams. |
| OperationName | Type of operation performed in Azure. For Automation, the value is Job. |
| Resource | Name of the Automation account. |
| SourceSystem | System that Azure Monitor logs use to collect the data. The value is always Azure for Azure diagnostics. |
| ResultDescription | Description that includes the output stream from the runbook. |
| CorrelationId | Correlation GUID of the runbook job. |
| ResourceId | Azure Automation account resource ID of the runbook. |
| SubscriptionId | Azure subscription GUID for the Automation account. |
| ResourceGroup | Name of the resource group for the Automation account. |
| ResourceProvider | Resource provider. The value is MICROSOFT.AUTOMATION. |
| ResourceType | Resource type. The value is AUTOMATIONACCOUNTS. |
Note
Ensure credentials are not sent to Job streams. Service removes credentials before displaying Job streams in diagnostic logs.
Audit events
| Property | Description |
|---|---|
| TenantID | GUID that identifies the tenant for the caller. |
| TimeGenerated (UTC) | Date and time when the runbook job is executed. |
| Category | AuditEvent |
| ResourceGroup | Resource group name of the Automation account. |
| Subscription Id | Azure subscription GUID for the Automation account. |
| ResourceProvider | MICROSOFT.AUTOMATION |
| Resource | Automation Account name |
| ResourceType | AUTOMATIONACCOUNTS |
| OperationName | Possible values are Update, Create, Delete. |
| ResultType | Status of the runbook job. Possible value is: Completed. |
| CorrelationId | Correlation GUID of the runbook job. |
| ResultDescription | Runbook job result state. Possible values are Update, Create, Delete. |
| Tenant_g | GUID that identifies the tenant for the caller. |
| SourceSystem | System that Azures Monitor logs use to collect the data. The value is always Azure for Azure diagnostics. |
| clientInfo_IpAddress_s | {scrubbed} |
| clientInfo_PrincipalName_s | {scrubbed} |
| clientInfo_TenantId_g | Tenant ID of the client. |
| clientInfo_Issuer_s | |
| clientInfo_ObjectId_g | Object ID of the client. |
| clientInfo_AppId_g | AppID of the client. |
| clientInfo_ClientRequestId_g | RequestID of the client |
| targetResources_Resource_s | Account, Job, Credential, Connections, Variables, Runbook. |
| Type | AzureDiagnostics |
| _ResourceId | Azure Automation account resource ID of the runbook. |
View Automation logs in Azure Monitor logs
Now that you started sending your Automation job streams and logs to Azure Monitor logs, let's see what you can do with these logs inside Azure Monitor logs.
To see the logs, run the following query:
kusto AzureDiagnostics | where ResourceProvider == "MICROSOFT.AUTOMATION"
Sample queries for job logs and job streams
Find all jobs that are completed with error
In addition to scenarios like alerting on failures, you can find when a runbook job has a non-terminating error. In these cases, PowerShell produces an error stream, but the non-terminating errors don't cause your job to suspend or fail.
- In your Log Analytics workspace, click Logs.
- In the query field, type:
AzureDiagnostics | where ResourceProvider == "MICROSOFT.AUTOMATION" and Category == "JobStreams" and StreamType_s == "Error" | summarize AggregatedValue = count () by JobId_g. - Click Search.
View job streams for a job
When you're debugging a job, you might also want to look into the job streams. The following query shows all the streams for a single job with GUID 2ebd22ea-e05e-4eb9-9d76-d73cbd4356e0:
AzureDiagnostics
| where ResourceProvider == "MICROSOFT.AUTOMATION" and Category == "JobStreams" and JobId_g == "2ebd22ea-e05e-4eb9-9d76-d73cbd4356e0"
| sort by TimeGenerated asc
| project ResultDescription
View historical job status
Finally, you might want to visualize your job history over time. You can use this query to search for the status of your jobs over time.
AzureDiagnostics
| where ResourceProvider == "MICROSOFT.AUTOMATION" and Category == "JobLogs" and ResultType != "started"
| summarize AggregatedValue = count() by ResultType, bin(TimeGenerated, 1h)
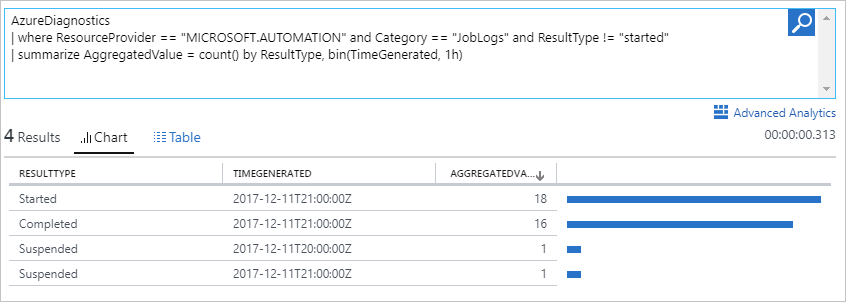
Find logs reporting errors in the automation jobs.
AzureDiagnostics
| where ResourceProvider == "MICROSOFT.AUTOMATION"
| where StreamType_s == "Error"
| project TimeGenerated, Category, JobId_g, OperationName, RunbookName_s, ResultDescription, _ResourceId
Find Azure Automation jobs that are completed
AzureDiagnostics
| where ResourceProvider == "MICROSOFT.AUTOMATION" and Category == "JobLogs" and ResultType == "Completed"
| project TimeGenerated, RunbookName_s, ResultType, _ResourceId, JobId_g
Find Azure Automation jobs that are failed, suspended, or stopped
AzureDiagnostics
| where ResourceProvider == "MICROSOFT.AUTOMATION" and Category == "JobLogs" and (ResultType == "Failed" or ResultType == "Stopped" or ResultType == "Suspended")
| project TimeGenerated, RunbookName_s, ResultType, _ResourceId, JobId_g
List all runbooks & jobs that completed successfully with errors
AzureDiagnostics
| where ResourceProvider == "MICROSOFT.AUTOMATION" and Category == "JobStreams" and StreamType_s == "Error"
| project TimeGenerated, RunbookName_s, StreamType_s, _ResourceId, ResultDescription, JobId_g
Send an email when a runbook job fails or suspends
The following steps explain how to set up email alerts in Azure Monitor to notify when something goes wrong with a runbook job.
To create an alert rule, create a log search for the runbook job records that should invoke the alert as described in Query the logs. Click the +New alert rule to configure the alert rule.
In your Automation account, under Monitoring, select Logs.
Create a log search query for your alert by entering a search criteria into the query field.
AzureDiagnostics | where ResourceProvider == "MICROSOFT.AUTOMATION" and Category == "JobLogs" and (ResultType == "Failed" or ResultType == "Suspended")You can also group by the runbook name by using:
AzureDiagnostics | where ResourceProvider == "MICROSOFT.AUTOMATION" and Category == "JobLogs" and (ResultType == "Failed" or ResultType == "Suspended") | summarize AggregatedValue = count() by RunbookName_sTo open the Create alert rule screen, click +New alert rule on the top of the page. For more information on the options to configure the alerts, see Log alerts in Azure
Azure Automation diagnostic audit logs
You can now send audit logs also to the Azure Monitor workspace. This allows enterprises to monitor key automation account activities for security & compliance. When enabled through the Azure Diagnostics settings, you will be able to collect telemetry about create, update and delete operations for the Automation runbooks, jobs and automation assets like connection, credential, variable & certificate. You can also configure the alerts for audit log conditions as part of your security monitoring requirements.
Difference between activity logs and audit logs
Activity log is a platform login Azure that provides insight into subscription-level events. The activity log for Automation account includes information about when an automation resource is modified or created or deleted. However, it does not capture the name or ID of the resource.
Audit logs for Automation accounts capture the name and ID of the resource such as automation variable, credential, connection and so on, along with the type of the operation performed for the resource and Azure Automation would scrub some details like client IP data conforming to the GDPR compliance.
Activity logs would show details such as client IP because an Activity log is a platform log that provides detailed diagnostic and auditing information for Azure resources. They are automatically generated for activities that occur in ARM and gets pushed to the activity log resource provider. Since Activity logs are part of Azure monitoring, it would show some client data to provide insights into the client activity.
Sample queries for audit logs
Query to view Automation resource audit logs
AzureDiagnostics
| where ResourceProvider == "MICROSOFT.AUTOMATION" and Category == "AuditEvent"
Query to Monitor any variable update, create or delete operation
AzureDiagnostics
| where ResourceProvider == "MICROSOFT.AUTOMATION" and Category == "AuditEvent" and targetResources_Resource_s == "Variable"
Query to Monitor any runbook operation like create, draft or update
AzureDiagnostics
| where ResourceProvider == "MICROSOFT.AUTOMATION" and Category == "AuditEvent" and targetResources_Resource_s contains "Runbook"
Query to Monitor any certificate creation, updating or deletion
AzureDiagnostics
| where ResourceProvider == "MICROSOFT.AUTOMATION" and Category == "AuditEvent" and targetResources_Resource_s contains "Certificate"
Query to Monitor any credentials creation, updating or deletion
AzureDiagnostics
| where ResourceProvider == "MICROSOFT.AUTOMATION" and Category == "AuditEvent" and targetResources_Resource_s contains "Credential"
Filter job status output converted into a JSON object
Recently we changed the behavior of how the Automation log data is written to the AzureDiagnostics table in the Log Analytics service, where it no longer breaks down the JSON properties into separate fields. If you configured your runbook to format objects in the output stream in JSON format as separate columns, it is necessary to reconfigure your queries to parse that field to a JSON object to access those properties. This is accomplished using parse json to access a specific JSON element in a known path.
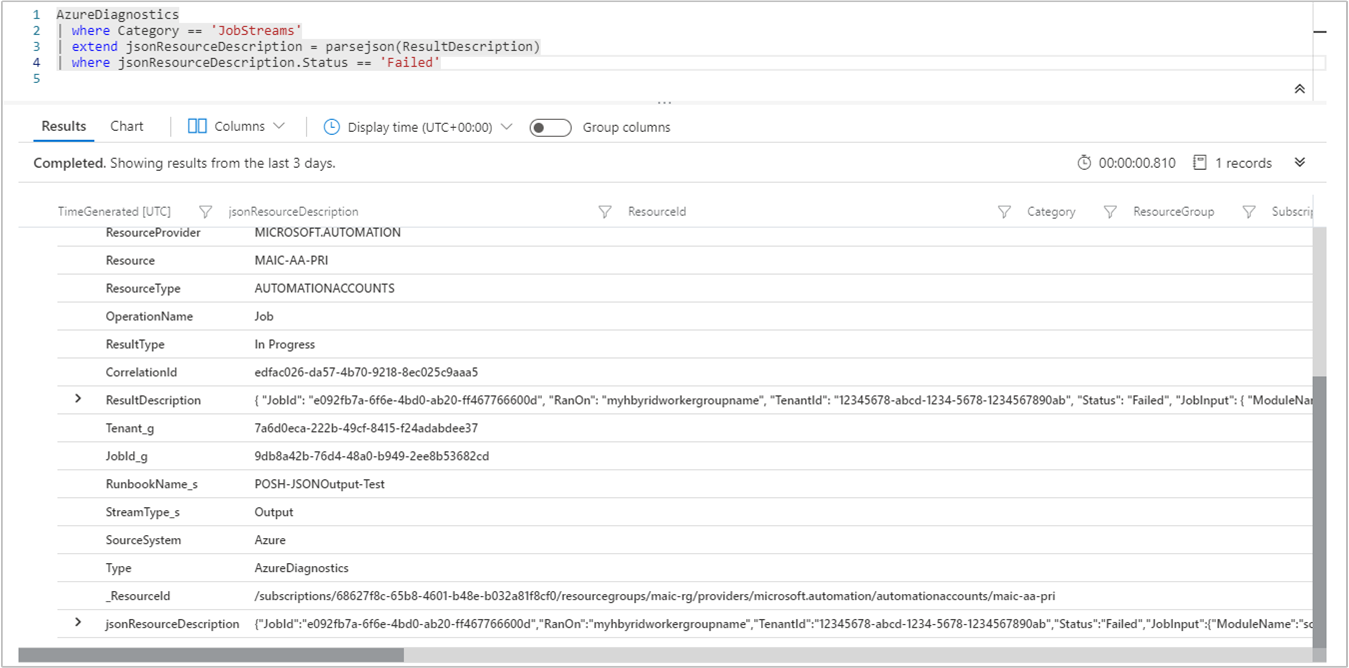
For example, a runbook formats the ResultDescription property in the output stream in JSON format with multiple fields. To search for the status of your jobs that are in a failed state as specified in a field called Status, use this example query to search the ResultDescription with a status of Failed:
AzureDiagnostics
| where Category == 'JobStreams'
| extend jsonResourceDescription = parse_json(ResultDescription)
| where jsonResourceDescription.Status == 'Failed'
Next steps
- To learn how to construct search queries and review the Automation job logs with Azure Monitor logs, see Log searches in Azure Monitor logs.
- To understand creation and retrieval of output and error messages from runbooks, see Monitor runbook output.
- To learn more about runbook execution, how to monitor runbook jobs, and other technical details, see Runbook execution in Azure Automation.
- To learn more about Azure Monitor logs and data collection sources, see Collecting Azure storage data in Azure Monitor logs overview.
- For help troubleshooting Log Analytics, see Troubleshooting why Log Analytics is no longer collecting data.
