Note
Access to this page requires authorization. You can try signing in or changing directories.
Access to this page requires authorization. You can try changing directories.
Alerts are used to set up recurring tests to monitor the availability and responsiveness of your Azure Cosmos DB resources. Alerts can send you a notification in the form of an email, or execute an Azure Function when one of your metrics reaches the threshold or if a specific event is logged in the activity log.
You can receive an alert based on the metrics, activity log events, or Log Analytics logs on your Azure Cosmos DB account:
Metrics - The alert triggers when the value of a specified metric crosses a threshold you assign. For example, when the total request units consumed exceed 1000 RU/s. This alert is triggered both when the condition is first met and then afterwards when that condition is no longer being met. See the monitoring data reference article for different metrics available in Azure Cosmos DB.
Activity log events – This alert triggers when a certain event occurs. For example, when the keys of your Azure Cosmos DB account are accessed or refreshed.
You can set up alerts from the Azure Cosmos DB pane or the Azure Monitor service in the Azure portal. Both the interfaces offer the same options. This article shows you how to set up alerts for Azure Cosmos DB using Azure Monitor.
Create an alert rule
This section shows how to create an alert when you receive an HTTP status code 429, which is received when the requests are rate limited. For example, you may want to receive an alert when there are 100 or more rate limited requests. This article shows you how to configure an alert for such scenario by using the HTTP status code. You can use the similar steps to configure other types of alerts as well, you just need to choose a different condition based on your requirement.
Tip
The scenario of alerting based on number of 429s exceeding a threshold is used here for illustration purposes. It does not mean that there is anything inherently wrong with seeing 429s on your database or container. In general, if you see 1-5% of requests with 429s in a production workload and your overall application latency is within your requirements, this is a normal and healthy sign that you are fully using the throughput (RU/s) you've provisioned. Learn more about how to interpret and debug 429 exceptions.
Sign into the Azure portal.
Select Monitor from the left-hand navigation bar and select Alerts.
Select the New alert rule button to open the Create alert rule pane.
Fill out the Scope section:
Open the Select resource pane and configure the following:
Choose your subscription name.
Select Azure Cosmos DB accounts for the resource type.
The location of your Azure Cosmos DB account.
After filling in the details, a list of Azure Cosmos DB accounts in the selected scope is displayed. Choose the one for which you want to configure alerts and select Done.
Fill out the Condition section:
Open the Select condition pane to open the Select a signal page and configure the following:
Select a signal. The signal type can be a Metric, an Activity Log or a Log (Log Analytics). Choose Metrics for this scenario, as you want to get an alert when rate limiting occurs on the total request units metric.
Select All for the Monitor service
Choose a Signal name. To get an alert for HTTP status codes, choose the Total Request Units signal.
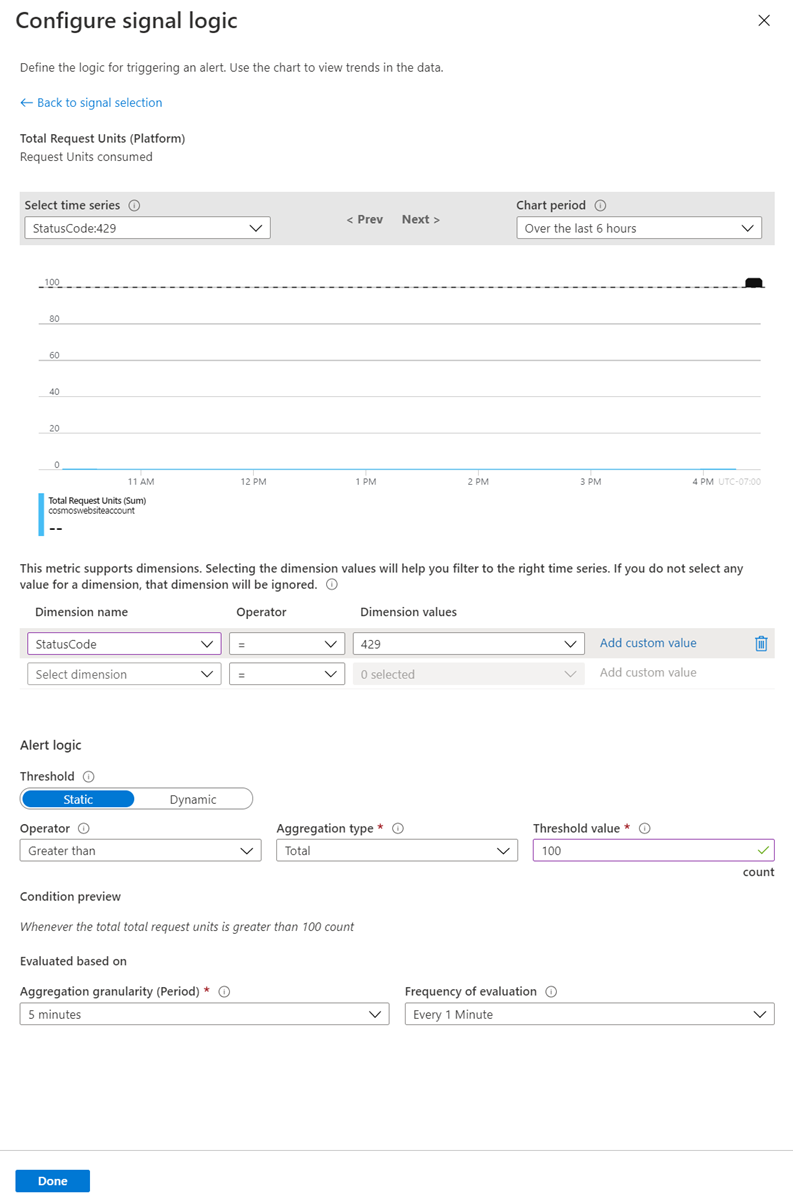
Now, you can define the logic for triggering an alert and use the chart to view trends of your Azure Cosmos DB account. The Total Request Units metric supports dimensions. These dimensions allow you to filter on the metric. For example, you can use dimensions to filter to a specific database or container you want to monitor. If you don't select any dimension, this value is ignored.
Choose StatusCode as the Dimension name. Select Add custom value and set the status code to 429.
In the Alert logic, set the Threshold to Static. The static threshold uses a user-defined threshold value to evaluate the rule, whereas the dynamic thresholds use inbuilt machine learning algorithms to continuously learn the metric behavior pattern and calculate the thresholds automatically.
Set the operator to Greater than, the Aggregation type to Total, and the Threshold value to 100. With this logic, if your client sees more than 100 requests that have a 429 status code, the alert is triggered. You can also configure the aggregation type, aggregation granularity, and the frequency of evaluation based on your requirement.
After filling the form, select Done. The following screenshot shows the details of the alert logic:
Fill out the Action group section:
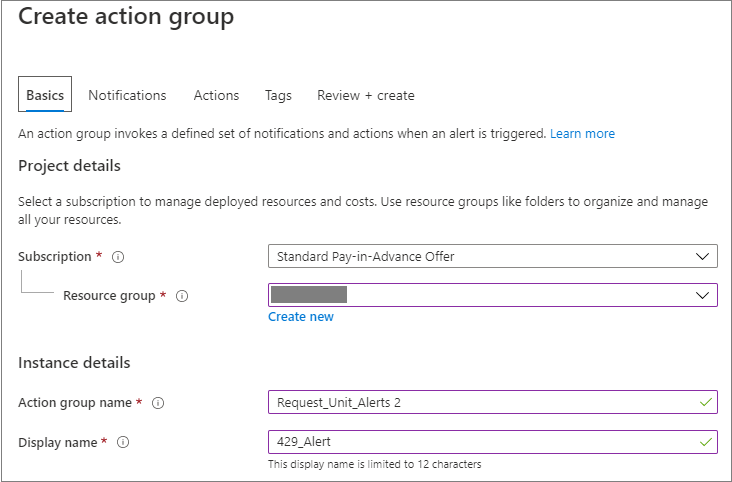
On the Create rule pane, select an existing action group, or create a new action group. An action group enables you to define the action to be taken when an alert condition occurs. For this example, create a new action group to receive an email notification when the alert is triggered. Open the Add action group pane and fill out the following details:
Action group name - The action group name must be unique within a resource group.
Short name - The action group's Short name, this value is included in email and SMS notifications to identify which action group was the source of the notification.
Choose the subscription and the resource group in which this action group will be created.
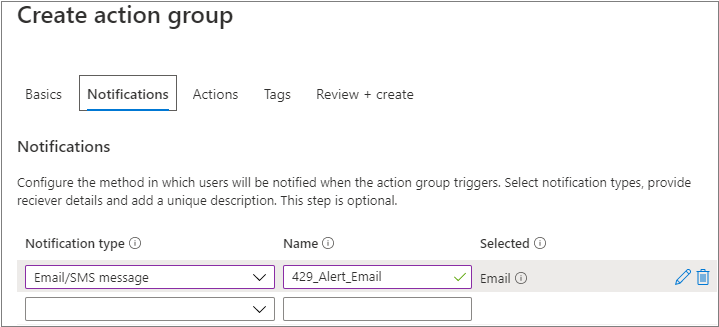
Provide a name for your action and select Email/SMS message as the Notification Type. The following screenshot shows the details of the action type:
Fill out the Alert rule details section:
- Define a name for the rule, provide an optional description, the severity level of the alert, choose whether to enable the rule upon rule creation, and then select Create rule alert to create the metric rule alert.
After creating the alert, it will be active within 10 minutes.
Common alerting scenarios
The following are some scenarios where you can use alerts:
When the keys of an Azure Cosmos DB account are updated.
When the data or index usage of a container, database, or a region exceeds a certain number of bytes.
When the normalized RU/s consumption is greater than certain percentage. The normalized RU consumption metric gives the maximum throughput utilization within a replica set. To learn, see the How to monitor normalized RU/s article.
When a region is added, removed, or if it goes offline.
When a database or a container is created, deleted, or updated.
When the throughput of your database or the container is changed.
Next steps
- How to monitor normalized RU/s metric in Azure Cosmos DB container.
- How to monitor throughput or request unit usage of an operation in Azure Cosmos DB.