Note
Access to this page requires authorization. You can try signing in or changing directories.
Access to this page requires authorization. You can try changing directories.
Switch services using the Version drop-down list. Learn more about navigation.
Applies to: ✅ Azure Data Explorer ✅ Azure Monitor ✅ Microsoft Sentinel
The time pivot visualization is an interactive navigation over the events time-line pivoting on time axis.
Note
- This visualization can only be used in the context of the render operator.
- This visualization can be used in Kusto. Explorer but isn't available in the Azure Data Explorer web UI.
Syntax
T | render timepivot [with (propertyName = propertyValue [, ...])]
Learn more about syntax conventions.
Parameters
| Name | Type | Required | Description |
|---|---|---|---|
| T | string |
✔️ | Input table name. |
| propertyName, propertyValue | string |
A comma-separated list of key-value property pairs. See supported properties. |
Supported properties
All properties are optional.
| PropertyName | PropertyValue |
|---|---|
series |
Comma-delimited list of columns whose combined per-record values define the series that record belongs to. |
Interactive display
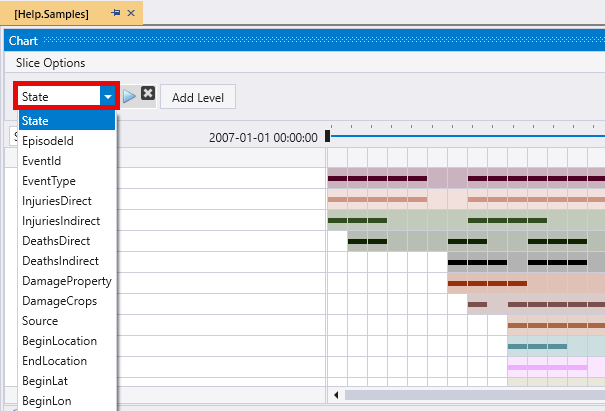
After you render the time pivot, you can further investigate and interact with the data by adding slice levels, and by drilling into specific time slices. The data in the table updates interactively according to the slice options you configure. The slice options that are available are:
- Change, add, and remove multiple slice levels
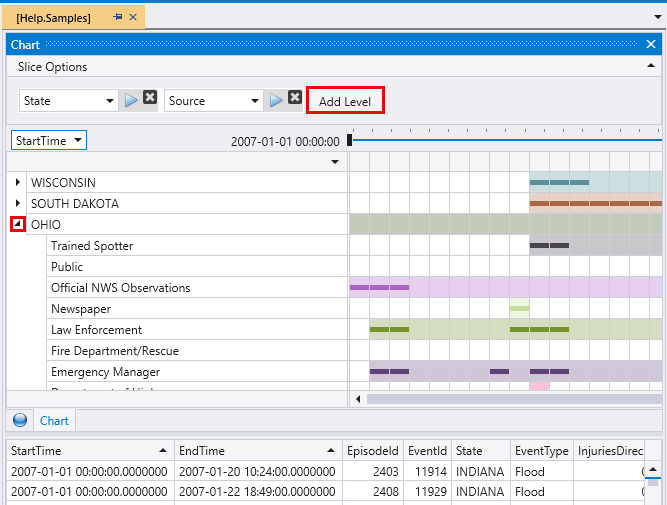
- Expand rows to view details of each level
- Toggle to view by start time or by end time
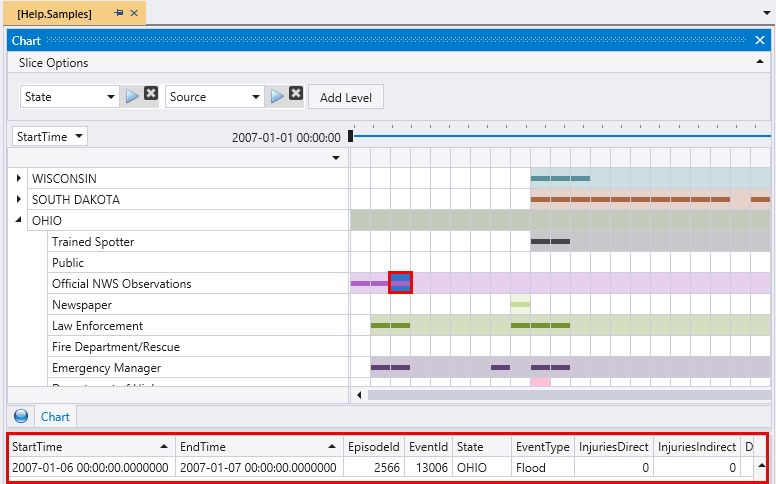
- Select specific rows, or specific time slices, and view their data in the table.
Note
- Time pivots have built-in support for the OpenTelemetry schema, a cross-platform, open standard for collecting and emitting telemetry data. The standardized and structured format of OpenTelemetry data facilitates efficient data pivoting and analysis. When interacting with the first-level of the slice options, the OpenTelemtry spans and their nested hierarchy display in the list.
Examples
The examples in this section show how to use the syntax to help you get started.
Visualize flood events per state
This query outputs a visualization of flood events in the specified Midwestern states, displayed as a time pivot chart.
let midwesternStates = dynamic([
  "ILLINOIS", "INDIANA", "IOWA", "KANSAS", "MICHIGAN", "MINNESOTA",
  "MISSOURI", "NEBRASKA", "NORTH DAKOTA", "OHIO", "SOUTH DAKOTA", "WISCONSIN"
]);
StormEvents
| where EventType == "Flood" and State in (midwesternStates)
| render timepivot with (series=State)
Output

You can further interact with the time pivot, for example:
Select a new slice option to change the data displayed in the time pivot. The data in the table below the time pivot updates to reflect the new series.
Add slice option levels to further investigate and interact with the data. Expand each row to see the levels added.
To display the data relevant for a specific slice, select one or more time slices in a row of the time pivot.


View and slice hierarchical OpenTelemetry data
OpenTelemetry data slice options reflect its nested hierarchy.
In this example, a time pivot is rendered according to a specific TraceID in the datatable. The query shown in this example contains the first two rows of data from a large table.
datatable(TraceID:string, SpanID:string, ParentID:string, SpanName:string, SpanStatus:string, SpanKind:string, StartTime:datetime, EndTime:datetime, ResourceAttributes:dynamic, TraceAttributes:dynamic, Events:dynamic, Links:dynamic)
[
    "c339bbae48eb8426f9a63c4eee55284c", "d1265cecd4c291ee", "", "POST", "STATUS_CODE_UNSET", "SPAN_KIND_CLIENT", datetime(2025-04-07T04:15:52.1657810Z), datetime(2025-04-07T04:16:01.6616919Z), dynamic({"k8s.namespace.name":"otel-demo","k8s.pod.start_time":"2025-04-06T00:19:47.0000000Z","k8s.deployment.name":"opentelemetry-demo-loadgenerator","k8s.node.name":"aks-userpool-31567306-vmss000003","service.name":"loadgenerator","service.version":"1.12.0","k8s.pod.uid":"d2fbaf5d-b5c2-4dac-af08-b92d56573899","k8s.pod.name":"opentelemetry-demo-loadgenerator-6994f5db8-lq4qs","service.instance.id":"d2fbaf5d-b5c2-4dac-af08-b92d56573899","service.namespace":"opentelemetry-demo","k8s.pod.ip":"10.244.0.57","telemetry.sdk.language":"python","telemetry.sdk.version":"1.25.0","telemetry.sdk.name":"opentelemetry"}), dynamic({"http.status_code":200,"http.url":"http://opentelemetry-demo-frontendproxy:8080/api/checkout","http.method":"POST","scope.name":"opentelemetry.instrumentation.requests","scope.version":"0.46b0"}), dynamic([]), dynamic([]),
    "c339bbae48eb8426f9a63c4eee55284c", "651aa53d2f583eca", "d488b4a32f60794f", "POST /api/checkout", "STATUS_CODE_UNSET", "SPAN_KIND_SERVER", datetime(2025-04-07T04:15:52.1680000Z), datetime(2025-04-07T04:16:01.4667420Z), dynamic({"k8s.namespace.name":"otel-demo","k8s.pod.start_time":"2025-04-06T00:19:47.0000000Z","k8s.deployment.name":"opentelemetry-demo-frontend","k8s.node.name":"aks-userpool-31567306-vmss000003","service.name":"frontend","service.version":"1.12.0","k8s.pod.uid":"aaaabbbb-0000-cccc-1111-dddd2222eeee","k8s.pod.name":"opentelemetry-demo-frontend-59bccd8fdb-j9xxf","service.instance.id":"aaaabbbb-0000-cccc-1111-dddd2222eeee","service.namespace":"opentelemetry-demo","k8s.pod.ip":"10.244.0.45","process.command_args":["/usr/local/bin/node","--require","./Instrumentation.js","/app/server.js"],"os.type":"linux","telemetry.sdk.language":"nodejs","telemetry.sdk.version":"1.25.1","process.pid":16,"telemetry.sdk.name":"opentelemetry","process.runtime.name":"nodejs","process.runtime.description":"Node.js","process.runtime.version":"20.18.0","host.name":"opentelemetry-demo-frontend-59bccd8fdb-j9xxf","host.arch":"amd64","process.executable.path":"/usr/local/bin/node","container.id":"d1763eedd13fa94f9581d9099ab481e112a8fdf95b6da831b9f01a4b8490fe60","os.version":"5.15.176.3-3.cm2","process.owner":"nextjs","process.command":"/app/server.js","process.executable.name":"node"}), dynamic({"http.status_code":200,"http.method":"POST","scope.name":"next.js","scope.version":"0.0.1","http.target":"/api/checkout","next.span_type":"BaseServer.handleRequest","next.span_name":"POST /api/checkout","next.rsc":false}), dynamic([]), dynamic([]),
    ...
]
| where TraceID == '081a007d3b7deaf32ca43a554c5058bd'
| render timepivot
Output
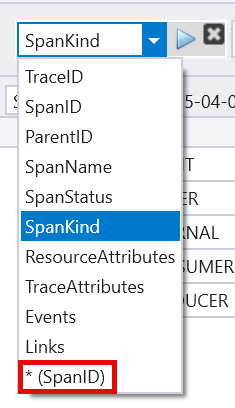
In the time pivot, the Slice options are automatically set to SpanKind as the column to pivot by.

You can show the hierarchy of the individual spans in the same OpenTelemetry trace, by changing the Slice options to (SpanID). The hierarchy is expandable to display the spans that make up the entire trace. For each span you can see the span kind, span name, and span ID as the span header.
The header in the first line is [SPAN_KIND_CLIENT/POST]: 3275d2b91035ce2e and is expanded to show the hierarchy.
