Note
Access to this page requires authorization. You can try signing in or changing directories.
Access to this page requires authorization. You can try changing directories.
We recommend debugging Apache Spark applications remotely through SSH. For instructions, see Remotely debug Apache Spark applications on an HDInsight cluster with Azure Toolkit for IntelliJ through SSH.
This article provides step-by-step guidance on how to use the HDInsight Tools in Azure Toolkit for IntelliJ to submit a Spark job on an HDInsight Spark cluster, and then debug it remotely from your desktop computer. To complete these tasks, you must perform the following high-level steps:
- Create a site-to-site or point-to-site Azure virtual network. The steps in this document assume that you use a site-to-site network.
- Create a Spark cluster in HDInsight that is part of the site-to-site virtual network.
- Verify the connectivity between the cluster head node and your desktop.
- Create a Scala application in IntelliJ IDEA, and then configure it for remote debugging.
- Run and debug the application.
Prerequisites
- An Azure subscription.
- An Apache Spark cluster in HDInsight. For instructions, see Create Apache Spark clusters in Azure HDInsight.
- Oracle Java development kit. You can install it from the Oracle website.
- IntelliJ IDEA. This article uses version 2017.1. You can install it from the JetBrains website.
- HDInsight Tools in Azure Toolkit for IntelliJ. HDInsight tools for IntelliJ are available as part of Azure Toolkit for IntelliJ. For instructions on how to install Azure Toolkit, see Install Azure Toolkit for IntelliJ.
- Sign in to your Azure Subscription from IntelliJ IDEA. Follow the instructions in Use Azure Toolkit for IntelliJ to create Apache Spark applications for an HDInsight cluster.
- Exception workaround. While running the Spark Scala application for remote debugging on a Windows computer, you might get an exception. This exception is explained in SPARK-2356 and occurs due to a missing WinUtils.exe file in Windows. To work around this error, you must download Winutils.exe to a location such as C:\WinUtils\bin. Add an HADOOP_HOME environment variable, and then set the value of the variable to C\WinUtils.
Step 1: Create an Azure virtual network
Follow the instructions from the following links to create an Azure virtual network, and then verify the connectivity between your desktop computer and the virtual network:
- Create a VNet with a site-to-site VPN connection using the Azure portal
- Create a VNet with a site-to-site VPN connection using PowerShell
- Configure a point-to-site connection to a virtual network using PowerShell
Step 2: Create an HDInsight Spark cluster
We recommend that you also create an Apache Spark cluster in Azure HDInsight that is part of the Azure virtual network that you created. Use the information available in Create Linux-based clusters in HDInsight. As part of optional configuration, select the Azure virtual network that you created in the previous step.
Step 3: Verify the connectivity between the cluster head node and your desktop
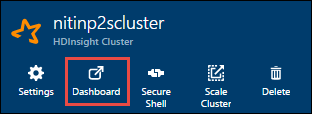
Get the IP address of the head node. Open Ambari UI for the cluster. From the cluster blade, select Dashboard.
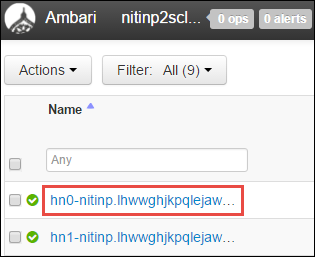
From the Ambari UI, select Hosts.

You see a list of head nodes, worker nodes, and zookeeper nodes. The head nodes have an hn* prefix. Select the first head node.
From the Summary pane at the bottom of the page that opens, copy the IP Address of the head node and the Hostname.
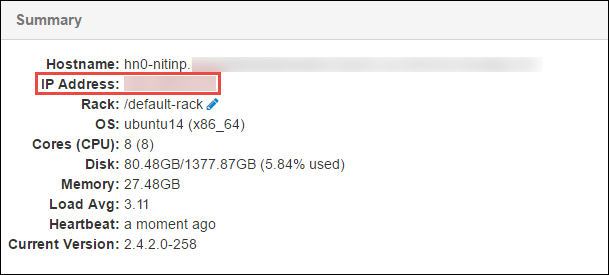
Add the IP address and the hostname of the head node to the hosts file on the computer where you want to run and remotely debug the Spark job. This enables you to communicate with the head node by using the IP address, as well as the hostname.
a. Open a Notepad file with elevated permissions. From the File menu, select Open, and then find the location of the hosts file. On a Windows computer, the location is C:\Windows\System32\Drivers\etc\hosts.
b. Add the following information to the hosts file:
# For headnode0
192.xxx.xx.xx nitinp
192.xxx.xx.xx nitinp.lhwwghjkpqejawpqbwcdyp3.gx.internal.chinacloudapp.cn

# For headnode1
192.xxx.xx.xx nitinp
192.xxx.xx.xx nitinp.lhwwghjkpqejawpqbwcdyp3.gx.internal.chinacloudapp.cn
From the computer that you connected to the Azure virtual network that is used by the HDInsight cluster, verify that you can ping the head nodes by using the IP address, as well as the hostname.
Use SSH to connect to the cluster head node by following the instructions in Connect to an HDInsight cluster using SSH. From the cluster head node, ping the IP address of the desktop computer. Test the connectivity to both IP addresses assigned to the computer:
- One for the network connection
- One for the Azure virtual network
Repeat the steps for the other head node.
Step 4: Create an Apache Spark Scala application by using HDInsight Tools in Azure Toolkit for IntelliJ and configure it for remote debugging
Open IntelliJ IDEA and create a new project. In the New Project dialog box, do the following:
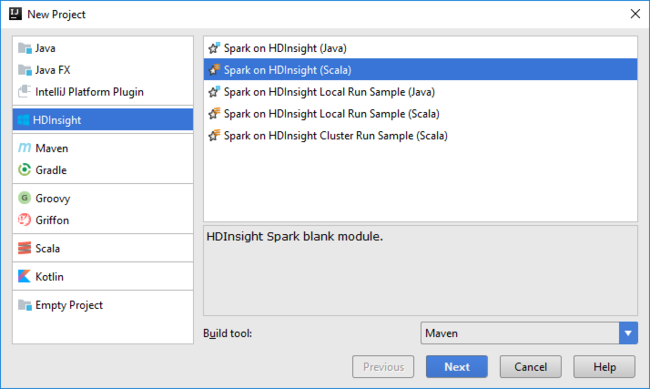
a. Select HDInsight > Spark on HDInsight (Scala).
b. Select Next.
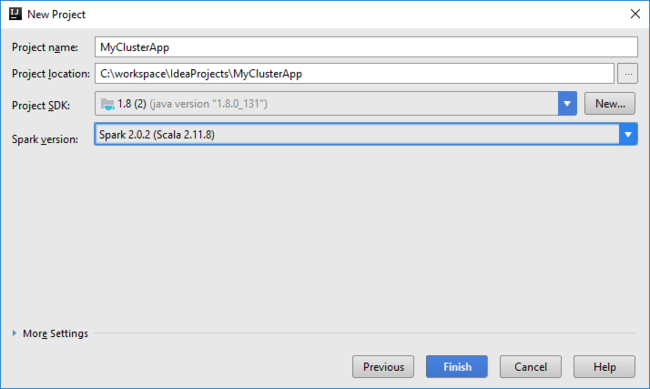
In the next New Project dialog box, do the following, and then select Finish:
Enter a project name and location.
In the Project SDK drop-down list, select Java 1.8 for the Spark 2.x cluster, or select Java 1.7 for the Spark 1.x cluster.
In the Spark version drop-down list, the Scala project creation wizard integrates the proper version for the Spark SDK and the Scala SDK. If the Spark cluster version is earlier than 2.0, select Spark 1.x. Otherwise, select Spark2.x. This example uses Spark 2.0.2 (Scala 2.11.8).
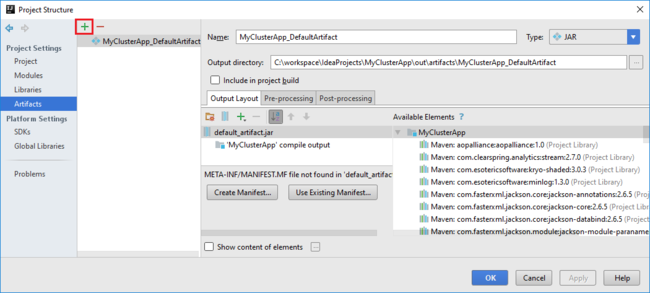
The Spark project automatically creates an artifact for you. To view the artifact, do the following:
a. From the File menu, select Project Structure.
b. In the Project Structure dialog box, select Artifacts to view the default artifact that is created. You can also create your own artifact by selecting the plus sign (+).
Add libraries to your project. To add a library, do the following:
a. Right-click the project name in the project tree, and then select Open Module Settings.
b. In the Project Structure dialog box, select Libraries, select the (+) symbol, and then select From Maven.
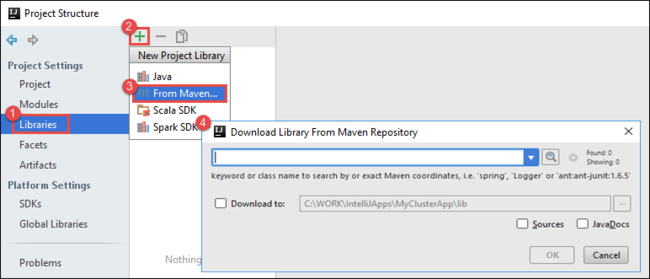
c. In the Download Library from Maven Repository dialog box, search for and add the following libraries:
org.scalatest:scalatest_2.10:2.2.1org.apache.hadoop:hadoop-azure:2.7.1
Copy
yarn-site.xmlandcore-site.xmlfrom the cluster head node and add them to the project. Use the following commands to copy the files. You can use Cygwin to run the followingscpcommands to copy the files from the cluster head nodes:scp <ssh user name>@<headnode IP address or host name>://etc/hadoop/conf/core-site.xml .Because we already added the cluster head node IP address and hostnames for the hosts file on the desktop, we can use the
scpcommands in the following manner:scp sshuser@nitinp:/etc/hadoop/conf/core-site.xml . scp sshuser@nitinp:/etc/hadoop/conf/yarn-site.xml .To add these files to your project, copy them under the /src folder in your project tree, for example
<your project directory>\src.Update the
core-site.xmlfile to make the following changes:a. Replace the encrypted key. The
core-site.xmlfile includes the encrypted key to the storage account associated with the cluster. In thecore-site.xmlfile that you added to the project, replace the encrypted key with the actual storage key associated with the default storage account. For more information, see Manage storage account access keys.<property> <name>fs.azure.account.key.hdistoragecentral.blob.core.chinacloudapi.cn</name> <value>access-key-associated-with-the-account</value> </property>b. Remove the following entries from
core-site.xml:<property> <name>fs.azure.account.keyprovider.hdistoragecentral.blob.core.chinacloudapi.cn</name> <value>org.apache.hadoop.fs.azure.ShellDecryptionKeyProvider</value> </property> <property> <name>fs.azure.shellkeyprovider.script</name> <value>/usr/lib/python2.7/dist-packages/hdinsight_common/decrypt.sh</value> </property> <property> <name>net.topology.script.file.name</name> <value>/etc/hadoop/conf/topology_script.py</value> </property>c. Save the file.
Add the main class for your application. From the Project Explorer, right-click src, point to New, and then select Scala class.
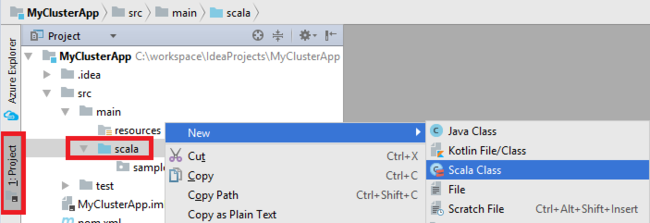
In the Create New Scala Class dialog box, provide a name, select Object in the Kind box, and then select OK.
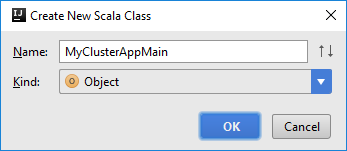
In the
MyClusterAppMain.scalafile, paste the following code. This code creates the Spark context and opens anexecuteJobmethod from theSparkSampleobject.import org.apache.spark.{SparkConf, SparkContext} object SparkSampleMain { def main (arg: Array[String]): Unit = { val conf = new SparkConf().setAppName("SparkSample") .set("spark.hadoop.validateOutputSpecs", "false") val sc = new SparkContext(conf) SparkSample.executeJob(sc, "wasb:///HdiSamples/HdiSamples/SensorSampleData/hvac/HVAC.csv", "wasb:///HVACOut") } }Repeat steps 8 and 9 to add a new Scala object called
*SparkSample. Add the following code to this class. This code reads the data from the HVAC.csv (available in all HDInsight Spark clusters). It retrieves the rows that only have one digit in the seventh column in the CSV file, and then writes the output to /HVACOut under the default storage container for the cluster.import org.apache.spark.SparkContext object SparkSample { def executeJob (sc: SparkContext, input: String, output: String): Unit = { val rdd = sc.textFile(input) //find the rows which have only one digit in the 7th column in the CSV val rdd1 = rdd.filter(s => s.split(",")(6).length() == 1) val s = sc.parallelize(rdd.take(5)).cartesian(rdd).count() println(s) rdd1.saveAsTextFile(output) //rdd1.collect().foreach(println) } }Repeat steps 8 and 9 to add a new class called
RemoteClusterDebugging. This class implements the Spark test framework that is used to debug the applications. Add the following code to theRemoteClusterDebuggingclass:import org.apache.spark.{SparkConf, SparkContext} import org.scalatest.FunSuite class RemoteClusterDebugging extends FunSuite { test("Remote run") { val conf = new SparkConf().setAppName("SparkSample") .setMaster("yarn-client") .set("spark.yarn.am.extraJavaOptions", "-Dhdp.version=2.4") .set("spark.yarn.jar", "wasb:///hdp/apps/2.4.2.0-258/spark-assembly-1.6.1.2.4.2.0-258-hadoop2.7.1.2.4.2.0-258.jar") .setJars(Seq("""C:\workspace\IdeaProjects\MyClusterApp\out\artifacts\MyClusterApp_DefaultArtifact\default_artifact.jar""")) .set("spark.hadoop.validateOutputSpecs", "false") val sc = new SparkContext(conf) SparkSample.executeJob(sc, "wasb:///HdiSamples/HdiSamples/SensorSampleData/hvac/HVAC.csv", "wasb:///HVACOut") } }There are a couple of important things to note:
- For
.set("spark.yarn.jar", "wasb:///hdp/apps/2.4.2.0-258/spark-assembly-1.6.1.2.4.2.0-258-hadoop2.7.1.2.4.2.0-258.jar"), make sure the Spark assembly JAR is available on the cluster storage at the specified path. - For
setJars, specify the location where the artifact JAR is created. Typically, it is<Your IntelliJ project directory>\out\<project name>_DefaultArtifact\default_artifact.jar.
- For
In the
*RemoteClusterDebuggingclass, right-click thetestkeyword, and then select Create RemoteClusterDebugging Configuration.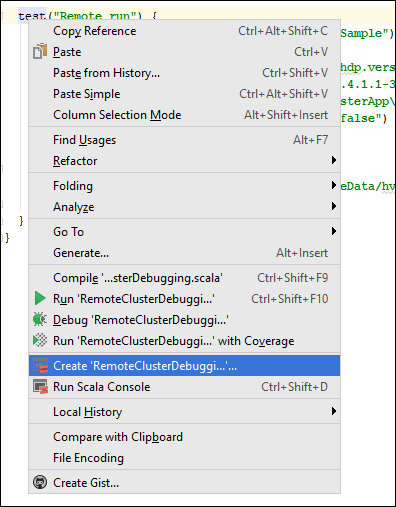
In the Create RemoteClusterDebugging Configuration dialog box, provide a name for the configuration, and then select Test kind as the Test name. Leave all the other values as the default settings. Select Apply, and then select OK.
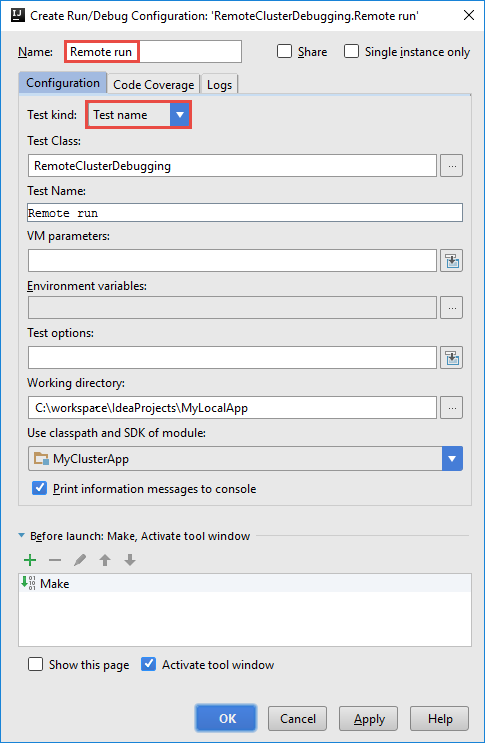
You should now see a Remote run configuration drop-down list in the menu bar.

Step 5: Run the application in debug mode
In your IntelliJ IDEA project, open
SparkSample.scalaand create a breakpoint next toval rdd1. In the Create Breakpoint for pop-up menu, select line in function executeJob.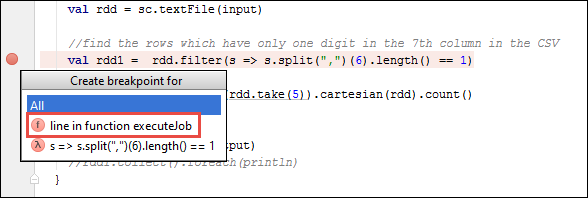
To run the application, select the Debug Run button next to the Remote Run configuration drop-down list.

When the program execution reaches the breakpoint, you see a Debugger tab in the bottom pane.
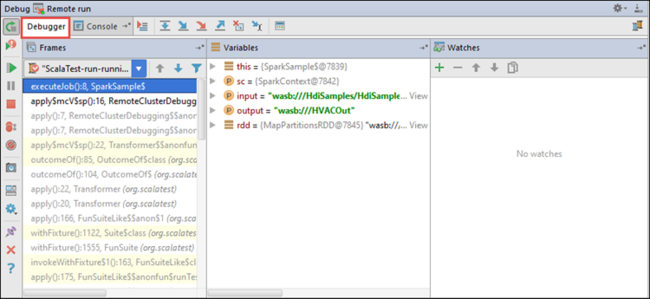
To add a watch, select the (+) icon.
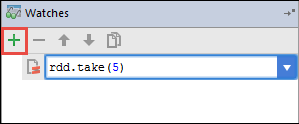
In this example, the application broke before the variable
rdd1was created. By using this watch, we can see the first five rows in the variablerdd. Select Enter.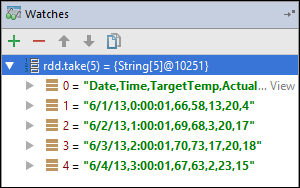
What you see in the previous image is that at runtime, you might query terabytes of data and debug how your application progresses. For example, in the output shown in the previous image, you can see that the first row of the output is a header. Based on this output, you can modify your application code to skip the header row, if necessary.
You can now select the Resume Program icon to proceed with your application run.
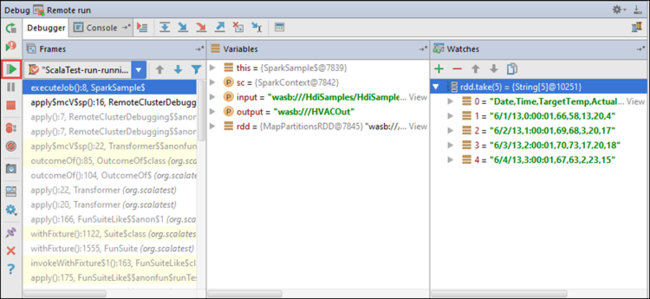
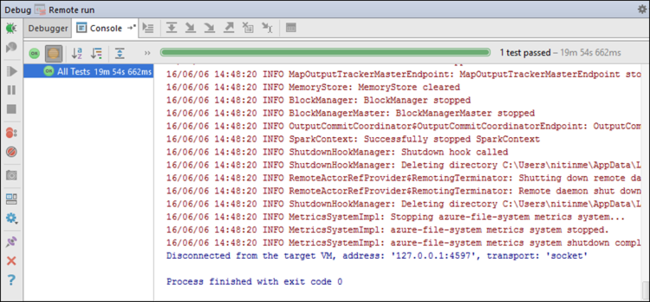
If the application finishes successfully, you should see output like the following:
Next steps
Scenarios
- Apache Spark with BI: Perform interactive data analysis by using Spark in HDInsight with BI tools
- Apache Spark with Machine Learning: Use Spark in HDInsight to analyze building temperature using HVAC data
- Apache Spark with Machine Learning: Use Spark in HDInsight to predict food inspection results
- Website log analysis using Apache Spark in HDInsight
Create and run applications
- Create a standalone application using Scala
- Run jobs remotely on an Apache Spark cluster using Apache Livy
Tools and extensions
- Use Azure Toolkit for IntelliJ to create Apache Spark applications for an HDInsight cluster
- Use Azure Toolkit for IntelliJ to debug Apache Spark applications remotely through SSH
- Use HDInsight Tools in Azure Toolkit for Eclipse to create Apache Spark applications
- Use Apache Zeppelin notebooks with an Apache Spark cluster in HDInsight
- Kernels available for Jupyter Notebook in an Apache Spark cluster for HDInsight
- Use external packages with Jupyter Notebooks
- Install Jupyter on your computer and connect to an HDInsight Spark cluster