注释
请查看 应用洞察 SDK 支持指南,了解我们经典 API SDK 的支持策略。
注意
对于新应用程序或客户,我们建议使用 Azure Monitor OpenTelemetry Distro为 Azure Monitor Application Insights提供支持。 Azure Monitor OpenTelemetry 发行版提供与 Application Insights SDK 类似的功能和体验。 可以使用适用于 .NET、Node.js 和 Python 的迁移指南从 Application Insights SDK 迁移,但我们仍在努力添加更多功能以实现向后兼容性。
本文介绍如何为.NET(ASP.NET、ASP.NET Core和辅助角色服务)和 Node.js 应用程序启用和配置 Application Insights。 Application Insights 可以从应用收集以下遥测数据:
- 请求
- 依赖关系
- 例外
- 性能计数器
- 跟踪(日志)
- 心跳
- 自定义事件和指标 (需要手动检测)
- 页面视图 (需要用于网页的 JavaScript SDK)
- 可用性测试 (需要手动设置可用性测试)
支持的方案
| 已支持 | ASP.NET | ASP.NET Core | 辅助角色服务 |
|---|---|---|---|
| 操作系统 | Windows | Windows、Linux 或 macOS | Windows、Linux 或 macOS |
| 宿主方法 | 进程内(IIS 或 IIS Express) | 进程内或进程外 | 控制台或后台服务(通常通过 dotnet CLI 或 Windows Service/Linux 守护程序运行) |
| 部署方法 | Web 部署、MSI 或手动文件复制 | 框架依赖或自包含 | 框架依赖或自包含 |
| 网页服务器 | Internet Information Services (IIS) | Internet Information Server (IIS) 或 Kestrel | 不适用(无 Web 服务器;专为非 HTTP 工作负载(如消息传送、后台任务和控制台应用)设计) |
| 托管平台 | Azure App Service(Windows)、Azure Virtual Machines或本地服务器 | Azure App Service、Azure Virtual Machines、Docker 和 Azure Kubernetes Service (AKS) 的Web Apps功能 | Azure Virtual Machines、Azure Kubernetes Service (AKS)、容器或支持 .NET Core 的任何环境 |
| .NET 版本 | .NET Framework 4.6.1 及更高版本 | 所有官方支持的 .NET 版本均为非预览版 | 所有官方支持的 .NET 版本均为非预览版 |
Worker Service SDK 本身不执行任何遥测数据收集。 相反,它会引入其他已知的 Application Insights 自动收集器,例如 DependencyCollector、 PerfCounterCollector 和 ApplicationInsightsLoggingProvider。 此 SDK 在 IServiceCollection 上公开扩展方法,以启用和配置遥测收集。
注释
工作服务是一个长时间运行的后台应用程序,用于在 HTTP 请求/响应流程之外执行任务。 适用于辅助角色服务的 Application Insights SDK 可用于新引入的 .NET Core Worker Service、ASP.NET Core 中的后台任务和控制台应用(如 .NET Core 和 .NET Framework)。
添加 Application Insights
本部分内容
先决条件
- Azure订阅。 如果还没有帐户,请创建一个 Azure 帐户。
- 基于 Application Insights 工作区的资源。
- 正常运行的应用程序。
使用 Application Insights SDK 来为应用程序添加监测功能
本部分介绍如何将 Application Insights 添加到基于模板的 Web 应用。
ASP.NET
将以下 NuGet 包及其依赖项添加到项目中:
在某些情况下,系统会自动创建 ApplicationInsights.config 文件。 如果该文件已存在,请跳到步骤 4。
如果没有此模板,请自行创建。 在 ASP.NET 应用程序的根目录中,创建名为 ApplicationInsights.config 的新文件。
将以下 XML 配置复制到新创建的文件中:
展开可查看配置
<?xml version="1.0" encoding="utf-8"?>
<ApplicationInsights xmlns="http://schemas.microsoft.com/ApplicationInsights/2013/Settings">
  <TelemetryInitializers>
    <Add Type="Microsoft.ApplicationInsights.DependencyCollector.HttpDependenciesParsingTelemetryInitializer, Microsoft.AI.DependencyCollector" />
    <Add Type="Microsoft.ApplicationInsights.WindowsServer.AzureRoleEnvironmentTelemetryInitializer, Microsoft.AI.WindowsServer" />
    <Add Type="Microsoft.ApplicationInsights.WindowsServer.BuildInfoConfigComponentVersionTelemetryInitializer, Microsoft.AI.WindowsServer" />
    <Add Type="Microsoft.ApplicationInsights.Web.WebTestTelemetryInitializer, Microsoft.AI.Web" />
    <Add Type="Microsoft.ApplicationInsights.Web.SyntheticUserAgentTelemetryInitializer, Microsoft.AI.Web">
      <!-- Extended list of bots:
            search|spider|crawl|Bot|Monitor|BrowserMob|BingPreview|PagePeeker|WebThumb|URL2PNG|ZooShot|GomezA|Google SketchUp|Read Later|KTXN|KHTE|Keynote|Pingdom|AlwaysOn|zao|borg|oegp|silk|Xenu|zeal|NING|htdig|lycos|slurp|teoma|voila|yahoo|Sogou|CiBra|Nutch|Java|JNLP|Daumoa|Genieo|ichiro|larbin|pompos|Scrapy|snappy|speedy|vortex|favicon|indexer|Riddler|scooter|scraper|scrubby|WhatWeb|WinHTTP|voyager|archiver|Icarus6j|mogimogi|Netvibes|altavista|charlotte|findlinks|Retreiver|TLSProber|WordPress|wsr-agent|http client|Python-urllib|AppEngine-Google|semanticdiscovery|facebookexternalhit|web/snippet|Google-HTTP-Java-Client-->
      <Filters>search|spider|crawl|Bot|Monitor|AlwaysOn</Filters>
    </Add>
    <Add Type="Microsoft.ApplicationInsights.Web.ClientIpHeaderTelemetryInitializer, Microsoft.AI.Web" />
    <Add Type="Microsoft.ApplicationInsights.Web.AzureAppServiceRoleNameFromHostNameHeaderInitializer, Microsoft.AI.Web" />
    <Add Type="Microsoft.ApplicationInsights.Web.OperationNameTelemetryInitializer, Microsoft.AI.Web" />
    <Add Type="Microsoft.ApplicationInsights.Web.OperationCorrelationTelemetryInitializer, Microsoft.AI.Web" />
    <Add Type="Microsoft.ApplicationInsights.Web.UserTelemetryInitializer, Microsoft.AI.Web" />
    <Add Type="Microsoft.ApplicationInsights.Web.AuthenticatedUserIdTelemetryInitializer, Microsoft.AI.Web" />
    <Add Type="Microsoft.ApplicationInsights.Web.AccountIdTelemetryInitializer, Microsoft.AI.Web" />
    <Add Type="Microsoft.ApplicationInsights.Web.SessionTelemetryInitializer, Microsoft.AI.Web" />
  </TelemetryInitializers>
  <TelemetryModules>
    <Add Type="Microsoft.ApplicationInsights.DependencyCollector.DependencyTrackingTelemetryModule, Microsoft.AI.DependencyCollector">
      <ExcludeComponentCorrelationHttpHeadersOnDomains>
        <!--
        Requests to the following hostnames will not be modified by adding correlation headers.
        Add entries here to exclude additional hostnames.
        NOTE: this configuration will be lost upon NuGet upgrade.
        -->
        <Add>core.chinacloudapi.cn</Add>
        <Add>core.chinacloudapi.cn</Add>
        <Add>core.cloudapi.de</Add>
        <Add>core.usgovcloudapi.net</Add>
      </ExcludeComponentCorrelationHttpHeadersOnDomains>
      <IncludeDiagnosticSourceActivities>
        <Add>Microsoft.Azure.EventHubs</Add>
        <Add>Azure.Messaging.ServiceBus</Add>
      </IncludeDiagnosticSourceActivities>
    </Add>
    <Add Type="Microsoft.ApplicationInsights.Extensibility.PerfCounterCollector.PerformanceCollectorModule, Microsoft.AI.PerfCounterCollector">
      <!--
      Use the following syntax here to collect additional performance counters:

      <Counters>
        <Add PerformanceCounter="\Process(??APP_WIN32_PROC??)\Handle Count" ReportAs="Process handle count" />
        ...
      </Counters>

      PerformanceCounter must be either \CategoryName(InstanceName)\CounterName or \CategoryName\CounterName

      NOTE: performance counters configuration will be lost upon NuGet upgrade.

      The following placeholders are supported as InstanceName:
        ??APP_WIN32_PROC?? - instance name of the application process for Win32 counters.
        ??APP_W3SVC_PROC?? - instance name of the application IIS worker process for IIS/ASP.NET counters.
        ??APP_CLR_PROC?? - instance name of the application CLR process for .NET counters.
      -->
    </Add>
    <Add Type="Microsoft.ApplicationInsights.Extensibility.PerfCounterCollector.QuickPulse.QuickPulseTelemetryModule, Microsoft.AI.PerfCounterCollector" />
    <Add Type="Microsoft.ApplicationInsights.WindowsServer.AppServicesHeartbeatTelemetryModule, Microsoft.AI.WindowsServer" />
    <Add Type="Microsoft.ApplicationInsights.WindowsServer.AzureInstanceMetadataTelemetryModule, Microsoft.AI.WindowsServer">
      <!--
      Remove individual fields collected here by adding them to the ApplicationInsighs.HeartbeatProvider
      with the following syntax:

      <Add Type="Microsoft.ApplicationInsights.Extensibility.Implementation.Tracing.DiagnosticsTelemetryModule, Microsoft.ApplicationInsights">
        <ExcludedHeartbeatProperties>
          <Add>osType</Add>
          <Add>location</Add>
          <Add>name</Add>
          <Add>offer</Add>
          <Add>platformFaultDomain</Add>
          <Add>platformUpdateDomain</Add>
          <Add>publisher</Add>
          <Add>sku</Add>
          <Add>version</Add>
          <Add>vmId</Add>
          <Add>vmSize</Add>
          <Add>subscriptionId</Add>
          <Add>resourceGroupName</Add>
          <Add>placementGroupId</Add>
          <Add>tags</Add>
          <Add>vmScaleSetName</Add>
        </ExcludedHeartbeatProperties>
      </Add>

      NOTE: exclusions will be lost upon upgrade.
      -->
    </Add>
    <Add Type="Microsoft.ApplicationInsights.WindowsServer.DeveloperModeWithDebuggerAttachedTelemetryModule, Microsoft.AI.WindowsServer" />
    <Add Type="Microsoft.ApplicationInsights.WindowsServer.UnhandledExceptionTelemetryModule, Microsoft.AI.WindowsServer" />
    <Add Type="Microsoft.ApplicationInsights.WindowsServer.UnobservedExceptionTelemetryModule, Microsoft.AI.WindowsServer">
      <!--</Add>
    <Add Type="Microsoft.ApplicationInsights.WindowsServer.FirstChanceExceptionStatisticsTelemetryModule, Microsoft.AI.WindowsServer">-->
    </Add>
    <Add Type="Microsoft.ApplicationInsights.Web.RequestTrackingTelemetryModule, Microsoft.AI.Web">
      <Handlers>
        <!--
        Add entries here to filter out additional handlers:

        NOTE: handler configuration will be lost upon NuGet upgrade.
        -->
        <Add>Microsoft.VisualStudio.Web.PageInspector.Runtime.Tracing.RequestDataHttpHandler</Add>
        <Add>System.Web.StaticFileHandler</Add>
        <Add>System.Web.Handlers.AssemblyResourceLoader</Add>
        <Add>System.Web.Optimization.BundleHandler</Add>
        <Add>System.Web.Script.Services.ScriptHandlerFactory</Add>
        <Add>System.Web.Handlers.TraceHandler</Add>
        <Add>System.Web.Services.Discovery.DiscoveryRequestHandler</Add>
        <Add>System.Web.HttpDebugHandler</Add>
      </Handlers>
    </Add>
    <Add Type="Microsoft.ApplicationInsights.Web.ExceptionTrackingTelemetryModule, Microsoft.AI.Web" />
    <Add Type="Microsoft.ApplicationInsights.Web.AspNetDiagnosticTelemetryModule, Microsoft.AI.Web" />
  </TelemetryModules>
  <ApplicationIdProvider Type="Microsoft.ApplicationInsights.Extensibility.Implementation.ApplicationId.ApplicationInsightsApplicationIdProvider, Microsoft.ApplicationInsights" />
  <TelemetrySinks>
    <Add Name="default">
      <TelemetryProcessors>
        <Add Type="Microsoft.ApplicationInsights.Extensibility.PerfCounterCollector.QuickPulse.QuickPulseTelemetryProcessor, Microsoft.AI.PerfCounterCollector" />
        <Add Type="Microsoft.ApplicationInsights.Extensibility.AutocollectedMetricsExtractor, Microsoft.ApplicationInsights" />
        <Add Type="Microsoft.ApplicationInsights.WindowsServer.TelemetryChannel.AdaptiveSamplingTelemetryProcessor, Microsoft.AI.ServerTelemetryChannel">
          <MaxTelemetryItemsPerSecond>5</MaxTelemetryItemsPerSecond>
          <ExcludedTypes>Event</ExcludedTypes>
        </Add>
        <Add Type="Microsoft.ApplicationInsights.WindowsServer.TelemetryChannel.AdaptiveSamplingTelemetryProcessor, Microsoft.AI.ServerTelemetryChannel">
          <MaxTelemetryItemsPerSecond>5</MaxTelemetryItemsPerSecond>
          <IncludedTypes>Event</IncludedTypes>
        </Add>
        <!--
          Adjust the include and exclude examples to specify the desired semicolon-delimited types. (Dependency, Event, Exception, PageView, Request, Trace)
        -->
      </TelemetryProcessors>
      <TelemetryChannel Type="Microsoft.ApplicationInsights.WindowsServer.TelemetryChannel.ServerTelemetryChannel, Microsoft.AI.ServerTelemetryChannel" />
    </Add>
  </TelemetrySinks>
  <!--
    Learn more about Application Insights configuration with ApplicationInsights.config here:
    http://go.microsoft.com/fwlink/?LinkID=513840
  -->
  <ConnectionString>Copy the connection string from your Application Insights resource</ConnectionString>
</ApplicationInsights>
添加连接字符串,可以通过以下两种方式完成:
(建议)在配置中设置connection string。
在
ApplicationInsights.config 中结束标记之前,添加 Application Insights 资源的连接字符串。 可以在新创建的 Application Insights 资源的概述窗格中找到您的连接字符串。 <ConnectionString>Copy the connection string from your Application Insights resource</ConnectionString>在代码中设置连接字符串。
在 program.cs 类中提供connection string。
var configuration = new TelemetryConfiguration
{
    ConnectionString = "Copy the connection string from your Application Insights resource"
};
在项目中与 ApplicationInsights.config 文件相同的级别,创建包含名为 AiHandleErrorAttribute.cs 的新 C# 文件的文件夹,将其命名为 ErrorHandler。 该文件的内容如下所示:
using System;
using System.Web.Mvc;
using Microsoft.ApplicationInsights;

namespace WebApplication10.ErrorHandler //namespace will vary based on your project name
{
    [AttributeUsage(AttributeTargets.Class | AttributeTargets.Method, Inherited = true, AllowMultiple = true)]
    public class AiHandleErrorAttribute : HandleErrorAttribute
    {
        public override void OnException(ExceptionContext filterContext)
        {
            if (filterContext != null && filterContext.HttpContext != null && filterContext.Exception != null)
            {
                //If customError is Off, then AI HTTPModule will report the exception
                if (filterContext.HttpContext.IsCustomErrorEnabled)
                {
                    var ai = new TelemetryClient();
                    ai.TrackException(filterContext.Exception);
                }
            }
            base.OnException(filterContext);
        }
    }
}
在 App_Start 文件夹中,打开 FilterConfig.cs 文件,并更改该文件以匹配示例:
using System.Web;
using System.Web.Mvc;

namespace WebApplication10 //Namespace will vary based on project name
{
    public class FilterConfig
    {
        public static void RegisterGlobalFilters(GlobalFilterCollection filters)
        {
            filters.Add(new ErrorHandler.AiHandleErrorAttribute());
        }
    }
}
如果 Web.config 已更新,请跳过此步骤。 否则,按如下所示更新文件:
展开可查看配置
<?xml version="1.0" encoding="utf-8"?> <!-- For more information on how to configure your ASP.NET application, please visit https://go.microsoft.com/fwlink/?LinkId=301880 --> <configuration> <appSettings> <add key="webpages:Version" value="3.0.0.0" /> <add key="webpages:Enabled" value="false" /> <add key="ClientValidationEnabled" value="true" /> <add key="UnobtrusiveJavaScriptEnabled" value="true" /> </appSettings> <system.web> <compilation debug="true" targetFramework="4.7.2" /> <httpRuntime targetFramework="4.7.2" /> <!-- Code added for Application Insights start --> <httpModules> <add name="TelemetryCorrelationHttpModule" type="Microsoft.AspNet.TelemetryCorrelation.TelemetryCorrelationHttpModule, Microsoft.AspNet.TelemetryCorrelation" /> <add name="ApplicationInsightsWebTracking" type="Microsoft.ApplicationInsights.Web.ApplicationInsightsHttpModule, Microsoft.AI.Web" /> </httpModules> <!-- Code added for Application Insights end --> </system.web> <runtime> <assemblyBinding xmlns="urn:schemas-microsoft-com:asm.v1"> <dependentAssembly> <assemblyIdentity name="Antlr3.Runtime" publicKeyToken="eb42632606e9261f" /> <bindingRedirect oldVersion="0.0.0.0-3.5.0.2" newVersion="3.5.0.2" /> </dependentAssembly> <dependentAssembly> <assemblyIdentity name="Newtonsoft.Json" publicKeyToken="30ad4fe6b2a6aeed" /> <bindingRedirect oldVersion="0.0.0.0-12.0.0.0" newVersion="12.0.0.0" /> </dependentAssembly> <dependentAssembly> <assemblyIdentity name="System.Web.Optimization" publicKeyToken="31bf3856ad364e35" /> <bindingRedirect oldVersion="1.0.0.0-1.1.0.0" newVersion="1.1.0.0" /> </dependentAssembly> <dependentAssembly> <assemblyIdentity name="WebGrease" publicKeyToken="31bf3856ad364e35" /> <bindingRedirect oldVersion="0.0.0.0-1.6.5135.21930" newVersion="1.6.5135.21930" /> </dependentAssembly> <dependentAssembly> <assemblyIdentity name="System.Web.Helpers" publicKeyToken="31bf3856ad364e35" /> <bindingRedirect oldVersion="1.0.0.0-3.0.0.0" newVersion="3.0.0.0" /> </dependentAssembly> <dependentAssembly> <assemblyIdentity name="System.Web.WebPages" publicKeyToken="31bf3856ad364e35" /> <bindingRedirect oldVersion="1.0.0.0-3.0.0.0" newVersion="3.0.0.0" /> </dependentAssembly> <dependentAssembly> <assemblyIdentity name="System.Web.Mvc" publicKeyToken="31bf3856ad364e35" /> <bindingRedirect oldVersion="1.0.0.0-5.2.7.0" newVersion="5.2.7.0" /> </dependentAssembly> <!-- Code added for Application Insights start --> <dependentAssembly> <assemblyIdentity name="System.Memory" publicKeyToken="cc7b13ffcd2ddd51" culture="neutral" /> <bindingRedirect oldVersion="0.0.0.0-4.0.1.1" newVersion="4.0.1.1" /> </dependentAssembly> <!-- Code added for Application Insights end --> </assemblyBinding> </runtime> <system.codedom> <compilers> <compiler language="c#;cs;csharp" extension=".cs" type="Microsoft.CodeDom.Providers.DotNetCompilerPlatform.CSharpCodeProvider, Microsoft.CodeDom.Providers.DotNetCompilerPlatform, Version=2.0.1.0, Culture=neutral, PublicKeyToken=31bf3856ad364e35" warningLevel="4" compilerOptions="/langversion:default /nowarn:1659;1699;1701" /> <compiler language="vb;vbs;visualbasic;vbscript" extension=".vb" type="Microsoft.CodeDom.Providers.DotNetCompilerPlatform.VBCodeProvider, Microsoft.CodeDom.Providers.DotNetCompilerPlatform, Version=2.0.1.0, Culture=neutral, PublicKeyToken=31bf3856ad364e35" warningLevel="4" compilerOptions="/langversion:default /nowarn:41008 /define:_MYTYPE=\"Web\" /optionInfer+" /> </compilers> </system.codedom> <system.webServer> <validation validateIntegratedModeConfiguration="false" /> <!-- Code added for Application Insights start --> <modules> <remove name="TelemetryCorrelationHttpModule" /> <add name="TelemetryCorrelationHttpModule" type="Microsoft.AspNet.TelemetryCorrelation.TelemetryCorrelationHttpModule, Microsoft.AspNet.TelemetryCorrelation" preCondition="managedHandler" /> <remove name="ApplicationInsightsWebTracking" /> <add name="ApplicationInsightsWebTracking" type="Microsoft.ApplicationInsights.Web.ApplicationInsightsHttpModule, Microsoft.AI.Web" preCondition="managedHandler" /> </modules> <!-- Code added for Application Insights end --> </system.webServer> </configuration>
现在已成功配置服务器端应用程序监视。 如果运行 Web 应用,你将会看到遥测数据开始出现在 Application Insights 中。
ASP.NET Core
安装适用于 ASP.NET Core 的 Application Insights SDK NuGet 包。
我们建议始终使用最新稳定版本。 在 open-source GitHub 存储库上查找 SDK 的完整发行说明。
以下代码示例演示了要添加到项目的 .csproj 文件中的更改:
<ItemGroup>
    <PackageReference Include="Microsoft.ApplicationInsights.AspNetCore" Version="2.21.0" />
</ItemGroup>
将
AddApplicationInsightsTelemetry()添加到你的 program.cs 类。在
builder.Services.AddApplicationInsightsTelemetry();方法后添加WebApplication.CreateBuilder(),如以下示例所示:// This method gets called by the runtime. Use this method to add services to the container. var builder = WebApplication.CreateBuilder(args); // The following line enables Application Insights telemetry collection. builder.Services.AddApplicationInsightsTelemetry(); // This code adds other services for your application. builder.Services.AddMvc(); var app = builder.Build();添加连接字符串的操作可通过三种方式完成:
(建议)在配置中设置connection string。
在 appsettings.json 中设置connection string,并确保配置文件在发布期间复制到应用程序根文件夹。
{
    "Logging": {
        "LogLevel": {
            "Default": "Information",
            "Microsoft.AspNetCore": "Warning"
        }
    },
    "AllowedHosts": "*",
    "ApplicationInsights": {
        "ConnectionString": "<YOUR-CONNECTION-STRING>"
    }
}
将连接字符串设置在
APPLICATIONINSIGHTS_CONNECTION_STRING环境变量中或ApplicationInsights:ConnectionStringJSON 配置文件中。例如:
SET ApplicationInsights:ConnectionString = <Copy connection string from Application Insights Resource Overview>SET APPLICATIONINSIGHTS_CONNECTION_STRING = <Copy connection string from Application Insights Resource Overview>- 通常,
APPLICATIONINSIGHTS_CONNECTION_STRING在 Web 应用中使用。 它也可以在所有支持此 SDK 的地方使用。
注释
代码中指定的connection string将战胜环境变量
APPLICATIONINSIGHTS_CONNECTION_STRING,该变量将战胜其他选项。在代码中设置连接字符串。
在
ApplicationInsightsServiceOptions类中的AddApplicationInsightsTelemetry参数部分,为 提供一个连接字符串。
用户机密和其他配置提供程序
如果要将连接字符串存储在 ASP.NET Core 用户机密中,或者从另一个配置提供程序中检索,可以使用带有 Microsoft.Extensions.Configuration.IConfiguration 参数的重载。 示例参数为 services.AddApplicationInsightsTelemetry(Configuration);。
在 Microsoft.ApplicationInsights.AspNetCore 版本 2.15.0 及更高版本中,调用 services.AddApplicationInsightsTelemetry() 会自动从应用程序的 Microsoft.Extensions.Configuration.IConfiguration 读取connection string。 无需显式提供 IConfiguration。
如果 IConfiguration 从多个提供程序加载了配置,则 services.AddApplicationInsightsTelemetry 从 appsettings.json确定配置优先级,而不考虑添加提供程序的顺序。 使用 services.AddApplicationInsightsTelemetry(IConfiguration) 方法从 IConfiguration 读取配置,而无需对 appsettings.json 进行这种优先处理。
辅助角色服务
本部分内容
- 使用 Application Insights SDK 用于 Worker Service
- .NET Core Worker Service 应用程序
- 使用托管服务执行ASP.NET Core后台任务
- .NET Core/.NET Framework 控制台应用程序
使用 Application Insights SDK 用于 Worker Service
将 Microsoft.ApplicationInsights.WorkerService 包安装到应用程序。
以下代码片段显示了必须添加到项目
.csproj文件的更改:<ItemGroup> <PackageReference Include="Microsoft.ApplicationInsights.WorkerService" Version="2.22.0" /> </ItemGroup>将连接字符串配置在
APPLICATIONINSIGHTS_CONNECTION_STRING环境变量或配置(appsettings.json)中。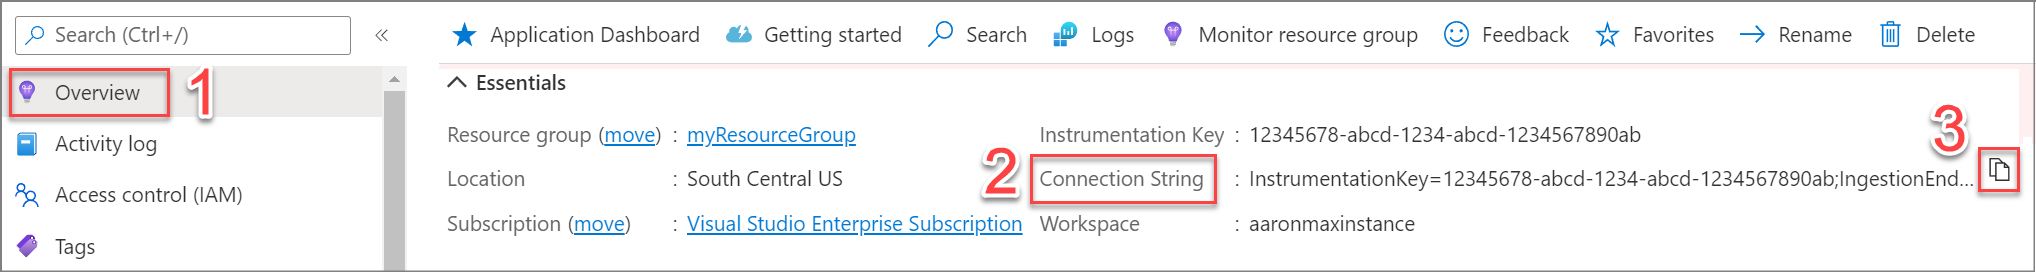
通过调用
ILogger或使用构造函数注入,从依赖注入(DI)容器中检索TelemetryClient实例或serviceProvider.GetRequiredService<TelemetryClient>();实例。 此步骤会触发TelemetryConfiguration和自动收集模块的设置。

以下各节介绍了每种应用程序类型的具体说明。
.NET Core Worker Service 应用程序
完整示例在 NuGet 网站上共享。
使用 Visual Studio 新项目模板或命令行
dotnet new worker创建一个新的 Worker 服务项目。将 Microsoft.ApplicationInsights.WorkerService 包添加到应用程序。
services.AddApplicationInsightsTelemetryWorkerService();添加到CreateHostBuilder()类的Program.cs方法中,如下示例所示:public static IHostBuilder CreateHostBuilder(string[] args) => Host.CreateDefaultBuilder(args) .ConfigureServices((hostContext, services) => { services.AddHostedService<Worker>(); services.AddApplicationInsightsTelemetryWorkerService(); });请根据以下示例修改您的
Worker.cs。using Microsoft.ApplicationInsights; using Microsoft.ApplicationInsights.DataContracts; public class Worker : BackgroundService { private readonly ILogger<Worker> _logger; private TelemetryClient _telemetryClient; private static HttpClient _httpClient = new HttpClient(); public Worker(ILogger<Worker> logger, TelemetryClient tc) { _logger = logger; _telemetryClient = tc; } protected override async Task ExecuteAsync(CancellationToken stoppingToken) { while (!stoppingToken.IsCancellationRequested) { _logger.LogInformation("Worker running at: {time}", DateTimeOffset.Now); using (_telemetryClient.StartOperation<RequestTelemetry>("operation")) { _logger.LogWarning("A sample warning message. By default, logs with severity Warning or higher is captured by Application Insights"); _logger.LogInformation("Calling bing.com"); var res = await _httpClient.GetAsync("https://bing.com"); _logger.LogInformation("Calling bing completed with status:" + res.StatusCode); _telemetryClient.TrackEvent("Bing call event completed"); } await Task.Delay(1000, stoppingToken); } } }设置连接字符串。
注释
建议在配置中指定连接字符串。 下面的代码示例演示如何在
appsettings.json中指定connection string。 请确保appsettings.json在发布期间复制到应用程序根文件夹。{ "ApplicationInsights": { "ConnectionString" : "<YOUR-CONNECTION-STRING>" }, "Logging": { "LogLevel": { "Default": "Warning" } } }
或者,在 APPLICATIONINSIGHTS_CONNECTION_STRING 环境变量中指定connection string。
通常,APPLICATIONINSIGHTS_CONNECTION_STRING 指定了部署到 Web 应用的应用程序作为 Web 作业的连接字符串。
注释
代码中指定的connection string优先于环境变量 APPLICATIONINSIGHTS_CONNECTION_STRING,后者优先于其他选项。
ASP.NET Core 后台任务使用托管服务
本文档介绍如何在 ASP.NET Core应用程序中创建后台任务。
在此 GitHub 页面共享完整示例。
将 Microsoft.ApplicationInsights.WorkerService 包安装到应用程序。
将
services.AddApplicationInsightsTelemetryWorkerService();添加到ConfigureServices()方法,参见以下示例:public static async Task Main(string[] args) { var host = new HostBuilder() .ConfigureAppConfiguration((hostContext, config) => { config.AddJsonFile("appsettings.json", optional: true); }) .ConfigureServices((hostContext, services) => { services.AddLogging(); services.AddHostedService<TimedHostedService>(); // connection string is read automatically from appsettings.json services.AddApplicationInsightsTelemetryWorkerService(); }) .UseConsoleLifetime() .Build(); using (host) { // Start the host await host.StartAsync(); // Wait for the host to shutdown await host.WaitForShutdownAsync(); } }以下代码适用于
TimedHostedService后台任务逻辑所在的位置:using Microsoft.ApplicationInsights; using Microsoft.ApplicationInsights.DataContracts; public class TimedHostedService : IHostedService, IDisposable { private readonly ILogger _logger; private Timer _timer; private TelemetryClient _telemetryClient; private static HttpClient httpClient = new HttpClient(); public TimedHostedService(ILogger<TimedHostedService> logger, TelemetryClient tc) { _logger = logger; this._telemetryClient = tc; } public Task StartAsync(CancellationToken cancellationToken) { _logger.LogInformation("Timed Background Service is starting."); _timer = new Timer(DoWork, null, TimeSpan.Zero, TimeSpan.FromSeconds(1)); return Task.CompletedTask; } private void DoWork(object state) { _logger.LogInformation("Worker running at: {time}", DateTimeOffset.Now); using (_telemetryClient.StartOperation<RequestTelemetry>("operation")) { _logger.LogWarning("A sample warning message. By default, logs with severity Warning or higher is captured by Application Insights"); _logger.LogInformation("Calling bing.com"); var res = httpClient.GetAsync("https://bing.com").GetAwaiter().GetResult(); _logger.LogInformation("Calling bing completed with status:" + res.StatusCode); _telemetryClient.TrackEvent("Bing call event completed"); } } }
.NET Core/.NET Framework 控制台应用程序
如本文开头所述,新包可用于从常规控制台应用程序启用 Application Insights 遥测。 此包面向 netstandard2.0,因此可用于 .NET Core 或更高版本中的控制台应用,以及 .NET Framework 或更高版本。
在此 GitHub 页面共享完整示例。
将 Microsoft.ApplicationInsights.WorkerService 包安装到应用程序。
修改 Program.cs ,如以下示例所示:
    using Microsoft.ApplicationInsights;
    using Microsoft.ApplicationInsights.DataContracts;
    using Microsoft.ApplicationInsights.WorkerService;
    using Microsoft.Extensions.DependencyInjection;
    using Microsoft.Extensions.Logging;
    using System;
    using System.Net.Http;
    using System.Threading.Tasks;

    namespace WorkerSDKOnConsole
    {
        class Program
        {
            static async Task Main(string[] args)
            {
                // Create the DI container.
                IServiceCollection services = new ServiceCollection();

                // Being a regular console app, there is no appsettings.json or configuration providers enabled by default.
                // Hence connection string and any changes to default logging level must be specified here.
                services.AddLogging(loggingBuilder => loggingBuilder.AddFilter<Microsoft.Extensions.Logging.ApplicationInsights.ApplicationInsightsLoggerProvider>("Category", LogLevel.Information));
                services.AddApplicationInsightsTelemetryWorkerService((ApplicationInsightsServiceOptions options) => options.ConnectionString = "<YOUR-CONNECTION-STRING>");

                // To pass a connection string
                // - aiserviceoptions must be created
                // - set connectionstring on it
                // - pass it to AddApplicationInsightsTelemetryWorkerService()

                // Build ServiceProvider.
                IServiceProvider serviceProvider = services.BuildServiceProvider();

                // Obtain logger instance from DI.
                ILogger<Program> logger = serviceProvider.GetRequiredService<ILogger<Program>>();

                // Obtain TelemetryClient instance from DI, for additional manual tracking or to flush.
                var telemetryClient = serviceProvider.GetRequiredService<TelemetryClient>();

                var httpClient = new HttpClient();

                while (true) // This app runs indefinitely. Replace with actual application termination logic.
                {
                    logger.LogInformation("Worker running at: {time}", DateTimeOffset.Now);

                    // Replace with a name which makes sense for this operation.
                    using (telemetryClient.StartOperation<RequestTelemetry>("operation"))
                    {
                        logger.LogWarning("A sample warning message. By default, logs with severity Warning or higher is captured by Application Insights");
                        logger.LogInformation("Calling bing.com");
                        var res = await httpClient.GetAsync("https://bing.com");
                        logger.LogInformation("Calling bing completed with status:" + res.StatusCode);
                        telemetryClient.TrackEvent("Bing call event completed");
                    }

                    await Task.Delay(1000);
                }

                // Explicitly call Flush() followed by sleep is required in console apps.
                // This is to ensure that even if application terminates, telemetry is sent to the back-end.
                telemetryClient.Flush();
                Task.Delay(5000).Wait();
            }
        }
    }
此控制台应用程序也使用相同的默认值 TelemetryConfiguration。 可以采用与前面部分中的示例相同的方式对其进行自定义。
为本地服务器部署 Application Insights 代理
本部分内容
Application Insights 代理是一个发布到 PowerShell Gallery 的 PowerShell 模块。 它将替换状态监视器。 遥测会发送到 Azure 门户,可在其中监控应用。
有关支持的 自动化监控 场景的完整列表,请参阅 支持的环境、语言和资源提供程序。
注释
当前该模块支持对使用 Internet Information Server (IIS) 托管的 ASP.NET 和 ASP.NET Core Web 应用程序进行无代码监测。 使用 SDK 检测 Java 和 Node.js 应用程序。
注释
默认情况下,ASP.NET Core 应用启用客户端监视。 如果要禁用客户端监视,请使用以下信息在服务器中定义环境变量:
-
名称:
APPINSIGHTS_JAVASCRIPT_ENABLED -
价值:
false
入门
本部分包含预期适用于大多数环境的快速入门命令。 这些说明依赖于 PowerShell Gallery 来分发更新。 这些命令支持 PowerShell -Proxy 参数。
有关这些命令的说明、自定义说明以及有关故障排除的信息,请参阅详细说明。
如果没有 Azure 订阅,可在开始前创建一个试用帐户。
选项 1:通过 PowerShell Gallery 下载并安装 Application Insights Agent
注释
有关可能需要的先决条件,请参阅 PowerShell Gallery 传输层安全性 (TLS) 支持。
安装模块(以管理员身份运行):
Set-ExecutionPolicy -ExecutionPolicy RemoteSigned -Scope Process -Force
Install-PackageProvider -Name NuGet -MinimumVersion 2.8.5.201 -Force
Set-PSRepository -Name "PSGallery" -InstallationPolicy Trusted
Install-Module -Name PowerShellGet -Force
安装 Application Insights 代理(以管理员身份运行):
Set-ExecutionPolicy -ExecutionPolicy RemoteSigned -Scope Process -Force Install-Module -Name Az.ApplicationMonitor -AllowPrerelease -AcceptLicense启用监视:
Set-ExecutionPolicy -ExecutionPolicy RemoteSigned -Scope Process -Force
Enable-ApplicationInsightsMonitoring -ConnectionString 'InstrumentationKey=00000000-0000-0000-0000-000000000000;IngestionEndpoint=https://xxxx.applicationinsights.azure.cn/'
选项 2:手动下载并安装 Application Insights 代理(脱机选项)
从 PowerShell Gallery 手动下载模块的最新版本。
解压缩并安装 Application Insights 代理:
$pathToNupkg = "C:\Users\t\Desktop\Az.ApplicationMonitor.0.3.0-alpha.nupkg"
$pathToZip = ([io.path]::ChangeExtension($pathToNupkg, "zip"))
$pathToNupkg | rename-item -newname $pathToZip
$pathInstalledModule = "$Env:ProgramFiles\WindowsPowerShell\Modules\Az.ApplicationMonitor"
Expand-Archive -LiteralPath $pathToZip -DestinationPath $pathInstalledModule
启用监视:
Enable-ApplicationInsightsMonitoring -ConnectionString 'InstrumentationKey=00000000-0000-0000-0000-000000000000;IngestionEndpoint=https://xxxx.applicationinsights.azure.cn/'
详细说明
本部分介绍如何加入 PowerShell 画廊并下载 “ApplicationMonitor” 模块。 包含了开始使用所需的最常见参数。 我们还提供手动下载说明,以防你无法访问 Internet。
以管理员身份使用提升的执行策略运行 PowerShell
重要
PowerShell 需要拥有管理员级别的权限才能对计算机进行更改。
执行策略
- 说明:默认禁用 PowerShell 脚本的运行。 我们建议仅允许在当前作用域运行 "RemoteSigned" 脚本。
- 参考:关于执行策略和 Set-ExecutionPolicy。
- 命令:
Set-ExecutionPolicy -ExecutionPolicy RemoteSigned -Scope Process。 - 可选参数:
-
-Force。 跳过确认提示。
-
示例错误
Install-Module : The 'Install-Module' command was found in the module 'PowerShellGet', but the module could not be
loaded. For more information, run 'Import-Module PowerShellGet'.

Import-Module : File C:\Program Files\WindowsPowerShell\Modules\PackageManagement\1.3.1\PackageManagement.psm1 cannot
be loaded because running scripts is disabled on this system. For more information, see about_Execution_Policies at https://go.microsoft.com/fwlink/?LinkID=135170.
PowerShell 先决条件
运行 $PSVersionTable 命令,审核 PowerShell 的实例。
该命令生成以下输出:
Name                           Value
----                           -----
PSVersion                      5.1.17763.316
PSEdition                      Desktop
PSCompatibleVersions           {1.0, 2.0, 3.0, 4.0...}
BuildVersion                   10.0.17763.316
CLRVersion                     4.0.30319.42000
WSManStackVersion              3.0
PSRemotingProtocolVersion      2.3
SerializationVersion           1.1.0.1
这些说明是在运行 Windows 10 和以下版本的计算机上编写和测试的。
PowerShell Gallery的先决条件
这些步骤准备服务器以从PowerShell Gallery下载模块。
注释
PowerShell 图库支持 Windows 10、Windows Server 2016 和 PowerShell 6+。 有关早期版本的信息,请参阅安装 PowerShellGet。
以管理员身份使用提升的执行策略运行 PowerShell。
安装 NuGet 包提供程序。
- 说明:需要此提供程序才能与基于 NuGet 的存储库(如 PowerShell Gallery)进行交互。
- 参考:Install-PackageProvider。
- 命令:
Install-PackageProvider -Name NuGet -MinimumVersion 2.8.5.201。 - 可选参数:
-
-Proxy。 指定请求的代理服务器。 -
-Force。 跳过确认提示。
-
如果未设置 NuGet,则会看到此提示:
NuGet provider is required to continue
PowerShellGet requires NuGet provider version '2.8.5.201' or newer to interact with NuGet-based repositories.
The NuGet provider must be available in 'C:\Program Files\PackageManagement\ProviderAssemblies' or
'C:\Users\t\AppData\Local\PackageManagement\ProviderAssemblies'. You can also install the NuGet provider by running
'Install-PackageProvider -Name NuGet -MinimumVersion 2.8.5.201 -Force'. Do you want PowerShellGet to install and import
the NuGet provider now?
[Y] Yes  [N] No  [S] Suspend  [?] Help (default is "Y"):
将 PowerShell Gallery 配置为信任的存储库。
- 说明:默认情况下,PowerShell Gallery 是一个不受信任的存储库。
- 参考:Set-PSRepository。
- 命令:
Set-PSRepository -Name "PSGallery" -InstallationPolicy Trusted。 - 可选参数:
-
-Proxy。 指定请求的代理服务器。
-
如果 PowerShell Gallery 不受信任,则会看到此提示:
Untrusted repository
You are installing the modules from an untrusted repository.
If you trust this repository, change its InstallationPolicy value
by running the Set-PSRepository cmdlet. Are you sure you want to
install the modules from 'PSGallery'?
[Y] Yes  [A] Yes to All  [N] No  [L] No to All  [S] Suspend  [?] Help (default is "N"):
可以通过运行
PSRepositories命令来确认此更改并审核所有Get-PSRepository。安装最新版本的 PowerShellGet。
- 说明:此模块包含用于从PowerShell Gallery获取其他模块的工具。 版本 1.0.0.1 与 Windows 10 和 Windows Server 一起发布。 需要 1.6.0 或更高版本。 若要确定安装了哪个版本,请运行
Get-Command -Module PowerShellGet命令。 - 参考:安装 PowerShellGet。
- 命令:
Install-Module -Name PowerShellGet。 - 可选参数:
-
-Proxy。 指定请求的代理服务器。 -
-Force。 忽略“已安装”警告并安装最新版本。
-
如果使用的不是最新 PowerShellGet 版本,则会看到此错误:
Install-Module : A parameter cannot be found that matches parameter name 'AllowPrerelease'. At line:1 char:20 Install-Module abc -AllowPrerelease ~~~~~~~~~~~~~~~~ CategoryInfo : InvalidArgument: (:) [Install-Module], ParameterBindingException FullyQualifiedErrorId : NamedParameterNotFound,Install-Module- 说明:此模块包含用于从PowerShell Gallery获取其他模块的工具。 版本 1.0.0.1 与 Windows 10 和 Windows Server 一起发布。 需要 1.6.0 或更高版本。 若要确定安装了哪个版本,请运行
重启 PowerShell。 无法在当前会话中加载新版本。 新的 PowerShell 会话加载新版的 PowerShellGet。
选项 1:通过 PowerShell Gallery 下载并安装模块
这些步骤从 PowerShell Gallery 下载 Az.ApplicationMonitor 模块。
- 确保满足PowerShell Gallery的所有先决条件。
- 以管理员身份使用提升的执行策略运行 PowerShell。
- 安装 Az.ApplicationMonitor 模块。
- 参考:Install-Module。
- 命令:
Install-Module -Name Az.ApplicationMonitor。 - 可选参数:
-
-Proxy。 指定请求的代理服务器。 -
-AllowPrerelease。 允许安装 alpha 和 beta 版本。 -
-AcceptLicense。 跳过“接受许可证”提示 -
-Force。 忽略“不受信任的存储库”警告。
-
选项 2:手动下载并安装模块(脱机选项)
如果出于任何原因无法连接到 PowerShell 模块,可以手动下载并安装 Az.ApplicationMonitor 模块。
手动下载最新的 nupkg 文件
- 转到 https://www.powershellgallery.com/packages/Az.ApplicationMonitor 。
- 在“版本历史记录”表中选择文件的最新版本。
- 在“安装选项”下选择“手动下载”。
选项 2.1:安装到 PowerShell 模块目录中
将手动下载的 PowerShell 模块安装到 PowerShell 目录中,使之可被 PowerShell 会话发现。 有关详细信息,请参阅安装 PowerShell 模块。
使用 Expand-Archive(v1.0.1.0)将 nupkg 解压缩为 zip 文件
说明:基础版本的 Microsoft.PowerShell.Archive (v1.0.1.0) 无法解压缩 nupkg 文件。 使用 .zip 扩展名重命名文件。
参考:Expand-Archive。
命令:
$pathToNupkg = "C:\az.applicationmonitor.0.3.0-alpha.nupkg"
$pathToZip = ([io.path]::ChangeExtension($pathToNupkg, "zip"))
$pathToNupkg | rename-item -newname $pathToZip
$pathInstalledModule = "$Env:ProgramFiles\WindowsPowerShell\Modules\az.applicationmonitor"
Expand-Archive -LiteralPath $pathToZip -DestinationPath $pathInstalledModule
使用 Expand-Archive 解压缩 nupkg (v1.1.0.0)
说明:使用最新版本的 Expand-Archive 解压缩 nupkg 文件但不更改扩展名。
命令:
$pathToNupkg = "C:\az.applicationmonitor.0.2.1-alpha.nupkg"
$pathInstalledModule = "$Env:ProgramFiles\WindowsPowerShell\Modules\az.applicationmonitor"
Expand-Archive -LiteralPath $pathToNupkg -DestinationPath $pathInstalledModule
选项 2.2:手动解压缩和导入 nupkg
将手动下载的 PowerShell 模块安装到 PowerShell 目录中,使之可被 PowerShell 会话发现。 有关详细信息,请参阅安装 PowerShell 模块。
若要将模块安装到任何其他目录中,请使用 Import-Module 手动导入模块。
重要
使用相对路径安装动态链接库(DLL)。 请将此包的内容存储到所需的运行时目录中,并确认访问权限允许读取但不允许写入。
- 将扩展名更改为“.zip”,并将包的内容解压缩到所需的安装目录中。
- 找到 Az.ApplicationMonitor.psd1 的文件路径。
- 以管理员身份使用提升的执行策略运行 PowerShell。
- 通过
Import-Module Az.ApplicationMonitor.psd1命令加载模块。
通过代理路由流量
监视专用 Intranet 中的计算机时,需要通过代理路由 HTTP 流量。
用于从PowerShell Gallery下载和安装 Az.ApplicationMonitor 的 PowerShell 命令支持 -Proxy 参数。
编写安装脚本时,请查看上述说明。
Application Insights SDK 需要将应用的遥测数据发送给 Microsoft。 建议在 web.config 文件中配置应用的代理设置。 有关详细信息,请参阅如何实现代理直通?。
启用监视
使用 Enable-ApplicationInsightsMonitoring 命令以启用监视。
有关如何使用此 cmdlet 的详细说明,请参阅 API 参考。
API 参考
重要
- 以下 cmdlet 需要具有管理员权限和提升的执行策略的 PowerShell 会话。 有关详细信息,请参阅以管理员身份运行 PowerShell 并使用提升的执行策略。
- 以下 cmdlet 要求你查看并接受我们的许可证和隐私声明。
- 检测引擎会增加开销,默认情况下处于关闭状态。
本部分介绍以下 cmdlet,这些 cmdlet 是 Az.ApplicationMonitor PowerShell 模块的成员:
注释
展开以下任一部分以了解详细信息,包括示例、参数和输出。
Enable-InstrumentationEngine
通过设置一些注册表项启用检测引擎。 重启 IIS 以使这些更改生效。
检测引擎可以补充 .NET 软件开发工具包(SDK)收集的数据。 它收集描述托管进程执行的事件和消息。 这些事件和消息包括依赖项结果代码、HTTP 谓词和 SQL 命令文本。
在以下情况下启用检测引擎:
- 已使用
Enablecmdlet 启用了监视,但未启用检测引擎。 - 您已使用 .NET SDK 手动配置应用,并且希望收集额外的遥测数据。
示例
Enable-InstrumentationEngine
参数
| 参数 | Description |
|---|---|
| -接受许可 | 可选。 使用此开关可在无界面安装中接受许可条款和隐私声明。 |
| -Verbose | 通用参数。 使用此开关可输出详细日志。 |
输出
成功启用检测引擎的示例输出:
Configuring IIS Environment for instrumentation engine...
Configuring registry for instrumentation engine...
Enable-ApplicationInsightsMonitoring
对目标计算机上的 IIS 应用启用无代码附加监视。
此 cmdlet 会修改 IIS applicationHost.config 并设置一些注册表项。 它会创建 applicationinsights.ikey.config 文件,该文件定义每个应用使用的检测密钥。 IIS 在启动时会加载 RedfieldModule,从而在应用程序启动时将 Application Insights SDK 注入到应用程序中。 重启 IIS 以使更改生效。
启用监视后,我们建议你使用实时指标快速检查应用是否正在向我们发送遥测数据。
示例
单个连接字符串示例
在此示例中,当前计算机上的所有应用程序都使用同一个连接字符串。
Enable-ApplicationInsightsMonitoring -ConnectionString 'InstrumentationKey=xxxxxxxx-xxxx-xxxx-xxxx-xxxxxxxxxxxx;IngestionEndpoint=https://xxxx.applicationinsights.azure.cn/'
使用单个仪器密钥的示例
在此示例中,当前计算机上的所有应用都提供单个检测密钥。
Enable-ApplicationInsightsMonitoring -InstrumentationKey xxxxxxxx-xxxx-xxxx-xxxx-xxxxxxxxxxxx
使用检测密钥映射的示例
在本示例中:
-
MachineFilter使用'.*'通配符匹配当前计算机。 -
AppFilter='WebAppExclude'提供null工具密钥。 未检测指定的应用。 -
AppFilter='WebAppOne'为指定的应用分配唯一的检测密钥。 -
AppFilter='WebAppTwo'为指定的应用分配唯一的检测密钥。 -
AppFilter使用'.*'通配符来匹配它尚未匹配的任何 Web 应用,并分配默认检测密钥。 - 添加空格以提高可读性。
Enable-ApplicationInsightsMonitoring -InstrumentationKeyMap `
    ` @(@{MachineFilter='.*';AppFilter='WebAppExclude'},
        ` @{MachineFilter='.*';AppFilter='WebAppOne';InstrumentationSettings=@{InstrumentationKey='xxxxxxxx-xxxx-xxxx-xxxx-xxxxxxxxxxx1'}},
        ` @{MachineFilter='.*';AppFilter='WebAppTwo';InstrumentationSettings=@{InstrumentationKey='xxxxxxxx-xxxx-xxxx-xxxx-xxxxxxxxxxx2'}},
        ` @{MachineFilter='.*';AppFilter='.*';InstrumentationSettings=@{InstrumentationKey='xxxxxxxx-xxxx-xxxx-xxxx-xxxxxdefault'}})
-
MachineFilter 是计算机或虚拟机(VM)名称的必需 C# 正则表达式。
- “.*”匹配所有项
- “ComputerName”仅匹配具有指定确切名称的计算机。
-
AppFilter 是 IIS 站点名称所需的 C# 正则表达式。 可以通过运行命令 get-iissite 获取服务器上的站点列表。
- “.*”匹配所有项
- “SiteName”仅匹配具有指定确切名称的 IIS 站点。
- 需要 InstrumentationKey 才能监视与上述两个筛选器匹配的应用。
- 如果要定义排除监视的规则,请将此值保留为 null。
参数
| 参数 | Description |
|---|---|
| -EnableInstrumentationEngine | 可选。 使用此开关可让检测引擎收集执行托管进程期间发生的事件和相关消息。 这些事件和消息包括依赖项结果代码、HTTP 谓词和 SQL 命令文本。 检测引擎会增加开销,默认情况下处于关闭状态。 |
| -接受许可 | 可选。 使用此开关可在无界面安装中接受许可条款和隐私声明。 |
| -IgnoreSharedConfig | 当你使用一组 Web 服务器时,你可能正在使用共享配置。 HttpModule 无法注入此共享配置。 此脚本将失败,并提示需要额外的安装步骤。 使用此开关可忽略该检查并继续安装必备组件。 有关更多信息,请参阅与IIS共享配置已知的冲突 |
| -Verbose | 通用参数。 使用此开关可显示详细日志。 |
| -WhatIf | 通用参数。 使用此开关可以测试和验证输入参数,而无需真正启用监视。 |
输出
成功启用后的示例输出
Initiating Disable Process
Applying transformation to 'C:\Windows\System32\inetsrv\config\applicationHost.config'
'C:\Windows\System32\inetsrv\config\applicationHost.config' backed up to 'C:\Windows\System32\inetsrv\config\applicationHost.config.backup-2019-03-26_08-59-52z'
in :1,237
No element in the source document matches '/configuration/location[@path='']/system.webServer/modules/add[@name='ManagedHttpModuleHelper']'
Not executing RemoveAll (transform line 1, 546)
Transformation to 'C:\Windows\System32\inetsrv\config\applicationHost.config' was successfully applied. Operation: 'disable'
GAC Module will not be removed, since this operation might cause IIS instabilities
Configuring IIS Environment for codeless attach...
Registry: skipping non-existent 'HKEY_LOCAL_MACHINE\SYSTEM\CurrentControlSet\Services\IISADMIN[Environment]
Registry: skipping non-existent 'HKEY_LOCAL_MACHINE\SYSTEM\CurrentControlSet\Services\W3SVC[Environment]
Registry: skipping non-existent 'HKEY_LOCAL_MACHINE\SYSTEM\CurrentControlSet\Services\WAS[Environment]
Configuring IIS Environment for instrumentation engine...
Registry: skipping non-existent 'HKEY_LOCAL_MACHINE\SYSTEM\CurrentControlSet\Services\IISADMIN[Environment]
Registry: skipping non-existent 'HKEY_LOCAL_MACHINE\SYSTEM\CurrentControlSet\Services\W3SVC[Environment]
Registry: skipping non-existent 'HKEY_LOCAL_MACHINE\SYSTEM\CurrentControlSet\Services\WAS[Environment]
Configuring registry for instrumentation engine...
Successfully disabled Application Insights Agent
Installing GAC module 'C:\Program Files\WindowsPowerShell\Modules\Az.ApplicationMonitor\0.2.0\content\Runtime\Microsoft.AppInsights.IIS.ManagedHttpModuleHelper.dll'
Applying transformation to 'C:\Windows\System32\inetsrv\config\applicationHost.config'
Found GAC module Microsoft.AppInsights.IIS.ManagedHttpModuleHelper.ManagedHttpModuleHelper, Microsoft.AppInsights.IIS.ManagedHttpModuleHelper, Version=1.0.0.0, Culture=neutral, PublicKeyToken=31bf3856ad364e35
'C:\Windows\System32\inetsrv\config\applicationHost.config' backed up to 'C:\Windows\System32\inetsrv\config\applicationHost.config.backup-2019-03-26_08-59-52z_1'
Transformation to 'C:\Windows\System32\inetsrv\config\applicationHost.config' was successfully applied. Operation: 'enable'
Configuring IIS Environment for codeless attach...
Configuring IIS Environment for instrumentation engine...
Configuring registry for instrumentation engine...
Updating app pool permissions...
Successfully enabled Application Insights Agent
Disable-InstrumentationEngine
通过删除一些注册表项来禁用检测引擎。 重启 IIS 以使这些更改生效。
示例
Disable-InstrumentationEngine
参数
| 参数 | Description |
|---|---|
| -Verbose | 通用参数。 使用此开关可输出详细日志。 |
输出
成功禁用检测引擎的示例输出
Configuring IIS Environment for instrumentation engine...
Registry: removing 'HKEY_LOCAL_MACHINE\SYSTEM\CurrentControlSet\Services\IISADMIN[Environment]'
Registry: removing 'HKEY_LOCAL_MACHINE\SYSTEM\CurrentControlSet\Services\W3SVC[Environment]'
Registry: removing 'HKEY_LOCAL_MACHINE\SYSTEM\CurrentControlSet\Services\WAS[Environment]'
Configuring registry for instrumentation engine...
Disable-ApplicationInsightsMonitoring
在目标计算机上禁用监视。 此 cmdlet 会删除对 IIS applicationHost.config 的编辑并删除注册表项。
示例
Disable-ApplicationInsightsMonitoring
参数
| 参数 | Description |
|---|---|
| -Verbose | 通用参数。 使用此开关可显示详细日志。 |
输出
成功禁用监视的示例输出
Initiating Disable Process
Applying transformation to 'C:\Windows\System32\inetsrv\config\applicationHost.config'
'C:\Windows\System32\inetsrv\config\applicationHost.config' backed up to 'C:\Windows\System32\inetsrv\config\applicationHost.config.backup-2019-03-26_08-59-00z'
in :1,237
No element in the source document matches '/configuration/location[@path='']/system.webServer/modules/add[@name='ManagedHttpModuleHelper']'
Not executing RemoveAll (transform line 1, 546)
Transformation to 'C:\Windows\System32\inetsrv\config\applicationHost.config' was successfully applied. Operation: 'disable'
GAC Module will not be removed, since this operation might cause IIS instabilities
Configuring IIS Environment for codeless attach...
Registry: skipping non-existent 'HKEY_LOCAL_MACHINE\SYSTEM\CurrentControlSet\Services\IISADMIN[Environment]
Registry: skipping non-existent 'HKEY_LOCAL_MACHINE\SYSTEM\CurrentControlSet\Services\W3SVC[Environment]
Registry: skipping non-existent 'HKEY_LOCAL_MACHINE\SYSTEM\CurrentControlSet\Services\WAS[Environment]
Configuring IIS Environment for instrumentation engine...
Registry: skipping non-existent 'HKEY_LOCAL_MACHINE\SYSTEM\CurrentControlSet\Services\IISADMIN[Environment]
Registry: skipping non-existent 'HKEY_LOCAL_MACHINE\SYSTEM\CurrentControlSet\Services\W3SVC[Environment]
Registry: skipping non-existent 'HKEY_LOCAL_MACHINE\SYSTEM\CurrentControlSet\Services\WAS[Environment]
Configuring registry for instrumentation engine...
Successfully disabled Application Insights Agent
Get-ApplicationInsightsMonitoringConfig
获取配置文件并将值输出到控制台。
示例
Get-ApplicationInsightsMonitoringConfig
参数
不需要参数。
输出
读取配置文件的示例输出
RedfieldConfiguration:
Filters:
0)InstrumentationKey: AppFilter: WebAppExclude MachineFilter: .*
1)InstrumentationKey: xxxxxxxx-xxxx-xxxx-xxxx-xxxxxxxxxxx2 AppFilter: WebAppTwo MachineFilter: .*
2)InstrumentationKey: xxxxxxxx-xxxx-xxxx-xxxx-xxxxxdefault AppFilter: .* MachineFilter: .*
Get-ApplicationInsightsMonitoringStatus
此 cmdlet 提供有关 Application Insights 代理的故障排除信息。 使用此 cmdlet 调查监视状态、PowerShell 模块的版本,以及检查正在运行的进程。 此 cmdlet 会报告监视所需的版本信息和密钥文件相关信息。
示例
示例:应用程序状态
运行 Get-ApplicationInsightsMonitoringStatus 命令来显示网站的监视状态。
Get-ApplicationInsightsMonitoringStatus

IIS Websites:

SiteName               : Default Web Site
ApplicationPoolName    : DefaultAppPool
SiteId                 : 1
SiteState              : Stopped

SiteName               : DemoWebApp111
ApplicationPoolName    : DemoWebApp111
SiteId                 : 2
SiteState              : Started
ProcessId              : not found

SiteName               : DemoWebApp222
ApplicationPoolName    : DemoWebApp222
SiteId                 : 3
SiteState              : Started
ProcessId              : 2024
Instrumented           : true
InstrumentationKey     : xxxxxxxx-xxxx-xxxx-xxxx-xxxxxxxxx123

SiteName               : DemoWebApp333
ApplicationPoolName    : DemoWebApp333
SiteId                 : 4
SiteState              : Started
ProcessId              : 5184
AppAlreadyInstrumented : true
在本示例中:
计算机标识符是一个匿名 ID,用于唯一标识服务器。 如果你创建支持请求,我们需要该 ID 来查找你的服务器的日志。
“默认网站”在 IIS 中处于“已停止”状态
IIS 将 DemoWebApp111 显示为已启动,但应用未收到任何请求。 报告未显示正在运行的进程(ProcessId:找不到)。
DemoWebApp222 正在运行,并且正在被监控(已仪器化:是)。 根据用户配置,此站点的检测密钥 xxxxxxxx-xxxx-xxxx-xxxx-xxxxxxxxx123 匹配。
DemoWebApp333 是使用 Application Insights SDK 手动检测的。 Application Insights 代理会检测 SDK,并且不监视此站点。
存在
AppAlreadyInstrumented : true表示 Application Insights 代理标识了在 Web 应用程序中加载的冲突 dll,假定 Web 应用已手动检测,并且代理已退让且未检测此过程。Instrumented : true指示 Application Insights 代理已成功检测在指定的 w3wp.exe 进程中运行的 Web 应用。
示例:PowerShell 模块信息
运行 Get-ApplicationInsightsMonitoringStatus -PowerShellModule 命令可显示有关当前模块的信息:
Get-ApplicationInsightsMonitoringStatus -PowerShellModule

PowerShell Module version:
0.4.0-alpha

Application Insights SDK version:
2.9.0.3872

Executing PowerShell Module Assembly:
Microsoft.ApplicationInsights.Redfield.Configurator.PowerShell, Version=2.8.14.11432, Culture=neutral, PublicKeyToken=31bf3856ad364e35

PowerShell Module Directory:
C:\Program Files\WindowsPowerShell\Modules\Az.ApplicationMonitor\0.2.2\content\PowerShell

Runtime Paths:
ParentDirectory (Exists: True)
C:\Program Files\WindowsPowerShell\Modules\Az.ApplicationMonitor\content

ConfigurationPath (Exists: True)
C:\Program Files\WindowsPowerShell\Modules\Az.ApplicationMonitor\content\applicationInsights.ikey.config

ManagedHttpModuleHelperPath (Exists: True)
C:\Program Files\WindowsPowerShell\Modules\Az.ApplicationMonitor\content\Runtime\Microsoft.AppInsights.IIS.ManagedHttpModuleHelper.dll

RedfieldIISModulePath (Exists: True)
C:\Program Files\WindowsPowerShell\Modules\Az.ApplicationMonitor\content\Runtime\Microsoft.ApplicationInsights.RedfieldIISModule.dll

InstrumentationEngine86Path (Exists: True)
C:\Program Files\WindowsPowerShell\Modules\Az.ApplicationMonitor\content\Instrumentation32\MicrosoftInstrumentationEngine_x86.dll

InstrumentationEngine64Path (Exists: True)
C:\Program Files\WindowsPowerShell\Modules\Az.ApplicationMonitor\content\Instrumentation64\MicrosoftInstrumentationEngine_x64.dll

InstrumentationEngineExtensionHost86Path (Exists: True)
C:\Program Files\WindowsPowerShell\Modules\Az.ApplicationMonitor\content\Instrumentation32\Microsoft.ApplicationInsights.ExtensionsHost_x86.dll

InstrumentationEngineExtensionHost64Path (Exists: True)
C:\Program Files\WindowsPowerShell\Modules\Az.ApplicationMonitor\content\Instrumentation64\Microsoft.ApplicationInsights.ExtensionsHost_x64.dll

InstrumentationEngineExtensionConfig86Path (Exists: True)
C:\Program Files\WindowsPowerShell\Modules\Az.ApplicationMonitor\content\Instrumentation32\Microsoft.InstrumentationEngine.Extensions.config

InstrumentationEngineExtensionConfig64Path (Exists: True)
C:\Program Files\WindowsPowerShell\Modules\Az.ApplicationMonitor\content\Instrumentation64\Microsoft.InstrumentationEngine.Extensions.config

ApplicationInsightsSdkPath (Exists: True)
C:\Program Files\WindowsPowerShell\Modules\Az.ApplicationMonitor\content\Runtime\Microsoft.ApplicationInsights.dll
示例:运行时状态
可以检查已检测计算机上的进程以查看是否已加载所有 DLL。 如果监视功能在正常工作,则至少有 12 个 DLL 应加载。
运行命令 Get-ApplicationInsightsMonitoringStatus -InspectProcess:
Get-ApplicationInsightsMonitoringStatus -InspectProcess

iisreset.exe /status
Status for IIS Admin Service ( IISADMIN ) : Running
Status for Windows Process Activation Service ( WAS ) : Running
Status for Net.Msmq Listener Adapter ( NetMsmqActivator ) : Running
Status for Net.Pipe Listener Adapter ( NetPipeActivator ) : Running
Status for Net.Tcp Listener Adapter ( NetTcpActivator ) : Running
Status for World Wide Web Publishing Service ( W3SVC ) : Running

handle64.exe -accepteula -p w3wp
BF0: File  (R-D)   C:\Program Files\WindowsPowerShell\Modules\Az.ApplicationMonitor\content\Runtime\Microsoft.AI.ServerTelemetryChannel.dll
C58: File  (R-D)   C:\Program Files\WindowsPowerShell\Modules\Az.ApplicationMonitor\content\Runtime\Microsoft.AI.AzureAppServices.dll
C68: File  (R-D)   C:\Program Files\WindowsPowerShell\Modules\Az.ApplicationMonitor\content\Runtime\Microsoft.AI.DependencyCollector.dll
C78: File  (R-D)   C:\Program Files\WindowsPowerShell\Modules\Az.ApplicationMonitor\content\Runtime\Microsoft.AI.WindowsServer.dll
C98: File  (R-D)   C:\Program Files\WindowsPowerShell\Modules\Az.ApplicationMonitor\content\Runtime\Microsoft.AI.Web.dll
CBC: File  (R-D)   C:\Program Files\WindowsPowerShell\Modules\Az.ApplicationMonitor\content\Runtime\Microsoft.AI.PerfCounterCollector.dll
DB0: File  (R-D)   C:\Program Files\WindowsPowerShell\Modules\Az.ApplicationMonitor\content\Runtime\Microsoft.AI.Agent.Intercept.dll
B98: File  (R-D)   C:\Program Files\WindowsPowerShell\Modules\Az.ApplicationMonitor\content\Runtime\Microsoft.ApplicationInsights.RedfieldIISModule.dll
BB4: File  (R-D)   C:\Program Files\WindowsPowerShell\Modules\Az.ApplicationMonitor\content\Runtime\Microsoft.ApplicationInsights.RedfieldIISModule.Contracts.dll
BCC: File  (R-D)   C:\Program Files\WindowsPowerShell\Modules\Az.ApplicationMonitor\content\Runtime\Microsoft.ApplicationInsights.Redfield.Lightup.dll
BE0: File  (R-D)   C:\Program Files\WindowsPowerShell\Modules\Az.ApplicationMonitor\content\Runtime\Microsoft.ApplicationInsights.dll

listdlls64.exe -accepteula w3wp
0x0000000019ac0000  0x127000  C:\Program Files\WindowsPowerShell\Modules\Az.ApplicationMonitor\content\Instrumentation64\MicrosoftInstrumentationEngine_x64.dll
0x00000000198b0000  0x4f000   C:\Program Files\WindowsPowerShell\Modules\Az.ApplicationMonitor\content\Instrumentation64\Microsoft.ApplicationInsights.ExtensionsHost_x64.dll
0x000000000c460000  0xb2000   C:\Program Files\WindowsPowerShell\Modules\Az.ApplicationMonitor\content\Instrumentation64\Microsoft.ApplicationInsights.Extensions.Base_x64.dll
0x000000000ad60000  0x108000  C:\Windows\TEMP\2.4.0.0.Microsoft.ApplicationInsights.Extensions.Intercept_x64.dll
参数
默认情况下,此 cmdlet 会报告 Web 应用程序的监视状态。 使用此选项来查看是否已成功检测应用程序。 您还可以查看哪个工具密钥已与您的网站匹配。
| 参数 | Description |
|---|---|
| -PowerShellModule | 可选。 使用此开关报告监视所需的 DLL 的版本号和路径。 如果需要标识任何 DLL 的版本(包括 Application Insights SDK),请使用此选项。 |
| -InspectProcess |
可选。 使用此开关报告 IIS 是否正在运行。 它会下载外部工具,以确定是否将必要的 DLL 加载到 IIS 运行时。 如果此过程因任何原因失败,你可以手动运行这些命令: * iisreset.exe /status* \[handle64.exe\](/sysinternals/downloads/handle) -p w3wp \| findstr /I "InstrumentationEngine AI. ApplicationInsights"* \[listdlls64.exe\](/sysinternals/downloads/listdlls) w3wp \| findstr /I "InstrumentationEngine AI ApplicationInsights" |
| -Force | 可选。 仅与 InspectProcess 一起使用。 使用此开关可跳过在下载更多工具之前出现的用户提示。 |
Set-ApplicationInsightsMonitoringConfig
在不进行完全重新安装的情况下设置配置文件。 重启 IIS 以使更改生效。
重要
此 cmdlet 需要具有管理员权限的 PowerShell 会话。
示例
使用单个仪器密钥的示例
在此示例中,当前计算机上的所有应用都提供单个检测密钥。
Enable-ApplicationInsightsMonitoring -InstrumentationKey xxxxxxxx-xxxx-xxxx-xxxx-xxxxxxxxxxxx
使用检测密钥映射的示例
在本示例中:
-
MachineFilter使用'.*'通配符匹配当前计算机。 -
AppFilter='WebAppExclude'提供null工具密钥。 未检测指定的应用。 -
AppFilter='WebAppOne'为指定的应用分配唯一的检测密钥。 -
AppFilter='WebAppTwo'为指定的应用分配唯一的检测密钥。 -
AppFilter使用'.*'通配符来匹配它尚未匹配的 Web 应用,并分配默认检测密钥。 - 添加空格以提高可读性。
Enable-ApplicationInsightsMonitoring -InstrumentationKeyMap `
    ` @(@{MachineFilter='.*';AppFilter='WebAppExclude'},
      ` @{MachineFilter='.*';AppFilter='WebAppOne';InstrumentationSettings=@{InstrumentationKey='xxxxxxxx-xxxx-xxxx-xxxx-xxxxxxxxxxx1'}},
      ` @{MachineFilter='.*';AppFilter='WebAppTwo';InstrumentationSettings=@{InstrumentationKey='xxxxxxxx-xxxx-xxxx-xxxx-xxxxxxxxxxx2'}},
      ` @{MachineFilter='.*';AppFilter='.*';InstrumentationSettings=@{InstrumentationKey='xxxxxxxx-xxxx-xxxx-xxxx-xxxxxdefault'}})
参数
| 参数 | Description |
|---|---|
| -InstrumentationKey | 必填。 使用此参数提供单个检测密钥以供目标计算机上的所有应用使用。 |
| -InstrumentationKeyMap | 必填。 使用此参数可提供多个检测密钥以及每个应用使用的检测密钥映射。 |
通过设置 MachineFilter,可以为多台计算机创建单个安装脚本。
重要
应用程序按照您提供的顺序匹配规则。 首先指定最具体的规则,最后指定最通用的规则。
重要
InstrumentationKeyMap 是一项高级路由功能,可将同一台计算机上的 Internet Information Services (IIS) 应用映射到 Application Insights 资源。 此功能适用于由 Application Insights 代理自动检测的 IIS 托管的 ASP.NET 和 ASP.NET Core 应用。
匹配的工作原理
- 映射定义了一个名为
filters的规则有序列表。 第一个匹配规则生效。 首先设置特定规则,然后以一个通用规则收尾。 - 每个规则都可以为匹配的应用分配不同的 Application Insights 资源。 首选受支持方案中的连接字符串,因为检测密钥是旧式的。
可用筛选器
-
MachineFilter或machineFilter:与计算机或虚拟机名称匹配的 C# 正则表达式。.*匹配所有名称。 -
AppFilter或appFilter:与 IIS 站点名称 () 匹配的 C# 正则表达式。HostingEnvironment.SiteName如果VirtualPathFilter或virtualPathFilter未提供,则需要此筛选器。 -
VirtualPathFilter或virtualPathFilter:与 IIS 虚拟路径 () 匹配的 C# 正则表达式。HostingEnvironment.ApplicationVirtualPath使用此筛选器以网站下的单个应用为目标。
术语映射
- PowerShell cmdlet 使用
MachineFilter、AppFilter和VirtualPathFilter。 - Azure VM 和虚拟机规模集扩展 JSON 使用
machineFilter、appFilter和virtualPathFilter,并使用instrumentationSettings设置资源。
小窍门
包括与所有应用(例如 .*)匹配的最终规则,并应用默认资源以使行为明确。
此 cmdlet 的地图形状
- 提供
-InstrumentationKeyMap作为 PowerShell 哈希表数组。 - 对于此 cmdlet,请使用
InstrumentationSettings=@{ InstrumentationKey = '<ikey>' }.. 设置每个规则的目标资源。 - 如果需要计算机上所有应用程序的单个资源,请使用
-ConnectionString或-InstrumentationKey。
Start-ApplicationInsightsMonitoringTrace
收集无代码附加运行时发出的 Windows 事件跟踪(ETW)事件 。 将此 cmdlet 用作运行 PerfView 的更简单的替代方法。
事件会实时打印到控制台,并写入 .etl 文件。 可以使用 PerfView 打开 .etl 该文件,以便进行更深入的分析。
此 cmdlet 运行,直到达到超时、默认值为 5 分钟,或者直到你手动 Ctrl + C停止它。
示例
如何收集事件
当需要调查 IIS 应用未被检测的原因时,请使用此流。
"无代码附加运行时在 IIS 启动和应用启动时会触发 ETW 事件。"
- 在管理命令提示符中,运行
iisreset /stop以停止 IIS 和所有 Web 应用。 - 通过运行此 cmdlet 开始跟踪。
- 在管理命令提示符中,运行
iisreset /start以启动 IIS。 - 通过访问应用来触发启动程序。
- 应用完成加载后,按
Ctrl + C停止或允许超时结束会话。
要收集的事件
可以选择要包括的事件源:
-
-CollectSdkEvents从 Application Insights SDK 收集事件。 -
-CollectRedfieldEvents从 Application Insights 代理和 Redfield 运行时收集事件,这对于 IIS 和应用启动诊断非常有用。 - 通过指定这两个开关来收集这两个集。
- 如果未指定参数,则默认收集这两个集合。
参数
| 参数 | Description |
|---|---|
| -最大持续时间(分钟) | 可选。 设置超时前收集的时间。默认值为 5 分钟。 |
| -LogDirectory | 可选。 应将文件写入的.etl目录。 默认情况下,该文件在模块 PowerShell 目录下创建。 会话启动时会显示完整路径。 |
| -CollectSdkEvents | 可选。 包括 Application Insights SDK 事件。 |
| -CollectRedfieldEvents | 可选。 包括来自 Application Insights 代理程序和 Redfield 运行时的事件。 |
| -Verbose | 通用参数。 输出详细日志。 |
输出
应用程序启动日志的示例
Start-ApplicationInsightsMonitoringTrace -CollectRedfieldEvents
Starting...
Log File: C:\Program Files\WindowsPowerShell\Modules\Az.ApplicationMonitor\content\logs\20190627_144217_ApplicationInsights_ETW_Trace.etl
Tracing enabled, waiting for events.
Tracing will timeout in 5 minutes. Press CTRL+C to cancel.
2:42:31 PM EVENT: Microsoft-ApplicationInsights-IIS-ManagedHttpModuleHelper Trace Resolved variables to: MicrosoftAppInsights_ManagedHttpModulePath='C:\Program Files\WindowsPowerShell\Modules\Az.ApplicationMonitor\content\Runtime\Microsoft.ApplicationInsights.RedfieldIISModule.dll', MicrosoftAppInsights_ManagedHttpModuleType='Microsoft.ApplicationInsights.RedfieldIISModule.RedfieldIISModule'
2:42:31 PM EVENT: Microsoft-ApplicationInsights-IIS-ManagedHttpModuleHelper Trace Resolved variables to: MicrosoftDiagnosticServices_ManagedHttpModulePath2='', MicrosoftDiagnosticServices_ManagedHttpModuleType2=''
2:42:31 PM EVENT: Microsoft-ApplicationInsights-IIS-ManagedHttpModuleHelper Trace Environment variable 'MicrosoftDiagnosticServices_ManagedHttpModulePath2' or 'MicrosoftDiagnosticServices_ManagedHttpModuleType2' is null, skipping managed dll loading
为虚拟机(VM)和虚拟机规模集部署 Application Insights 代理
本部分内容
通过自动检测启用 Azure Monitor 和 Application Insights 来监控 Internet 信息服务 (IIS) 托管的 ASP.NET 和 ASP.NET Core 应用程序,这些应用程序运行在 Azure 虚拟机 和 Azure 虚拟机规模集 上。
使用虚拟机扩展部署 Application Insights 代理。 代理 自动收集与 SDK 相同的依赖项信号。 使用 PowerShell 自动执行大规模部署。
注释
- 对于 Java 应用程序,请使用 Application Insights Java 3.0 代理,该代理 自动收集 最常用的库、框架、日志和依赖项,以及许多其他 配置。
- 在 Azure 虚拟机和 Azure 虚拟机规模集上运行的 Node.js 和 Python 应用程序不支持自动检测。 请改用 Azure Monitor OpenTelemetry 发行版 。
- 若要监视 VM 来宾及其托管的应用程序,请参阅 VM 来宾数据。
有关支持的自动检测方案的完整列表,请参阅支持的环境、语言和资源提供程序。
为虚拟机启用监视
可使用 Azure 门户或 PowerShell 来启用 VM 监视。
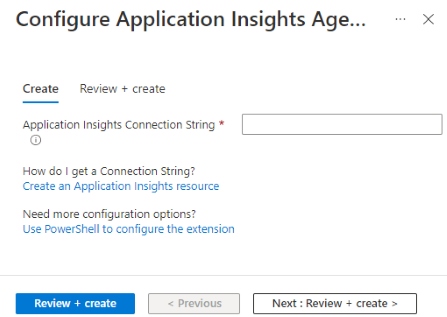
选项 1:Azure 门户
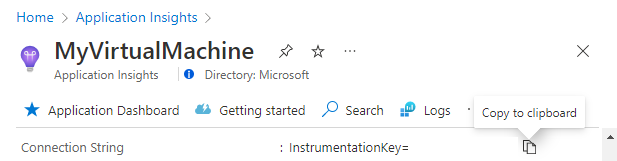
在 Azure 门户中,导航到 "Application Insights" 资源。 将你的连接字符串复制到剪贴板。
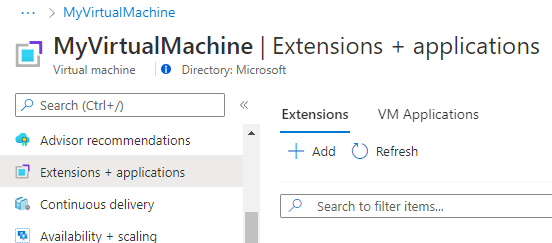
进入你的虚拟机。 在左侧菜单的“设置”部分下,选择“扩展 + 应用程序”>“添加”。
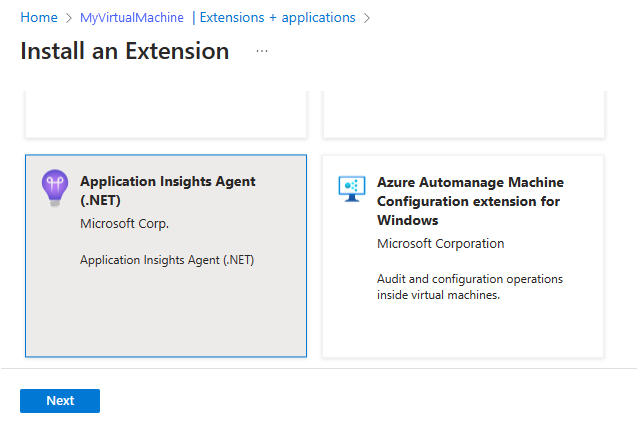
选择“Application Insights 代理”“下一步”。>
粘贴你在步骤 1 中复制的连接字符串,然后选择“查看 + 创建”。


选项 2:PowerShell
注释
PowerShell 新手入门? 请查看入门指南。
安装或更新用作 Azure 虚拟机扩展的 Application Insights 代理:
# define variables to match your environment before running
$ResourceGroup = "<myVmResourceGroup>"
$VMName = "<myVmName>"
$Location = "<myVmLocation>"
$ConnectionString = "<myAppInsightsResourceConnectionString>"

$publicCfgJsonString = @"
{
    "redfieldConfiguration": {
        "instrumentationKeyMap": {
        "filters": [
            {
            "appFilter": ".*",
            "machineFilter": ".*",
            "virtualPathFilter": ".*",
            "instrumentationSettings" : {
                "connectionString": "$ConnectionString"
            }
            }
        ]
        }
    }
    }
"@

$privateCfgJsonString = '{}'

Set-AzVMExtension -ResourceGroupName $ResourceGroup -VMName $VMName -Location $Location -Name "ApplicationMonitoringWindows" -Publisher "Microsoft.Azure.Diagnostics" -Type "ApplicationMonitoringWindows" -Version "2.8" -SettingString $publicCfgJsonString -ProtectedSettingString $privateCfgJsonString
注释
对于更复杂的大规模部署,你可以使用 PowerShell 循环跨多个 VM 安装或更新 Application Insights 代理扩展。
查询 Azure 虚拟机的 Application Insights 代理扩展状态:
Get-AzVMExtension -ResourceGroupName "<myVmResourceGroup>" -VMName "<myVmName>" -Name ApplicationMonitoringWindows -Status
获取Azure虚拟机的已安装扩展列表:
Get-AzResource -ResourceId "/subscriptions/<mySubscriptionId>/resourceGroups/<myVmResourceGroup>/providers/Microsoft.Compute/virtualMachines/<myVmName>/extensions"
从Azure虚拟机中卸载 Application Insights 代理扩展:
Remove-AzVMExtension -ResourceGroupName "<myVmResourceGroup>" -VMName "<myVmName>" -Name "ApplicationMonitoring"
注释
通过选择与你在部署 Application Insights 代理扩展时使用的连接字符串相关联的 Application Insights 资源中的“实时指标流”来验证安装。 如果要从多个虚拟机发送数据,请在 Server Name 下选择目标Azure虚拟机。 最长可能需要等待一分钟,数据才会开始流动。
instrumentationKeyMap (扩展设置)
重要
InstrumentationKeyMap 是一项高级路由功能,可将同一台计算机上的 Internet Information Services (IIS) 应用映射到 Application Insights 资源。 此功能适用于由 Application Insights 代理自动检测的 IIS 托管的 ASP.NET 和 ASP.NET Core 应用。
匹配的工作原理
- 映射定义了一个名为
filters的规则有序列表。 第一个匹配规则生效。 首先设置特定规则,然后以一个通用规则收尾。 - 每个规则都可以为匹配的应用分配不同的 Application Insights 资源。 首选受支持方案中的连接字符串,因为检测密钥是旧式的。
可用筛选器
-
MachineFilter或machineFilter:与计算机或虚拟机名称匹配的 C# 正则表达式。.*匹配所有名称。 -
AppFilter或appFilter:与 IIS 站点名称 () 匹配的 C# 正则表达式。HostingEnvironment.SiteName如果VirtualPathFilter或virtualPathFilter未提供,则需要此筛选器。 -
VirtualPathFilter或virtualPathFilter:与 IIS 虚拟路径 () 匹配的 C# 正则表达式。HostingEnvironment.ApplicationVirtualPath使用此筛选器以网站下的单个应用为目标。
术语映射
- PowerShell cmdlet 使用
MachineFilter、AppFilter和VirtualPathFilter。 - Azure VM 和虚拟机规模集扩展 JSON 使用
machineFilter、appFilter和virtualPathFilter,并使用instrumentationSettings设置资源。
小窍门
包括与所有应用(例如 .*)匹配的最终规则,并应用默认资源以使行为明确。
VM 和虚拟机规模集扩展的应用方向
将地图放置在扩展的公共设置redfieldConfiguration.instrumentationKeyMap.filters下(-SettingString 用于虚拟机,-Setting 用于虚拟机规模集)。 属性名称为驼峰式小写。 使用 instrumentationSettings.connectionString.. 设置每个规则的目标资源。
{
  "redfieldConfiguration": {
    "instrumentationKeyMap": {
      "filters": [
        {
          "machineFilter": ".*",
          "appFilter": ".*",
          "instrumentationSettings": {
            "connectionString": "<your-APPLICATIONINSIGHTS_CONNECTION_STRING>"
          }
        }
      ]
    }
  }
}
为虚拟机规模集启用监视
可以使用 Azure 门户或 PowerShell 为虚拟机规模集启用监视。
选项 1:Azure 门户
遵循前述用于 VM 的步骤,但需转到虚拟机规模集而不是 VM。
选项 2:PowerShell
安装或更新 Application Insights 代理程序,将其用作虚拟机规模集的扩展:
# Set resource group, vmss name, and connection string to reflect your environment
$ResourceGroup = "<myVmResourceGroup>"
$VMSSName = "<myVmName>"
$ConnectionString = "<myAppInsightsResourceConnectionString>"
$publicCfgHashtable =
@{
  "redfieldConfiguration"= @{
    "instrumentationKeyMap"= @{
      "filters"= @(
        @{
          "appFilter"= ".*";
          "machineFilter"= ".*";
          "virtualPathFilter"= ".*";
          "instrumentationSettings" = @{
            "connectionString"= "$ConnectionString"
          }
        }
      )
    }
  }
};
$privateCfgHashtable = @{};
$vmss = Get-AzVmss -ResourceGroupName $ResourceGroup -VMScaleSetName $VMSSName
Add-AzVmssExtension -VirtualMachineScaleSet $vmss -Name "ApplicationMonitoringWindows" -Publisher "Microsoft.Azure.Diagnostics" -Type "ApplicationMonitoringWindows" -TypeHandlerVersion "2.8" -Setting $publicCfgHashtable -ProtectedSetting $privateCfgHashtable
Update-AzVmss -ResourceGroupName $vmss.ResourceGroupName -Name $vmss
# Note: Depending on your update policy, you might need to run Update-AzVmssInstance for each instance
获取虚拟机规模集的已安装扩展的列表:
Get-AzResource -ResourceId "/subscriptions/<mySubscriptionId>/resourceGroups/<myResourceGroup>/providers/Microsoft.Compute/virtualMachineScaleSets/<myVmssName>/extensions"
从虚拟机规模集卸载应用程序监视扩展:
# set resource group and vmss name to reflect your environment
$vmss = Get-AzVmss -ResourceGroupName "<myResourceGroup>" -VMScaleSetName "<myVmssName>"
Remove-AzVmssExtension -VirtualMachineScaleSet $vmss -Name "ApplicationMonitoringWindows"
Update-AzVmss -ResourceGroupName $vmss.ResourceGroupName -Name $vmss.Name -VirtualMachineScaleSet $vmss
# Note: Depending on your update policy, you might need to run Update-AzVmssInstance for each instance
Troubleshooting
有关专用故障排除步骤,请参阅 为 VM 和虚拟机规模集部署 Application Insights Monitoring Agent 扩展时出现问题。
验证 Application Insights 是否接收遥测数据
ASP.NET 和ASP.NET Core
运行应用程序并向其发出请求。 现在,遥测数据应会流入 Application Insights。 Application Insights SDK 会自动收集应用程序的传入 Web 请求及其相关遥测数据。
辅助角色服务
运行应用程序。 以上所有示例中的工作线程每秒向 bing.com 发起一次 HTTP 请求,并通过使用 ILogger 输出少量日志。 这些行封装在调用StartOperationTelemetryClient中,用于创建操作。 在此示例中,RequestTelemetry 名为“操作”。
Application Insights 默认收集这些 ILogger 日志,严重性为警告或以上,还会收集依赖关系。 它们与 RequestTelemetry 父子关系相关。 相关性也适用于进程/网络边界。 例如,如果调用了另一个受监视的组件,那么它也与这个父组件相关联。
此自定义操作 RequestTelemetry 可视为典型 web 应用程序中传入 web 请求的等效。 不需要使用操作,但最适合与 Application Insights 相关数据模型。
RequestTelemetry 充当父操作,工作迭代内生成的每个遥测数据都被视为逻辑上属于同一操作。
此方法还可确保生成的遥测数据(自动和手动)具有相同的 operation_id。 由于采样基于 operation_id,因此采样算法会保留或删除单个迭代中的所有遥测数据。
收集遥测数据
本部分内容
实时指标
实时指标可用于快速验证是否正确配置了使用 Application Insights 的应用程序监视。 遥测可能需要几分钟才能显示在Azure门户中,但实时指标窗格几乎实时显示正在运行进程的 CPU 使用率。 它还可以显示其他遥测,例如请求、依赖项和跟踪。
注释
根据推荐的.NET应用程序说明进行入门时,实时指标会被默认启用。
开始
通过以下特定于语言的准则,使用 Application Insights SDK 启用实时指标:
- ASP.NET:默认启用,但也可以使用代码手动启用。
- ASP.NET Core:默认启用,但也可以使用代码手动启用。
- .NET/.NET Core 控制台/工作程序:默认启用。
在 Azure 门户中打开应用程序的 Application Insights 资源。 选择在左侧菜单中的“调查”下列出的“实时指标”。
支持的功能
| 语言 | 基本指标 | 性能指标 | 自定义筛选 | 样本遥测数据 | CPU 按进程划分 |
|---|---|---|---|---|---|
| .NET Framework | 支持 (LTS) | 支持 (LTS) | 支持 (LTS) | 支持 (LTS) | 支持 (LTS) |
| .NET Core (target=.NET Framework) | 支持 (LTS) | 支持 (LTS) | 支持 (LTS) | 支持 (LTS) | 支持 (LTS) |
| .NET核心(target=.NET Core) | 支持 (LTS) | Supported* | 支持 (LTS) | 支持 (LTS) | 不支持 |
基本指标包括请求、依赖项和异常率。 性能指标(性能计数器)包括内存和 CPU。 示例遥测显示了有关失败的请求和依赖项、异常、事件和跟踪的详细信息流。
PerfCounters 支持在不面向 .NET Framework 的 .NET Core 版本中略有不同:
- 在 Azure 应用服务的 Windows 上运行时,支持 PerfCounters 指标(ASP.NET Core SDK 版本 2.4.1 或更高版本)。
- 在任意 Windows 计算机上运行面向 .NET Core LTS 或更高版本的应用时,支持 PerfCounters。
- 当应用程序在最新版本中 任意地方(例如 Linux、Windows、Linux 应用服务或容器)运行时,PerfCounters 都受到支持,但仅限于那些目标 .NET Core LTS 或更高版本的应用程序。
通过代码为任何 .NET 应用程序启用实时指标
ASP.NET
若要手动配置实时指标,请执行以下操作:
安装 NuGet 包 Microsoft.ApplicationInsights.PerfCounterCollector。
以下示例控制台应用代码显示了如何设置实时指标:
using Microsoft.ApplicationInsights;
using Microsoft.ApplicationInsights.Extensibility;
using Microsoft.ApplicationInsights.Extensibility.PerfCounterCollector.QuickPulse;
using System;
using System.Threading.Tasks;

namespace LiveMetricsDemo
{
    class Program
    {
        static void Main(string[] args)
        {
            // Create a TelemetryConfiguration instance.
            TelemetryConfiguration config = TelemetryConfiguration.CreateDefault();
            config.ConnectionString = "<YOUR-CONNECTION-STRING>";
            QuickPulseTelemetryProcessor quickPulseProcessor = null;
            config.DefaultTelemetrySink.TelemetryProcessorChainBuilder
                .Use((next) =>
                {
                    quickPulseProcessor = new QuickPulseTelemetryProcessor(next);
                    return quickPulseProcessor;
                })
                .Build();

            var quickPulseModule = new QuickPulseTelemetryModule();

            // Secure the control channel.
            // This is optional, but recommended.
            quickPulseModule.AuthenticationApiKey = "<YOUR-API-KEY>";
            quickPulseModule.Initialize(config);
            quickPulseModule.RegisterTelemetryProcessor(quickPulseProcessor);

            // Create a TelemetryClient instance. It is important
            // to use the same TelemetryConfiguration here as the one
            // used to set up live metrics.
            TelemetryClient client = new TelemetryClient(config);

            // This sample runs indefinitely. Replace with actual application logic.
            while (true)
            {
                // Send dependency and request telemetry.
                // These will be shown in live metrics.
                // CPU/Memory Performance counter is also shown
                // automatically without any additional steps.
                client.TrackDependency("My dependency", "target", "http://sample",
                    DateTimeOffset.Now, TimeSpan.FromMilliseconds(300), true);
                client.TrackRequest("My Request", DateTimeOffset.Now,
                    TimeSpan.FromMilliseconds(230), "200", true);
                Task.Delay(1000).Wait();
            }
        }
    }
}
ASP.NET Core
若要手动配置实时指标,请执行以下操作:
安装 NuGet 包 Microsoft.ApplicationInsights.PerfCounterCollector。
以下示例控制台应用代码显示了如何设置实时指标:
using Microsoft.ApplicationInsights;
using Microsoft.ApplicationInsights.Extensibility;
using Microsoft.ApplicationInsights.Extensibility.PerfCounterCollector.QuickPulse;

// Create a TelemetryConfiguration instance.
TelemetryConfiguration config = TelemetryConfiguration.CreateDefault();
config.ConnectionString = "<YOUR-CONNECTION-STRING>";
QuickPulseTelemetryProcessor quickPulseProcessor = null;
config.DefaultTelemetrySink.TelemetryProcessorChainBuilder
    .Use((next) =>
    {
        quickPulseProcessor = new QuickPulseTelemetryProcessor(next);
        return quickPulseProcessor;
    })
    .Build();

var quickPulseModule = new QuickPulseTelemetryModule();

// Secure the control channel.
// This is optional, but recommended.
quickPulseModule.AuthenticationApiKey = "<YOUR-API-KEY>";
quickPulseModule.Initialize(config);
quickPulseModule.RegisterTelemetryProcessor(quickPulseProcessor);

// Create a TelemetryClient instance. It is important
// to use the same TelemetryConfiguration here as the one
// used to set up live metrics.
TelemetryClient client = new TelemetryClient(config);

// This sample runs indefinitely. Replace with actual application logic.
while (true)
{
    // Send dependency and request telemetry.
    // These will be shown in live metrics.
    // CPU/Memory Performance counter is also shown
    // automatically without any additional steps.
    client.TrackDependency("My dependency", "target", "http://sample",
        DateTimeOffset.Now, TimeSpan.FromMilliseconds(300), true);
    client.TrackRequest("My Request", DateTimeOffset.Now,
        TimeSpan.FromMilliseconds(230), "200", true);
    Task.Delay(1000).Wait();
}
前面的示例适用于控制台应用,但可在任何.NET应用程序中使用相同的代码。
重要
如果启用了任何其他遥测模块来自动收集遥测数据,请确保用于初始化这些模块的相同配置用于实时指标模块。
注释
默认配置收集 ILoggerWarning 日志和严重性级别更高的日志。 有关详细信息,请参阅如何自定义 ILogger 日志收集?。
辅助角色服务
通过 ILogger 发出的严重性为警告或更高级别的日志会被系统自动捕获。 若要更改此行为,请显式替代提供程序 ApplicationInsights的日志记录配置,如以下代码所示。 以下配置允许 Application Insights 捕获所有 Information 日志和更严重的日志。
{
  "Logging": {
    "LogLevel": {
      "Default": "Warning"
    },
    "ApplicationInsights": {
      "LogLevel": {
        "Default": "Information"
      }
    }
  }
}
请务必注意,以下示例不会导致 Application Insights 提供程序捕获 Information 日志。 由于 SDK 会添加一个默认的日志记录筛选器,该筛选器指示 ApplicationInsights 只捕获 Warning 日志和更严重的日志,所以不会捕获该信息。 Application Insights 需要显式替代。
{
  "Logging": {
    "LogLevel": {
      "Default": "Information"
    }
  }
}
注释
Application Insights 遵循通过 ConfigurationLogging(...) 在代码中配置的日志级别。 如果只使用 appsettings.json,并且未显式重写 ConfigureLogging,则默认日志级别为 Warning。
有关详细信息,请参阅 ILogger 文档 以自定义哪些日志级别被 Application Insights 捕获。
跟踪(日志)
本部分介绍如何将诊断跟踪日志从 ASP.NET 或 ASP.NET Core应用程序发送到 Application Insights,然后在门户中浏览/搜索这些日志。
可以使用跟踪日志来标识与每个用户请求关联的跟踪,并将其与其他事件和异常报告相关联。
Application Insights 通过 ILogger 从 ASP.NET Core和其他.NET应用捕获日志,并通过经典 SDK 和适配器从经典 ASP.NET(.NET框架)捕获日志。
注释
默认情况下,Application Insights 提供程序仅发送严重性为
Warning或更高级别的日志。 若要包括Information或更低级别的日志,请在appsettings.json中更新日志级别设置。Microsoft.ApplicationInsights.WorkerServiceNuGet 包(用于为后台服务启用 Application Insights)超出范围。若要查看常见问题解答,请参阅 Logging with .NET 常见问题解答。
为应用安装日志系统
ASP.NET
选择日志记录方法以发出 Application Insights 可以收集的诊断日志。
对于使用 System.Diagnostics 跟踪的经典 ASP.NET 应用,请在配置中配置 Application Insights TraceListener。
将侦听器添加到 web.config 或 app.config:
<configuration>
  <system.diagnostics>
    <trace>
      <listeners>
        <add name="myAppInsightsListener"
             type="Microsoft.ApplicationInsights.TraceListener.ApplicationInsightsTraceListener, Microsoft.ApplicationInsights.TraceListener" />
      </listeners>
    </trace>
  </system.diagnostics>
</configuration>
注释
日志捕获模块是第三方记录器的有用适配器。 但是,如果尚未使用 NLog、log4Net 或System.Diagnostics.Trace,请考虑直接调用 Application Insights TrackTrace()。
配置 Application Insights 以收集日志
选项 1: 如果尚未这样做,请将 Application Insights 添加到项目。 在Visual Studio中添加 Application Insights 时,可以选择包含日志收集器。
Option 2: 右键单击Solution Explorer中的项目以配置 Application Insights。 选择 “配置跟踪收集 ”选项。
注释
如果缺少 Application Insights 菜单或日志收集器选项,请参阅专用 故障排除文章。
ASP.NET Core
默认情况下,适用于 ASP.NET Core的 Application Insights SDK 已收集 ILogger 日志。 如果使用 SDK,通常不需要调用 builder.Logging.AddApplicationInsights() ,并且可以忽略以下 ILogger 安装说明。
如果只需要进行日志转发而不需要完整的遥测堆栈,则可以使用 Microsoft.Extensions.Logging.ApplicationInsights 提供程序包来捕获日志。
手动安装
如果应用程序类型不受 Application Insights 安装程序支持(例如,某些桌面/控制台场景),或者如果你希望显式地控制包级依赖关系,请使用此方法。
在 Solution Explorer 中,右键单击项目,然后选择 Manage NuGet 包。
搜索 Application Insights。
选择以下包之一:
-
ILogger: Microsoft.Extensions.Logging.ApplicationInsights

-
System.Diagnostics: Microsoft.ApplicationInsights.TraceListener

-
log4net: Microsoft.ApplicationInsights.Log4NetAppender

-
NLog: Microsoft.ApplicationInsights.NLogTarget

-
Microsoft.ApplicationInsights.EventSourceListener

-
Microsoft.ApplicationInsights.DiagnosticSourceListener

-
Microsoft.ApplicationInsights.EtwCollector

-
ILogger: Microsoft.Extensions.Logging.ApplicationInsights
NuGet 包会安装必要的程序集,并在适用情况下修改 web.config 或 app.config。
安装说明:
注释
展开以下任何部分的内容,获取特定于软件包的安装说明。
ILogger
添加
ApplicationInsightsLoggerProvider:
using Microsoft.Extensions.Logging.ApplicationInsights;

var builder = WebApplication.CreateBuilder(args);

// Add services to the container.

builder.Services.AddControllers();
// Learn more about configuring Swagger/OpenAPI at https://aka.ms/aspnetcore/swashbuckle
builder.Services.AddEndpointsApiExplorer();
builder.Services.AddSwaggerGen();

builder.Logging.AddApplicationInsights(
        configureTelemetryConfiguration: (config) =>
            config.ConnectionString = builder.Configuration.GetConnectionString("APPLICATIONINSIGHTS_CONNECTION_STRING"),
            configureApplicationInsightsLoggerOptions: (options) => { }
    );

builder.Logging.AddFilter<ApplicationInsightsLoggerProvider>("your-category", LogLevel.Trace);

var app = builder.Build();

// Configure the HTTP request pipeline.
if (app.Environment.IsDevelopment())
{
    app.UseSwagger();
    app.UseSwaggerUI();
}

app.UseHttpsRedirection();

app.UseAuthorization();

app.MapControllers();

app.Run();
安装 NuGet 包并通过依赖项注入注册提供程序后,该应用即可开始记录日志。 使用构造函数注入时,需要 ILogger 或泛型类型替代项 ILogger<TCategoryName> 。 解析这些实现后,ApplicationInsightsLoggerProvider 会提供它们。 记录的消息或异常会发送到 Application Insights。
考虑以下示例控制器:
public class ValuesController : ControllerBase
{
    private readonly ILogger _logger;

    public ValuesController(ILogger<ValuesController> logger)
    {
        _logger = logger;
    }

    [HttpGet]
    public ActionResult<IEnumerable<string>> Get()
    {
        _logger.LogWarning("An example of a Warning trace..");
        _logger.LogError("An example of an Error level message");

        return new string[] { "value1", "value2" };
    }
}
有关详细信息,请参阅 logging in ASP.NET Core 和 哪些 Application Insights 遥测类型是从 ILogger 日志生成的?可在何处查看 Application Insights 中的 ILogger 日志?。
插入诊断日志调用 (System.Diagnostics.Trace / log4net / NLog)
如果使用 System.Diagnostics.Trace,典型的调用是:
System.Diagnostics.Trace.TraceWarning("Slow response - database01");
如果您偏好log4net或NLog,请使用:
logger.Warn("Slow response - database01");
使用 EventSource 事件
可以将 System.Diagnostics.Tracing.EventSource 事件配置为作为跟踪发送到 Application Insights。
安装
Microsoft.ApplicationInsights.EventSourceListenerNuGet 包。编辑
TelemetryModules这一节的 ApplicationInsights.config 文件:<Add Type="Microsoft.ApplicationInsights.EventSourceListener.EventSourceTelemetryModule, Microsoft.ApplicationInsights.EventSourceListener"> <Sources> <Add Name="MyCompany" Level="Verbose" /> </Sources> </Add>
对于每个源,可以设置以下参数:
- 名称 指定要收集的 EventSource 的名称。
- 级别 指定要收集的日志记录级别:严重、错误、信息性、LogAlways、详细、或 警告。
- 关键字 (可选)指定要使用的关键字组合的整数值。
使用 DiagnosticSource 事件
可以将 System.Diagnostics.DiagnosticSource 事件配置为作为跟踪发送到 Application Insights。
安装
Microsoft.ApplicationInsights.DiagnosticSourceListenerNuGet 包。编辑
TelemetryModules这一节的 ApplicationInsights.config 文件:<Add Type="Microsoft.ApplicationInsights.DiagnosticSourceListener.DiagnosticSourceTelemetryModule, Microsoft.ApplicationInsights.DiagnosticSourceListener"> <Sources> <Add Name="MyDiagnosticSourceName" /> </Sources> </Add>
对于要跟踪的每个诊断源,请添加一个条目,并将Name属性设置为您的诊断源名称。
使用 ETW 事件
可以将 Windows 事件跟踪 (ETW) 事件配置为跟踪信息发送到 Application Insights。
安装
Microsoft.ApplicationInsights.EtwCollectorNuGet 包。编辑 ApplicationInsights.config 文件的“TelemetryModules”部分:
注释
仅当托管 SDK 的进程在性能日志用户或管理员成员的标识下运行时,才能收集 ETW 事件。
    <Add Type="Microsoft.ApplicationInsights.EtwCollector.EtwCollectorTelemetryModule, Microsoft.ApplicationInsights.EtwCollector">
      <Sources>
        <Add ProviderName="MyCompanyEventSourceName" Level="Verbose" />
      </Sources>
    </Add>
对于每个源,可以设置以下参数:
- ProviderName 是 ETW 提供程序的收集名称。
-
ProviderGuid 指定要收集的 ETW 提供程序的 GUID。 可以替代
ProviderName使用。 - 级别 设置要收集的日志记录级别。 它可以是 严重、 错误、 信息、 LogAlways、 详细或 警告。
- 关键字 (可选)设置要使用的关键字组合的整数值。
直接使用跟踪 API
可以直接调用 Application Insights 跟踪 API。 日志记录适配器使用此 API。 例如:
TelemetryConfiguration configuration = TelemetryConfiguration.CreateDefault();
var telemetryClient = new TelemetryClient(configuration);
telemetryClient.TrackTrace("Slow response - database01");
一个优点是 TrackTrace 能将相对较长的数据放入消息中。 例如,可以在那里对 POST 数据进行编码。
还可以向邮件添加严重性级别。 与其他遥测一样,可以添加属性值来帮助筛选或搜索不同的跟踪集。 例如:
TelemetryConfiguration configuration = TelemetryConfiguration.CreateDefault();
var telemetryClient = new TelemetryClient(configuration);
telemetryClient.TrackTrace("Slow database response",
                            SeverityLevel.Warning,
                            new Dictionary<string, string> { { "database", "db.ID" } });
现在,您可以在搜索中轻松筛选出与特定数据库相关的特定严重性级别的所有消息。
控制台应用程序
要将 Application Insights 日志记录添加到控制台应用程序,请先安装以下 NuGet 包:
以下示例使用了 Microsoft.Extensions.Logging.ApplicationInsights 包并演示了控制台应用程序的默认行为。
Microsoft.Extensions.Logging.ApplicationInsights 包应该在控制台应用程序中使用,或者在你只需要 Application Insights 的最小实现而不需要完整功能集(例如指标、分布式跟踪、采样和遥测初始化表达式)时使用。
using Microsoft.ApplicationInsights.Channel;
using Microsoft.ApplicationInsights.Extensibility;
using Microsoft.Extensions.DependencyInjection;
using Microsoft.Extensions.Logging;

using var channel = new InMemoryChannel();

try
{
    IServiceCollection services = new ServiceCollection();
    services.Configure<TelemetryConfiguration>(config => config.TelemetryChannel = channel);
    services.AddLogging(builder =>
    {
        // Only Application Insights is registered as a logger provider
        builder.AddApplicationInsights(
            configureTelemetryConfiguration: (config) => config.ConnectionString = "<YourConnectionString>",
            configureApplicationInsightsLoggerOptions: (options) => { }
        );
    });

    IServiceProvider serviceProvider = services.BuildServiceProvider();
    ILogger<Program> logger = serviceProvider.GetRequiredService<ILogger<Program>>();

    logger.LogInformation("Logger is working...");
}
finally
{
    // Explicitly call Flush() followed by Delay, as required in console apps.
    // This ensures that even if the application terminates, telemetry is sent to the back end.
    channel.Flush();

    await Task.Delay(TimeSpan.FromMilliseconds(1000));
}
有关详细信息,请参阅将从 ILogger 日志生成哪种类型的 Application Insights 遥测数据?可以在何处查看 Application Insights 中的 ILogger 日志?。
日志记录范围
注释
以下指南适用于 ILogger 方案(仅限 ASP.NET Core和控制台)。 不适用于经典 ASP.NET.
ApplicationInsightsLoggingProvider 支持日志范围(默认启用)。
如果范围的类型为 IReadOnlyCollection<KeyValuePair<string,object>>,则集合中的每个键值对都将作为自定义属性添加到 Application Insights 遥测中。 在下面的示例中,日志被捕获为 TraceTelemetry 并且在属性中具有 ("MyKey", "MyValue")。
using (_logger.BeginScope(new Dictionary<string, object> { ["MyKey"] = "MyValue" }))
{
    _logger.LogError("An example of an Error level message");
}
如果使用任何其他类型作为范围,它将存储在 Application Insights 遥测中的 Scope 属性下。 在下面的示例中,TraceTelemetry 具有包含该范围且名为 Scope 的属性。
using (_logger.BeginScope("hello scope"))
{
    _logger.LogError("An example of an Error level message");
}
查找日志
在调试模式下运行应用或实时部署应用。
在搜索中浏览
在 Application Insights 门户的应用概述窗格中,选择 搜索 以执行以下操作:
- 筛选日志跟踪记录或具有特定属性的项目。
- 详细检查特定项。
- 查找与同一用户请求相关的其他系统日志数据(具有相同的作 ID)。
- 将页面的配置保存为收藏夹。
注释
如果应用程序发送大量数据,并且使用的是 Application Insights SDK for ASP.NET 2.0.0-beta3 或更高版本,则 adaptive 采样功能可能会运行并仅发送部分遥测数据。 了解有关采样的详细信息。
在Azure Monitor日志中浏览
ILogger 日志呈现为跟踪遥测(Application Insights 中的表 traces 和 Log Analytics 中的 AppTraces)。
示例
在Azure门户中,转到 Application Insights 并运行:
traces
| where severityLevel >= 2 // 2=Warning, 1=Information, 0=Verbose
| take 50
分布式跟踪
新式云和 微服务 体系结构实现了简单的独立可部署服务,可降低成本,同时提高可用性和吞吐量。 但是,它使整个系统更难以推理和调试。 分布式跟踪通过提供类似于云和微服务体系结构的调用堆栈的性能探查器来解决此问题。
Azure Monitor提供了两种使用分布式跟踪数据的体验:单个事务/请求的 事务诊断视图和 应用映射视图,用于显示系统交互方式。
Application Insights 可以单独监视每个组件,并使用分布式遥测关联来检测哪个组件负责故障或性能下降。 本文介绍 Application Insights 使用的不同语言和平台上的数据模型、上下文传播技术、协议和关联策略的实现。
通过 Application Insights 使用 Autoinstrumentation 或 SDK 启用分布式跟踪。
适用于 .NET、.NET Core、Java、Node.js和 JavaScript 的 Application Insights 代理和 SDK 均本机支持分布式跟踪。
安装并配置正确的 Application Insights SDK 后,SDK 依赖项自动收集器会自动收集常用框架、库和技术的跟踪信息。 依赖项自动收集文档中提供了受支持的技术的完整列表。
可以通过在 TelemetryClient 上调用 TrackDependency 来手动跟踪任意技术。
用于遥测关联的数据模型
Application Insights 为分布式遥测关联定义 数据模型 。 若要将遥测与逻辑操作关联起来,每个遥测项都有一个名为operation_Id的上下文字段。 分布式跟踪中的每个遥测项都共享此标识符。 因此,即使从单个层丢失遥测数据,仍可以关联其他组件报告的遥测数据。
分布式逻辑操作通常由一组较小的操作组成,这些请求由其中一个组件进行处理。
请求遥测 定义这些操作。 每个请求遥测项都有自己的 id,标识它的唯一性和全球性。 与请求关联的所有遥测项(例如跟踪和异常)都应将operation_parentId设置为请求id的值。
依赖项遥测 表示每个传出操作,例如对另一个组件的 HTTP 调用。 它还定义了其自身全局唯一的 id。 请求遥测由这次依赖项调用启动,并使用此 id 作为其 operation_parentId。
可以使用operation_Id、operation_parentId和request.id配合dependency.id来构建分布式逻辑操作的视图。 这些字段还定义了遥测调用的因果关系顺序。
在微服务环境中,来自组件的跟踪可以转到不同的存储项。 每个组件都可以在 Application Insights 中有自己的连接字符串。 若要获取逻辑操作的遥测数据,Application Insights 会查询每个存储项的数据。
当存储项数较大时,需要一个提示,说明下一步要查找的位置。 Application Insights 数据模型定义了两个用于解决此问题的字段: request.source 以及 dependency.target。 第一个字段标识启动依赖项请求的组件。 第二个字段标识哪个组件返回了依赖项调用的响应。
有关从多个不同实例进行查询的信息,请参阅 在 Azure Monitor 中跨 Log Analytics 工作区、应用程序和资源查询数据。
示例
我们来看一个示例。 名为“股票价格”的应用程序使用名为 Stock 的外部 API 显示股票的当前市场价格。 股票价格应用程序中有一个名为“股票”的页面,客户端 Web 浏览器通过 GET /Home/Stock 打开该页面。 应用程序使用 HTTP 调用 GET /api/stock/value查询 Stock API。
可以通过运行查询来分析生成的遥测数据:
(requests | union dependencies | union pageViews)
| where operation_Id == "STYz"
| project timestamp, itemType, name, id, operation_ParentId, operation_Id
在结果中,所有遥测项共享根 operation_Id。 从页面发出 Ajax 调用时,会将新的唯一 ID (qJSXU) 分配给依赖项遥测,并将 pageView 的 ID 用作 operation_ParentId。 然后,服务器请求使用 Ajax ID 作为 operation_ParentId。
| 项目类型 | 姓名 | ID | operation_ParentId | operation_Id |
|---|---|---|---|---|
| 页面浏览量 | 库存页面 | STYz |
STYz |
|
| 依赖,依赖性 or 依赖关系 | GET /Home/Stock | qJSXU |
STYz |
STYz |
| 申请 | GET 首页/库存 | KqKwlrSt9PA= |
qJSXU |
STYz |
| 依赖,依赖性 or 依赖关系 | GET /api/stock/value | bBrf2L7mm2g= |
KqKwlrSt9PA= |
STYz |
对外部服务进行调用 GET /api/stock/value 时,需要知道该服务器的标识,以便可以相应地设置 dependency.target 字段。 当外部服务不支持监视时, target 将设置为服务的主机名。 示例为 stock-prices-api.com。 但是,如果服务通过返回预定义的 HTTP 标头来标识自身, target 则包含允许 Application Insights 通过查询该服务的遥测数据来生成分布式跟踪的服务标识。
使用 W3C TraceContext 的关联标头
Application Insights 正在转换为 W3C 跟踪上下文,后者定义:
-
traceparent:承载全局唯一的操作 ID 和调用的唯一标识符。 -
tracestate:承载特定于系统的跟踪上下文。
Application Insights SDK 的最新版本支持 Trace-Context 协议,但可能需要选择加入该协议。 (保留与 Application Insights SDK 支持的先前相关协议的向后兼容性。
相关 HTTP 协议(也称为 Request-Id)即将弃用。 此协议定义两个标头:
-
Request-Id:承载调用的全局唯一 ID。 -
Correlation-Context:承载分布式跟踪属性的名称/值对集合。
Application Insights 还定义了相关 HTTP 协议的 扩展 。 它使用 Request-Context 名称-值对来传递直接调用方或被调用方所使用的属性集合。 Application Insights SDK 使用此标头来设置 dependency.target 和 request.source 字段。
W3C Trace-Context和 Application Insights 数据模型的映射方式如下:
| Application Insights | W3C TraceContext |
|---|---|
Id和Request和Dependency |
parent-id |
Operation_Id |
trace-id |
Operation_ParentId |
此范围的父范围的 parent-id。 如果是根跨度,此字段必须为空。 |
有关详细信息,请参阅 Application Insights 遥测数据模型。
启用 W3C 分布式跟踪支持
默认情况下,所有最新的 .NET Framework/.NET Core SDK 中都启用了基于 W3C TraceContext 的分布式跟踪,并与旧版 Request-Id 协议向后兼容。
遥测关联
载入应用时,默认情况下会处理相关性。 无需执行任何特殊操作。
.NET运行时通过 Activity 和 DiagnosticSource 的帮助支持分布式操作
Application Insights .NET SDK 使用 DiagnosticSource 和 Activity 来收集和关联遥测数据。
依赖关系
自动跟踪的依赖项
适用于 .NET 和 .NET Core 的 Application Insights SDK 附带 DependencyTrackingTelemetryModule,这是自动收集依赖项的遥测模块。 该模块 DependencyTrackingTelemetryModule 作为 Microsoft.ApplicationInsights.DependencyCollector NuGet 包提供,并在使用 Microsoft.ApplicationInsights.Web NuGet 包或 Microsoft.ApplicationInsights.AspNetCore NuGet 包时自动引入。
DependencyTrackingTelemetryModule 目前自动跟踪以下依赖项:
| 依赖关系 | 详细信息 |
|---|---|
| HTTP/HTTPS | 本地或远程 HTTP/HTTPS 调用。 |
| WCF 调用 | 仅当使用基于 HTTP 的绑定时,才会自动跟踪。 |
| SQL | 使用 SqlClient 发出的调用。 有关如何捕获 SQL 查询,请参阅使用高级 SQL 跟踪获取完整的 SQL 查询。 |
| Azure Blob Storage、表存储或队列存储 | 使用 Azure Storage 客户端进行的调用。 |
| Azure Event Hubs客户端 SDK | 使用最新的包:https://nuget.org/packages/Azure.Messaging.EventHubs。 |
| Azure Service Bus客户端 SDK | 使用最新的包:https://nuget.org/packages/Azure.Messaging.ServiceBus。 |
| Azure Cosmos DB | 使用 HTTP/HTTPS 时会自动跟踪。 在直接模式下,使用 TCP 的操作跟踪会自动使用预览包 >= 3.33.0-preview 捕获。 有关更多详细信息,请访问文档。 |
如果依赖项不是自动收集的,可以通过跟踪依赖项调用手动跟踪它。
有关依赖项跟踪工作原理的详细信息,请参阅 Application Insights 中的依赖项跟踪。
自动依赖项监视的工作原理
使用
InstrumentationEngine(通过StatusMonitor或 Azure App Service 的 Application Insights 扩展启用)围绕所选方法应用字节码检测。EventSource回调用于从发出结构化事件的 .NET 类库中获取遥测数据。DiagnosticSource回调函数用于较新的 .NET 和 .NET Core SDK 以便从支持分布式追踪的库收集遥测数据。
在控制台应用中设置自动依赖项跟踪
若要自动跟踪来自.NET控制台应用的依赖项,请安装 NuGet 包Microsoft.ApplicationInsights.DependencyCollector并初始化 DependencyTrackingTelemetryModule:
    DependencyTrackingTelemetryModule depModule = new DependencyTrackingTelemetryModule();
    depModule.Initialize(TelemetryConfiguration.Active);
注释
对于 .NET Core 控制台应用,TelemetryConfiguration.Active已过时。
手动跟踪依赖项
下面是不自动收集的依赖项示例,需要手动跟踪它们:
- 仅当使用 HTTP/HTTPS](/cosmos-db/performance-tips#networking)时,才会自动跟踪Azure Cosmos DB。 Application Insights 不会自动捕获低于
2.22.0-Beta1的 SDK 版本的 TCP 模式。 - Redis
对于 SDK 不会自动收集的依赖项,可以通过标准自动收集模块使用的 TrackDependency API 手动跟踪它们。
示例
如果使用不是由你自行编写的程序集来生成代码,可对其所有调用进行计时。 这使你能够了解它对响应时间的影响。
若要使此数据显示在 Application Insights 中的依赖项图表中,请使用 TrackDependency 发送此数据:
    var startTime = DateTime.UtcNow;
    var timer = System.Diagnostics.Stopwatch.StartNew();
    try
    {
        // making dependency call
        success = dependency.Call();
    }
    finally
    {
        timer.Stop();
        telemetryClient.TrackDependency("myDependencyType", "myDependencyCall", "myDependencyData", startTime, timer.Elapsed, success);
    }
或者,可以使用 TelemetryClient 提供的扩展方法 StartOperation 和 StopOperation 来手动跟踪依赖项,如传出的依赖项跟踪中所示。
禁用标准依赖项跟踪模块
有关详细信息,请参阅遥测模块。
使用高级 SQL 跟踪获取完整的 SQL 查询
对于 SQL 调用,始终会收集服务器和数据库的名称,并将其存储为收集的 DependencyTelemetry 的名称。 另一个名为 data 的字段可以包含完整的 SQL 查询文本。
注释
Azure Functions需要单独的设置才能启用 SQL 文本集合。 有关详细信息,请参阅启用 SQL 查询收集。
ASP.NET
对于 ASP.NET 应用程序,通过字节代码检测(需要使用检测引擎或使用 Microsoft.Data.SqlClient NuGet 包而不是 System.Data.SqlClient 库)收集完整的 SQL 查询文本。 下表描述了用于启用完整 SQL 查询收集的平台特定步骤。
| 平台 | 获取完整 SQL 查询所要执行的步骤 |
|---|---|
| Azure App Service中的Web Apps | 在 Web 应用控制面板中,打开 Application Insights 窗格并在.NET下启用 SQL 命令。 |
| IIS 服务器(Azure Virtual Machines、本地等) | 使用 Microsoft.Data.SqlClient NuGet 包或使用 Application Insights 代理 PowerShell 模块安装检测引擎并重启 IIS。 |
| Azure 云服务 | 添加启动任务以安装 StatusMonitor。 应用程序应在构建时通过为 ASP.NET 或 ASP.NET Core 应用程序安装 NuGet 包来接入 ApplicationInsights SDK。 |
| IIS Express | 使用 Microsoft.Data.SqlClient NuGet 包。 |
| Azure App Service 中的 WebJobs | 使用 Microsoft.Data.SqlClient NuGet 包。 |
除了上述平台特定的步骤之外,还必须通过以下代码修改 文件来显式选择启用 SQL 命令集合ApplicationInsights.config:
<TelemetryModules>
  <Add Type="Microsoft.ApplicationInsights.DependencyCollector.DependencyTrackingTelemetryModule, Microsoft.AI.DependencyCollector">
    <EnableSqlCommandTextInstrumentation>true</EnableSqlCommandTextInstrumentation>
  </Add>
ASP.NET Core
对于 ASP.NET Core 应用程序,需要通过以下方式启用 SQL 文本集合:
services.ConfigureTelemetryModule<DependencyTrackingTelemetryModule>((module, o) => { module. EnableSqlCommandTextInstrumentation = true; });
在上述情况下,验证是否已正确安装该检测引擎的适当方法是验证收集的 DependencyTelemetry 的 SDK 版本是否为 rddp。 使用 rdddsd 或 rddf 将指示通过 DiagnosticSource 或 EventSource 回调收集依赖项,因此不会捕获完整的 SQL 查询。
例外
可以使用 Application Insights 来报告 Web 应用程序中的异常。 可将失败的请求与客户端和服务器上的异常和其他事件相关联,以便快速诊断原因。 本部分介绍了如何设置异常报告,显式报告异常,诊断故障,等等。
设置异常报告
可以设置 Application Insights 以报告服务器或客户端中发生的异常。 根据应用程序所依赖的平台,你需要相应的扩展或 SDK。
Server-side
要从服务器端应用程序报告异常,请考虑以下方案:
- 为 Azure Web 应用添加 Application Insights 扩展。
- 将 Application Monitoring Extension 应用于 Azure VM 和 Azure 虚拟机规模集下的 IIS 托管应用。
- 向应用代码添加 Application Insights SDK,在 IIS Web 服务器上运行 Application Insights Agent,或者为 Java Web 应用启用 Java 代理。
Client-side
借助 JavaScript SDK,客户端能够报告 Web 浏览器中发生的异常的功能。 若要在客户端设置有关报告异常的功能,请参阅用于网页的 Application Insights。
应用程序框架
对于某些应用程序框架,需要进行更多配置。 请考虑以下技术:
重要
本节主要从代码示例的角度讲解.NET框架应用程序。 适用于 .NET Framework 的一些方法在 .NET Core SDK 中已过时。
诊断失败和异常
Azure 门户
Application Insights 随附了特选的应用程序性能管理体验,可帮助你诊断受监视应用程序中发生的故障。
有关详细说明,请参阅使用 Application Insights 调查故障、性能和事务。
Visual Studio
在Visual Studio中打开应用解决方案。 使用 F5 在服务器或开发计算机上运行应用。 重新创建异常。
在 Visual Studio 中打开 Application Insights Search 遥测窗口。 调试时,选择“Application Insights”下拉框。
选择一份异常报告以显示其堆栈跟踪。 若要打开相关的代码文件,请在堆栈跟踪中选择行引用。
如果启用了 CodeLens,则会看到有关异常的数据:
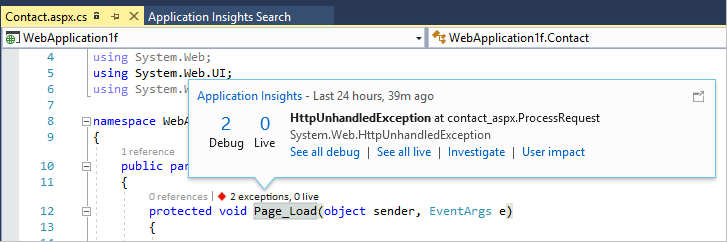

自定义跟踪和日志数据
要获取特定于应用的诊断数据,可插入代码以发送自己的遥测数据。 自定义遥测或日志数据与请求、页面视图和其他自动收集的数据一起显示在诊断搜索中。
使用 TelemetryClient,可以使用多个 API:
- TelemetryClient.TrackEvent 通常用于监视使用模式,但它发送的数据也会显示在诊断搜索中的 自定义事件 下。 事件可以进行命名,并可以带有在筛选诊断搜索时可依据的字符串属性和数值指标。
- TelemetryClient.TrackTrace 允许发送较长的数据,例如 POST 信息。
- TelemetryClient.TrackException 将异常详细信息(例如堆栈跟踪)发送到 Application Insights。
要查看这些事件,请在左侧菜单中打开“搜索”。 选择下拉菜单“事件类型”,然后选择“自定义事件”、“跟踪”或“异常”。

注释
如果你的应用生成大量遥测数据,则自适应采样模块仅发送一小部分事件,从而自动减少发送到门户的数据量。 属于同一操作的事件会作为一个组被选中或取消选中,以便你在相关事件之间进行导航。 有关详细信息,请参阅 Application Insights 中的采样。
查看请求 POST 数据
请求详细信息不包含在 POST 调用中发送到应用的数据。 若要报告此数据:
- 向你的应用代码添加 Application Insights SDK。
- 在应用程序中插入代码以调用 Microsoft.ApplicationInsights.TrackTrace()。 在消息参数中发送 POST 数据。 允许的大小有限制,因此,应该尝试仅发送必要数据。
- 调查失败的请求时,请查找关联的跟踪。
捕获异常和相关的诊断数据
默认情况下,并不是所有导致应用失败的异常都会显示在门户中。 如果在网页中使用 JavaScript SDK,则会看到浏览器异常。 但是,大多数服务器端异常由 IIS 截获,因此你需要添加一些代码来捕获和报告它们。
您可以:
- 通过在异常处理程序中插入代码来显式记录异常,从而报告这些异常。
- 通过配置 ASP.NET 框架自动捕获异常。 框架类型不同,必要的附加内容也不同。
显式报告异常
最简单的报告方法是在异常处理程序中插入对 trackException() 的调用。
C#
var telemetry = new TelemetryClient();

try
{
    // ...
}
catch (Exception ex)
{
    var properties = new Dictionary<string, string>
    {
        ["Game"] = currentGame.Name
    };

    var measurements = new Dictionary<string, double>
    {
        ["Users"] = currentGame.Users.Count
    };

    // Send the exception telemetry:
    telemetry.TrackException(ex, properties, measurements);
}
JavaScript
try
{
    // ...
}
catch (ex)
{
    appInsights.trackException(ex, "handler loc",
    {
        Game: currentGame.Name,
        State: currentGame.State.ToString()
    });
}
属性和测量参数是可选的,但对筛选和添加额外信息很有用。 例如,如果你有一个可以运行多个游戏的应用,则可以找到与特定游戏相关的异常报告。 可向每个字典添加任意数量的项。
浏览器异常
报告大多数浏览器异常。
如果网页包括来自内容分发网络或其他域的脚本文件,请确保脚本标记具有属性 crossorigin="anonymous",并且服务器可发送 CORS 头。 通过此行为,你可以从这些资源获取未经处理的 JavaScript 异常的堆栈跟踪和详细信息。
重用遥测客户端
注释
建议实例化 TelemetryClient 一次,并在应用程序的整个生命周期内重用它。
在 .NET 中使用 Dependency Injection (DI)、合适的 .NET SDK,以及针对 DI 正确配置 Application Insights 后,可以将 TelemetryClient 作为构造函数的参数。
public class ExampleController : ApiController
{
    private readonly TelemetryClient _telemetryClient;

    public ExampleController(TelemetryClient telemetryClient)
    {
        _telemetryClient = telemetryClient;
    }
}
在上面的示例中,TelemetryClient 将注入到 ExampleController 类中。
Web 窗体
对于 Web 窗体,没有为重定向配置 CustomErrors 时,HTTP 模块能够收集这些异常。 但是,如果有活动重定向,请在 Global.asax.cs 中将以下行添加到 Application_Error 函数。
void Application_Error(object sender, EventArgs e)
{
    if (HttpContext.Current.IsCustomErrorEnabled &&
        Server.GetLastError () != null)
    {
        _telemetryClient.TrackException(Server.GetLastError());
    }
}
在前面的示例中, _telemetryClient 它是 TelemetryClient 类型的类范围变量。
MVC
从 Application Insights Web SDK 2.6 版(beta3 及更高版本)开始,Application Insights 会自动收集 MVC 5+ 控制器方法中引发的未经处理异常。 如果你以前添加了自定义处理程序来跟踪此类异常,则可以将其移除,以防止对异常进行双重跟踪。
在某些情况下,当引发异常时,异常筛选器无法正确处理错误:
- 从控制器构造函数引发异常时
- 从消息处理程序引发异常时
- 在路由期间引发异常时
- 在响应内容序列化期间引发异常时
- 在应用程序启动期间引发异常时
- 在后台任务中引发异常时
仍需要手动跟踪应用程序处理的所有异常。 源自控制器的未经处理异常通常会导致 500“内部服务器错误”响应。 如果此类响应是由于已处理的异常或根本没有任何异常而手动构造的,则它是通过 ResultCode 500 在相应请求遥测数据中进行跟踪的。 但是,Application Insights SDK 无法跟踪相应异常。
以前版本支持
如果使用 Application Insights Web SDK 2.5(及更低版本)的 MVC 4(及更低版本),请参照以下示例跟踪异常。
展开可查看早期版本的说明
如果 CustomErrors 配置是 Off,则异常可供 HTTP 模块收集。 但是,如果它设置为 RemoteOnly(默认值)或 On,则异常会被清除,不可供 Application Insights 自动收集。 可以通过重写 System.Web.Mvc.HandleErrorAttribute 类并应用重写类来修复该行为,如用于不同的 MVC 版本所示(请参阅 GitHub 源代码):
using System;
using System.Web.Mvc;
using Microsoft.ApplicationInsights;

namespace MVC2App.Controllers
{
    [AttributeUsage(AttributeTargets.Class | AttributeTargets.Method, Inherited = true, AllowMultiple = true)]
    public class AiHandleErrorAttribute : HandleErrorAttribute
    {
        public override void OnException(ExceptionContext filterContext)
        {
            if (filterContext != null && filterContext.HttpContext != null && filterContext.Exception != null)
            {
                //The attribute should track exceptions only when CustomErrors setting is On
                //if CustomErrors is Off, exceptions will be caught by AI HTTP Module
                if (filterContext.HttpContext.IsCustomErrorEnabled)
                {   //Or reuse instance (recommended!). See note above.
                    var ai = new TelemetryClient();
                    ai.TrackException(filterContext.Exception);
                }
            }
            base.OnException(filterContext);
        }
    }
}
MVC 2
在控制器中将 HandleError 属性替换为新属性:
    namespace MVC2App.Controllers
    {
        [AiHandleError]
        public class HomeController : Controller
        {
            // Omitted for brevity
        }
    }
MVC 3
将 AiHandleErrorAttribute 注册为 Global.asax.cs 中的全局筛选器:
public class MyMvcApplication : System.Web.HttpApplication
{
    public static void RegisterGlobalFilters(GlobalFilterCollection filters)
    {
        filters.Add(new AiHandleErrorAttribute());
    }
}
MVC 4、MVC 5
将 AiHandleErrorAttribute 注册为 FilterConfig.cs 中的全局筛选器:
public class FilterConfig
{
    public static void RegisterGlobalFilters(GlobalFilterCollection filters)
    {
        // Default replaced with the override to track unhandled exceptions
        filters.Add(new AiHandleErrorAttribute());
    }
}
网络应用程序接口
从 Application Insights Web SDK 2.6 版(beta3 及更高版本)开始,Application Insights 会自动收集 Web API 2+ 控制器方法中引发的未经处理异常。 如果你之前添加了自定义处理程序来跟踪此类异常,如以下示例中所述,则可以将其移除,以防止对异常进行双重跟踪。
存在一些无法处理异常筛选器的情况。 例如:
- 从控制器构造函数引发的异常。
- 从消息处理程序引发的异常。
- 在路由过程中引发的异常。
- 在响应内容序列化期间引发的异常。
- 在应用程序启动过程中引发的异常。
- 在后台任务中引发的异常。
仍需要手动跟踪应用程序处理的所有异常。 源自控制器的未经处理异常通常会导致 500“内部服务器错误”响应。 如果此类响应是由于已处理的异常或根本没有任何异常而手动构造的,则它是通过 ResultCode 500 在相应请求遥测数据中进行跟踪的。 但是,Application Insights SDK 无法跟踪相应异常。
以前版本支持
如果使用 Application Insights Web SDK 2.5(及更低版本)的 Web API 1(及更低版本),请参阅以下示例以跟踪异常。
展开可查看早期版本的说明
Web API 1.x
替代 System.Web.Http.Filters.ExceptionFilterAttribute:
using System.Web.Http.Filters;
using Microsoft.ApplicationInsights;

namespace WebAPI.App_Start
{
    public class AiExceptionFilterAttribute : ExceptionFilterAttribute
    {
    public override void OnException(HttpActionExecutedContext actionExecutedContext)
    {
        if (actionExecutedContext != null && actionExecutedContext.Exception != null)
        {  //Or reuse instance (recommended!). See note above.
            var ai = new TelemetryClient();
            ai.TrackException(actionExecutedContext.Exception);
        }
        base.OnException(actionExecutedContext);
    }
    }
}
可将此被替代属性添加到特定控制器,或者将其添加到 WebApiConfig 类中的全局筛选器配置:
using System.Web.Http;
using WebApi1.x.App_Start;

namespace WebApi1.x
{
    public static class WebApiConfig
    {
        public static void Register(HttpConfiguration config)
        {
            config.Routes.MapHttpRoute(
                name: "DefaultApi",
                routeTemplate: "api/{controller}/{id}",
                defaults: new { id = RouteParameter.Optional });

            // ...
            config.EnableSystemDiagnosticsTracing();

            // Capture exceptions for Application Insights:
            config.Filters.Add(new AiExceptionFilterAttribute());
        }
    }
}
Web API 2.x
添加 IExceptionLogger 的实现:
using System.Web.Http.ExceptionHandling;
using Microsoft.ApplicationInsights;

namespace ProductsAppPureWebAPI.App_Start
{
    public class AiExceptionLogger : ExceptionLogger
    {
        public override void Log(ExceptionLoggerContext context)
        {
            if (context != null && context.Exception != null)
            {
                //or reuse instance (recommended!). see note above
                var ai = new TelemetryClient();
                ai.TrackException(context.Exception);
            }
            base.Log(context);
        }
    }
}
将此代码片段添加到 WebApiConfig 中的服务:
using System.Web.Http;
using System.Web.Http.ExceptionHandling;
using ProductsAppPureWebAPI.App_Start;

namespace WebApi2WithMVC
{
    public static class WebApiConfig
    {
        public static void Register(HttpConfiguration config)
        {
            // Web API configuration and services

            // Web API routes
            config.MapHttpAttributeRoutes();

            config.Routes.MapHttpRoute(
                name: "DefaultApi",
                routeTemplate: "api/{controller}/{id}",
                defaults: new { id = RouteParameter.Optional });

            config.Services.Add(typeof(IExceptionLogger), new AiExceptionLogger());
        }
    }
}
作为替代方法,可以:
- 仅将
ExceptionHandler实例替换为IExceptionHandler的自定义实现。 此异常处理程序仅在框架仍能够选择要发送哪个响应消息时(而不是在终止了连接等情况下)调用。 - 使用异常筛选器(如上述有关 Web API 1.x 控制器的部分中所述),这些筛选器并非在所有情况下都调用。
WCF
添加一个用来扩展 Attribute 并实现 IErrorHandler 和 IServiceBehavior 的类。
    using System;
    using System.Collections.Generic;
    using System.Linq;
    using System.ServiceModel.Description;
    using System.ServiceModel.Dispatcher;
    using System.Web;
    using Microsoft.ApplicationInsights;

    namespace WcfService4.ErrorHandling
    {
      public class AiLogExceptionAttribute : Attribute, IErrorHandler, IServiceBehavior
      {
        public void AddBindingParameters(ServiceDescription serviceDescription,
            System.ServiceModel.ServiceHostBase serviceHostBase,
            System.Collections.ObjectModel.Collection<ServiceEndpoint> endpoints,
            System.ServiceModel.Channels.BindingParameterCollection bindingParameters)
        {
        }

        public void ApplyDispatchBehavior(ServiceDescription serviceDescription,
            System.ServiceModel.ServiceHostBase serviceHostBase)
        {
            foreach (ChannelDispatcher disp in serviceHostBase.ChannelDispatchers)
            {
                disp.ErrorHandlers.Add(this);
            }
        }

        public void Validate(ServiceDescription serviceDescription,
            System.ServiceModel.ServiceHostBase serviceHostBase)
        {
        }

        bool IErrorHandler.HandleError(Exception error)
        {//or reuse instance (recommended!). see note above
            var ai = new TelemetryClient();

            ai.TrackException(error);
            return false;
        }

        void IErrorHandler.ProvideFault(Exception error,
            System.ServiceModel.Channels.MessageVersion version,
            ref System.ServiceModel.Channels.Message fault)
        {
        }
      }
    }
将属性添加到服务实现:
namespace WcfService4
{
    [AiLogException]
    public class Service1 : IService1
    {
        // Omitted for brevity
    }
}
异常性能计数器
如果在服务器上安装了 Azure Monitor Application Insights 代理,则可以获取.NET度量的异常率图表。 包括已处理和未经处理的.NET异常。
打开一个指标资源管理器选项卡并添加一个新图表。 在“性能计数器”下,选择“异常率”。
.NET Framework 通过计算间隔中的异常数并除以间隔长度来计算速率。
此计数与 Application Insights 门户通过对 TrackException 报告计数计算得出的“异常”计数不同。 采样间隔不同,并且 SDK 不会为所有已经处理和未经处理的异常发送 TrackException 报告。
自定义指标集合
Azure Monitor Application Insights .NET 和 .NET 核心 SDK 有两种不同的收集自定义指标的方法:
-
TrackMetric()方法,没有预聚合。 -
GetMetric()方法,具有预聚合。
建议使用聚合,因此 不再是收集自定义指标的首选方法。TrackMetric() 本文介绍如何使用 GetMetric() 方法及其工作原理背后的一些基本原理。
展开可了解有关预聚合与非预聚合 API 的详细信息
TrackMetric() 方法发送表示指标的原始遥测。 为每个值发送单个遥测项效率低。
TrackMetric() 方法在性能方面的效率也较低,因为每个 TrackMetric(item) 都要经过遥测初始化表达式和处理器的完整 SDK 管道。
与 TrackMetric() 不同,GetMetric() 为你处理本地预聚合,然后仅以一分钟的固定间隔提交经过汇总的指标摘要。 如果你需要在秒级甚至毫秒级密切监视某些自定义指标,则可以这样做,同时只需要承担每分钟监视一次的存储和网络流量成本。 此行为还大大减少了发生限制的风险,因为需要为聚合指标发送的遥测项总数会大大减少。
在 Application Insights 中,通过 TrackMetric() 和 GetMetric() 收集的自定义指标不受采样限制。 对重要指标采样可能会导致围绕这些指标生成的警报变得不可靠。 通过从不采样自定义指标,通常可以确信,一旦超过警报阈值,便会触发警报。 由于没有对自定义指标进行采样,因此存在一些潜在的问题。
如果需要每秒钟跟踪一个指标的趋势,或以更细粒度的间隔进行跟踪,这可能会导致:
- 增加了数据存储成本。 与发送到 Azure Monitor 的数据量相关的成本。 发送的数据越多,监视的总体成本就越高。
- 网络流量或性能开销增加。 在某些情况下,此类开销可能会产生货币成本和应用程序性能成本。
- 产生引入限制风险。 当应用在短时间间隔内发送高频率的遥测数据时,Azure Monitor会丢弃(“限制”)数据点。
限制是一个问题,因为它可能导致错过警报。 触发警报的情况可能在本地发生,然后由于发送的数据太多而在引入终结点被丢弃。 除非实现了自己的本地聚合逻辑,否则不建议对 .NET 和 .NET Core 使用 TrackMetric()。 如果尝试跟踪事件在给定时间段内发生的每个实例,则可能会发现 TrackEvent() 更适合。 请记住,与自定义指标不同,自定义事件受采样限制。 即使不编写自己的本地预聚合,也可以使用 TrackMetric()。 但如果这样做,请注意陷阱。
总之,建议使用 GetMetric(),因为它执行预聚合、从所有 Track() 调用中累积值,并每分钟发送一次摘要/汇总。 通过发送更少的数据点,同时仍然收集所有相关信息,GetMetric() 方法可以显著降低成本和性能开销。
GetMetric 入门
对于我们的示例,我们将使用一个基础的 .NET Core 3.1 工作服务应用程序。 如果要复制与这些示例一起使用的测试环境,请按照 .NET Core Worker Service 应用程序下的步骤 1-6进行作。 这些步骤会将 Application Insights 添加到基本辅助角色服务项目模板。 此概念适用于任何可以使用 SDK 的通用应用程序,包括 Web 应用和控制台应用。
发送指标
将 worker.cs 文件的内容替换为以下内容:
using System;
using System.Threading;
using System.Threading.Tasks;
using Microsoft.Extensions.Hosting;
using Microsoft.Extensions.Logging;
using Microsoft.ApplicationInsights;

namespace WorkerService3
{
    public class Worker : BackgroundService
    {
        private readonly ILogger<Worker> _logger;
        private TelemetryClient _telemetryClient;

        public Worker(ILogger<Worker> logger, TelemetryClient tc)
        {
            _logger = logger;
            _telemetryClient = tc;
        }

        protected override async Task ExecuteAsync(CancellationToken stoppingToken)
        {   // The following line demonstrates usages of GetMetric API.
            // Here "computersSold", a custom metric name, is being tracked with a value of 42 every second.
            while (!stoppingToken.IsCancellationRequested)
            {
                _telemetryClient.GetMetric("ComputersSold").TrackValue(42);

                _logger.LogInformation("Worker running at: {time}", DateTimeOffset.Now);
                await Task.Delay(1000, stoppingToken);
            }
        }
    }
}
运行示例代码时,会看到 while 循环重复执行,且不会在Visual Studio输出窗口中发送遥测数据。 在大约 60 秒时发送了一条遥测数据,在我们的测试中看起来是这样的:
Application Insights Telemetry: {"name":"Microsoft.ApplicationInsights.Dev.00000000-0000-0000-0000-000000000000.Metric", "time":"2019-12-28T00:54:19.0000000Z",
"ikey":"00000000-0000-0000-0000-000000000000",
"tags":{"ai.application.ver":"1.0.0.0",
"ai.cloud.roleInstance":"Test-Computer-Name",
"ai.internal.sdkVersion":"m-agg2c:2.12.0-21496",
"ai.internal.nodeName":"Test-Computer-Name"},
"data":{"baseType":"MetricData",
"baseData":{"ver":2,"metrics":[{"name":"ComputersSold",
"kind":"Aggregation",
"value":1722,
"count":41,
"min":42,
"max":42,
"stdDev":0}],
"properties":{"_MS.AggregationIntervalMs":"42000",
"DeveloperMode":"true"}}}}
此单一遥测数据条目代表了 41 个不同指标测量值的聚合。 由于我们反复发送相同的值,因此标准偏差 (stDev) 为 0,具有相同的最大值 (max) 和最小值 (min)。
value 属性表示聚合的所有单个值的总和。
注释
GetMetric 方法不支持跟踪最后一个值(例如 gauge)或跟踪直方图/分布。
如果我们在“日志(分析)”体验中检查 Application Insights 资源,此单独的遥测项将如以下屏幕截图所示。

注释
虽然原始遥测项在引入后不包含显式的总和属性/字段,但我们会为你创建一个。 在本例中,value 和 valueSum 属性都表示相同的内容。
还可以在门户的指标部分访问自定义指标遥测,作为基于日志的指标和自定义指标。 以下屏幕截图是基于日志的指标的一个示例。

用于高吞吐量使用情况的缓存指标引用
在某些情况下,可能会经常观察到指标值。 例如,每秒处理 500 个请求的高吞吐量服务可能希望为每个请求发出 20 个遥测指标。 该结果意味着每秒跟踪 10,000 个值。 在这种高吞吐量方案中,用户可能需要通过避免一些查找来帮助 SDK。
例如,上述示例对指标 ComputersSold 的句柄执行了查找操作,然后跟踪了观察到的值 42。 相反,用户应该缓存该句柄,以进行多次跟踪调用:
//...

        protected override async Task ExecuteAsync(CancellationToken stoppingToken)
        {
            // This is where the cache is stored to handle faster lookup
            Metric computersSold = _telemetryClient.GetMetric("ComputersSold");
            while (!stoppingToken.IsCancellationRequested)
            {

                computersSold.TrackValue(42);

                computersSold.TrackValue(142);

                _logger.LogInformation("Worker running at: {time}", DateTimeOffset.Now);
                await Task.Delay(50, stoppingToken);
            }
        }
除了缓存指标句柄之外,上述示例还将 Task.Delay 缩短到了 50 毫秒,这样循环将更频繁地执行, 从而导致了 772 次 TrackValue() 调用。
多维指标
上一部分中的示例显示了零维指标。 指标也可以是多维指标。 我们目前最多支持 10 个维度。
下面是如何创建一维指标的示例:
//...

        protected override async Task ExecuteAsync(CancellationToken stoppingToken)
        {
            // This is an example of a metric with a single dimension.
            // FormFactor is the name of the dimension.
            Metric computersSold= _telemetryClient.GetMetric("ComputersSold", "FormFactor");

            while (!stoppingToken.IsCancellationRequested)
            {
                // The number of arguments (dimension values)
                // must match the number of dimensions specified while GetMetric.
                // Laptop, Tablet, etc are values for the dimension "FormFactor"
                computersSold.TrackValue(42, "Laptop");
                computersSold.TrackValue(20, "Tablet");
                computersSold.TrackValue(126, "Desktop");


                _logger.LogInformation("Worker running at: {time}", DateTimeOffset.Now);
                await Task.Delay(50, stoppingToken);
            }
        }
运行示例代码至少 60 秒会导致三个不同的遥测项发送到Azure。 每个项都表示这三种外形规格之一的聚合。 与之前一样,你可以在“日志(分析)”视图中执行进一步检查。
在指标资源管理器中:

请注意,你无法按新的自定义维度拆分指标,也无法使用指标视图查看自定义维度。

默认情况下,Application Insights 资源中未启用指标资源管理器中的多维指标。
启用多维指标
要为 Application Insights 资源启用多维指标,请选择“使用情况和估计成本”“自定义指标”>“启用自定义指标维度的警报”“确定”>>。 有关详细信息,请参阅自定义指标维度和预聚合。
完成该更改并发送新的多维遥测数据后,可以选择“应用拆分”。
注释
只有在门户中启用该功能之后新发送的指标才会存储维度信息。

查看每个 FormFactor 维度的指标聚合。

当维度超过三个时使用 MetricIdentifier
目前支持 10 个维度。 使用三个以上的维度需要使用 MetricIdentifier:
// Add "using Microsoft.ApplicationInsights.Metrics;" to use MetricIdentifier
// MetricIdentifier id = new MetricIdentifier("[metricNamespace]","[metricId],"[dim1]","[dim2]","[dim3]","[dim4]","[dim5]");
MetricIdentifier id = new MetricIdentifier("CustomMetricNamespace","ComputerSold", "FormFactor", "GraphicsCard", "MemorySpeed", "BatteryCapacity", "StorageCapacity");
Metric computersSold = _telemetryClient.GetMetric(id);
computersSold.TrackValue(110,"Laptop", "Nvidia", "DDR4", "39Wh", "1TB");
自定义指标配置
如果想要更改指标配置,则必须在初始化指标的位置进行更改。
特殊维度名称
指标不使用用于访问它们的 TelemetryClient 的遥测上下文。 在 MetricDimensionNames 类中使用可用作常量的特殊维度名称是解决此限制的最佳方法。
以下 Special Operation Request Size 指标发送的指标聚合未将 设置为 Context.Operation.Name。Special Operation
TrackMetric() 方法或任何其他 TrackXXX() 方法已将 OperationName 正确设置为 Special Operation。
        //...
        TelemetryClient specialClient;
        private static int GetCurrentRequestSize()
        {
            // Do stuff
            return 1100;
        }
        int requestSize = GetCurrentRequestSize()

        protected override async Task ExecuteAsync(CancellationToken stoppingToken)
        {
            while (!stoppingToken.IsCancellationRequested)
            {
                //...
                specialClient.Context.Operation.Name = "Special Operation";
                specialClient.GetMetric("Special Operation Request Size").TrackValue(requestSize);
                //...
            }

        }
在这种情况下,使用 MetricDimensionNames 类中列出的特殊维度名称来指定 TelemetryContext 值。
例如,当下一语句生成的指标聚合发送到 Application Insights 云终结点时,其 Context.Operation.Name 数据字段设置为 Special Operation:
_telemetryClient.GetMetric("Request Size", MetricDimensionNames.TelemetryContext.Operation.Name).TrackValue(requestSize, "Special Operation");
此特殊维度的值被复制到 TelemetryContext 中,不用作普通维度。 如果你还需要保留一个操作维度以用于普通指标浏览,则需要为该目的创建单独的维度:
_telemetryClient.GetMetric("Request Size", "Operation Name", MetricDimensionNames.TelemetryContext.Operation.Name).TrackValue(requestSize, "Special Operation", "Special Operation");
维度和时序上限
为了防止遥测子系统意外耗尽资源,你可以控制每个指标的数据系列最大数量。 默认限制是每个指标的总数据系列不超过 1,000 个,每个维度的不同值不超过 100 个。
重要
对维度使用低基数值以避免限制。
在维度和时序上限的上下文中,我们使用 Metric.TrackValue(..) 来确保遵守限制。 如果已达到限制,则 Metric.TrackValue(..) 返回 False 并且不跟踪该值。 否则,它将返回 True。 如果指标的数据源于用户输入,该行为将很有用。
MetricConfiguration 构造函数采用一些选项来管理相应指标中的不同系列;同时还采用一个实现了 IMetricSeriesConfiguration 接口的类对象,用来指定该指标中每个系列的聚合行为:
var metConfig = new MetricConfiguration(seriesCountLimit: 100, valuesPerDimensionLimit:2,
                new MetricSeriesConfigurationForMeasurement(restrictToUInt32Values: false));

Metric computersSold = _telemetryClient.GetMetric("ComputersSold", "Dimension1", "Dimension2", metConfig);

// Start tracking.
computersSold.TrackValue(100, "Dim1Value1", "Dim2Value1");
computersSold.TrackValue(100, "Dim1Value1", "Dim2Value2");

// The following call gives 3rd unique value for dimension2, which is above the limit of 2.
computersSold.TrackValue(100, "Dim1Value1", "Dim2Value3");
// The above call doesn't track the metric, and returns false.
-
seriesCountLimit是指标可以包含的最大数据时序数目。 达到此限制时,对TrackValue()的调用将返回false,该调用通常会生成新序列。 -
valuesPerDimensionLimit以类似的方式限制每个维度的非重复值数。 -
restrictToUInt32Values决定是否应跟踪非负整数值。
以下示例演示如何发送消息以了解是否超过上限:
if (! computersSold.TrackValue(100, "Dim1Value1", "Dim2Value3"))
{
// Add "using Microsoft.ApplicationInsights.DataContract;" to use SeverityLevel.Error
_telemetryClient.TrackTrace("Metric value not tracked as value of one of the dimension exceeded the cap. Revisit the dimensions to ensure they are within the limits",
SeverityLevel.Error);
}
自定义操作跟踪
Application Insights SDK 自动跟踪传入的 HTTP 请求和对依赖服务的调用,例如 HTTP 请求和 SQL 查询。 通过跟踪和关联请求及依赖项,可了解由微服务组成的应用程序对这些微服务的整体响应能力和可靠性。
在一般情况下,有一类应用程序模式不受支持。 正确监视此类模式需要手动代码检测。 本部分介绍一些可能需要手动监测的模式,例如自定义队列处理和运行长期运行的后台任务。
本部分提供了有关如何使用 Application Insights SDK 跟踪自定义操作的指导。
概述
操作是由应用程序运行的一项逻辑工作。 它具有名称、开始时间、持续时间、结果和执行上下文(如用户名、属性和结果)。 如果操作 A 由操作 B 启动,则操作 B 设置为 A 的父级。一个操作只能有一个父操作,但可以有许多子操作。 有关操作和遥测关联的详细信息,请参阅 Application Insights 遥测关联。
在 Application Insights .NET SDK 中, 该作由抽象类OperationTelemetry及其后代RequestTelemetry和DependencyTelemetry描述。
传入操作跟踪
Application Insights Web SDK 会自动收集在 IIS 管道和所有 ASP.NET Core应用程序中运行的 ASP.NET 应用程序的 HTTP 请求。 有其他平台和框架的社区支持解决方案。 如果应用程序不受任何标准或社区支持解决方案的支持,可以手动进行检测。
需要自定义跟踪的另一个示例是,从队列接收项目的辅助角色。 对于某些队列,向队列添加消息的调用将作为依赖项进行跟踪。 不会自动收集描述消息处理的高级操作。
我们来了解可以跟踪此类操作的方式。
大致而言,此任务旨在创建 RequestTelemetry 并设置已知的属性。 在操作完成后,可跟踪遥测数据。 以下示例演示了此任务。
Owin 自托管应用中的 HTTP 请求
在此示例中,跟踪上下文根据 HTTP 关联协议进行传播。 用户应该会收到此处所述的标头。
展开可查看代码
public class ApplicationInsightsMiddleware : OwinMiddleware
{
    // You may create a new TelemetryConfiguration instance, reuse one you already have,
    // or fetch the instance created by Application Insights SDK.
    private readonly TelemetryConfiguration telemetryConfiguration = TelemetryConfiguration.CreateDefault();
    private readonly TelemetryClient telemetryClient = new TelemetryClient(telemetryConfiguration);

    public ApplicationInsightsMiddleware(OwinMiddleware next) : base(next) {}

    public override async Task Invoke(IOwinContext context)
    {
        // Let's create and start RequestTelemetry.
        var requestTelemetry = new RequestTelemetry
        {
            Name = $"{context.Request.Method} {context.Request.Uri.GetLeftPart(UriPartial.Path)}"
        };

        // If there is a Request-Id received from the upstream service, set the telemetry context accordingly.
        if (context.Request.Headers.ContainsKey("Request-Id"))
        {
            var requestId = context.Request.Headers.Get("Request-Id");
            // Get the operation ID from the Request-Id (if you follow the HTTP Protocol for Correlation).
            requestTelemetry.Context.Operation.Id = GetOperationId(requestId);
            requestTelemetry.Context.Operation.ParentId = requestId;
        }

        // StartOperation is a helper method that allows correlation of
        // current operations with nested operations/telemetry
        // and initializes start time and duration on telemetry items.
        var operation = telemetryClient.StartOperation(requestTelemetry);

        // Process the request.
        try
        {
            await Next.Invoke(context);
        }
        catch (Exception e)
        {
            requestTelemetry.Success = false;
            requestTelemetry.ResponseCode;
            telemetryClient.TrackException(e);
            throw;
        }
        finally
        {
            // Update status code and success as appropriate.
            if (context.Response != null)
            {
                requestTelemetry.ResponseCode = context.Response.StatusCode.ToString();
                requestTelemetry.Success = context.Response.StatusCode >= 200 && context.Response.StatusCode <= 299;
            }
            else
            {
                requestTelemetry.Success = false;
            }

            // Now it's time to stop the operation (and track telemetry).
            telemetryClient.StopOperation(operation);
        }
    }

    public static string GetOperationId(string id)
    {
        // Returns the root ID from the '|' to the first '.' if any.
        int rootEnd = id.IndexOf('.');
        if (rootEnd < 0)
            rootEnd = id.Length;

        int rootStart = id[0] == '|' ? 1 : 0;
        return id.Substring(rootStart, rootEnd - rootStart);
    }
}
HTTP 关联协议还声明 Correlation-Context 标头。 为了简单起见,此处省略了该操作。
队列检测
W3C 跟踪上下文和 HTTP 关联协议使用 HTTP 请求传递关联详细信息,但每个队列协议必须定义如何随队列消息传递相同的详细信息。 有些队列协议(例如 AMQP)允许传递更多元数据。 其他协议(例如 Azure Storage Queue)要求将上下文编码到消息负载中。
注释
队列尚不支持跨组件跟踪。
使用 HTTP 时,如果生成者和使用者将遥测数据发送到不同的 Application Insights 资源,则事务诊断体验和应用程序映射将显示事务和端到端映射。 对于队列,尚不支持此功能。
Service Bus 队列
有关跟踪信息,请参阅 通过 Azure Service Bus 消息传送实现的分布式跟踪和关联。
Azure Storage队列
以下示例演示如何跟踪 Azure Storage 队列操作,并关联生成者、使用者和Azure Storage 之间的遥测。
存储队列具有一个 HTTP API。 用于 HTTP 请求的 Application Insights Dependency Collector 会跟踪对该队列的所有调用。 它默认在 ASP.NET 和 ASP.NET Core应用程序上配置。 对于其他类型的应用程序,请参阅控制台应用程序文档。
用户可能还想将 Application Insights 操作 ID 与存储请求 ID 相关联。 有关如何设置和获取存储请求客户端和服务器请求 ID 的信息,请参阅 Monitor、诊断和故障排除 Azure Storage。
排队
由于存储队列支持 HTTP API,因此 Application Insights 会自动跟踪队列的所有操作。 在多数情况下,此检测已足够。 为了将使用者跟踪与生成者跟踪相关联,必须传递某些关联上下文,方法类似于 HTTP 关联协议中所执行的操作。
此示例演示如何跟踪 Enqueue 操作。 您可以:
-
关联重试(如果有):它们都有一个共同的父级,即
Enqueue操作。 否则,它们都作为传入请求的子级进行跟踪。 如果有多个对队列的逻辑请求,可能很难发现导致重试的调用。 - 关联存储日志(如果需要):它们与 Application Insights 遥测相关联。
Enqueue 操作是父操作的子级。 例如传入的 HTTP 请求。 HTTP 依赖项调用是 Enqueue 操作的子级以及传入请求的孙级。
public async Task Enqueue(CloudQueue queue, string message)
{
    var operation = telemetryClient.StartOperation<DependencyTelemetry>("enqueue " + queue.Name);
    operation.Telemetry.Type = "Azure queue";
    operation.Telemetry.Data = "Enqueue " + queue.Name;

    // MessagePayload represents your custom message and also serializes correlation identifiers into payload.
    // For example, if you choose to pass payload serialized to JSON, it might look like
    // {'RootId' : 'some-id', 'ParentId' : '|some-id.1.2.3.', 'message' : 'your message to process'}
    var jsonPayload = JsonConvert.SerializeObject(new MessagePayload
    {
        RootId = operation.Telemetry.Context.Operation.Id,
        ParentId = operation.Telemetry.Id,
        Payload = message
    });

    CloudQueueMessage queueMessage = new CloudQueueMessage(jsonPayload);

    // Add operation.Telemetry.Id to the OperationContext to correlate Storage logs and Application Insights telemetry.
    OperationContext context = new OperationContext { ClientRequestID = operation.Telemetry.Id};

    try
    {
        await queue.AddMessageAsync(queueMessage, null, null, new QueueRequestOptions(), context);
    }
    catch (StorageException e)
    {
        operation.Telemetry.Properties.Add("AzureServiceRequestID", e.RequestInformation.ServiceRequestID);
        operation.Telemetry.Success = false;
        operation.Telemetry.ResultCode = e.RequestInformation.HttpStatusCode.ToString();
        telemetryClient.TrackException(e);
    }
    finally
    {
        // Update status code and success as appropriate.
        telemetryClient.StopOperation(operation);
    }
}
若要减少应用程序报告的遥测数或者由于其他原因不想跟踪 Enqueue 操作,可直接使用 Activity API:
- 创建(并启动)新的
Activity,而不是启动 Application Insights 操作。 除了作名称之外, 无需 为其分配任何属性。 - 将
yourActivity.Id串行化到消息有效负载,而不是operation.Telemetry.Id。 还可以使用Activity.Current.Id。
出列
与 Enqueue 类似,Application Insights 自动跟踪对存储队列的实际 HTTP 请求。
Enqueue 操作可能发生在父上下文中,例如传入请求上下文。 Application Insights SDK 自动将此类操作及其 HTTP 部分与父请求和同一范围内报告的其他遥测相关联。
Dequeue 操作比较棘手。 Application Insights SDK 自动跟踪 HTTP 请求。 但是,在分析消息之前,它并不知道关联上下文。 不可能将获取消息的 HTTP 请求与遥测的其余部分相关联,特别是当收到多个消息时。
public async Task<MessagePayload> Dequeue(CloudQueue queue)
{
    var operation = telemetryClient.StartOperation<DependencyTelemetry>("dequeue " + queue.Name);
    operation.Telemetry.Type = "Azure queue";
    operation.Telemetry.Data = "Dequeue " + queue.Name;

    try
    {
        var message = await queue.GetMessageAsync();
    }
    catch (StorageException e)
    {
        operation.telemetry.Properties.Add("AzureServiceRequestID", e.RequestInformation.ServiceRequestID);
        operation.telemetry.Success = false;
        operation.telemetry.ResultCode = e.RequestInformation.HttpStatusCode.ToString();
        telemetryClient.TrackException(e);
    }
    finally
    {
        // Update status code and success as appropriate.
        telemetryClient.StopOperation(operation);
    }

    return null;
}
流程
在以下示例中,通过类似于跟踪传入 HTTP 请求的方式跟踪传入消息:
public async Task Process(MessagePayload message)
{
    // After the message is dequeued from the queue, create RequestTelemetry to track its processing.
    RequestTelemetry requestTelemetry = new RequestTelemetry { Name = "process " + queueName };

    // It might also make sense to get the name from the message.
    requestTelemetry.Context.Operation.Id = message.RootId;
    requestTelemetry.Context.Operation.ParentId = message.ParentId;

    var operation = telemetryClient.StartOperation(requestTelemetry);

    try
    {
        await ProcessMessage();
    }
    catch (Exception e)
    {
        telemetryClient.TrackException(e);
        throw;
    }
    finally
    {
        // Update status code and success as appropriate.
        telemetryClient.StopOperation(operation);
    }
}
同样,可以检测其他队列操作。 应该以类似于取消排队操作的方式检测速览操作。 不必检测队列管理操作。 Application Insights 会跟踪 HTTP 之类的操作,在大多数情况下,这就足够了。
检测消息删除时,请务必设置操作(关联)标识符。 或者,可以使用 Activity API。 这样就无需在遥测项目上设置操作标识符,因为 Application Insights SDK 会为用户完成:
- 从队列中获取项目后,创建新的
Activity。 - 使用
Activity.SetParentId(message.ParentId)关联使用者日志和生产者日志。 - 启动
Activity。 - 使用
Start/StopOperation帮助程序跟踪取消排队、处理和删除操作。 从同一个异步控制流(执行上下文)执行。 这样,它们就能正确关联。 - 停止
Activity。 - 使用
Start/StopOperation或手动调用Track遥测。
依赖项类型
Application Insights 使用依赖项类型来自定义 UI 体验。 对于队列,它识别以下可改善DependencyTelemetry的 类型:
- Azure Storage 的队列
Azure queue -
Azure Event Hubs用于 Azure Event Hubs - Azure Service Bus 的
Azure Service Bus
批处理
有些队列允许对一个请求的多条消息取消排队。 这类消息的处理可能彼此独立,而且属于不同的逻辑操作。 无法将 Dequeue 操作关联到正在处理的特定消息。
每条消息都应在自己的异步控制流中处理。 有关详细信息,请参阅传出依赖项跟踪部分。
长时间运行后台任务
某些应用程序可能因用户请求而启动长时间运行的操作。 从跟踪/检测的角度来看,它与请求或依赖项检测没有区别:
async Task BackgroundTask()
{
    var operation = telemetryClient.StartOperation<DependencyTelemetry>(taskName);
    operation.Telemetry.Type = "Background";
    try
    {
        int progress = 0;
        while (progress < 100)
        {
            // Process the task.
            telemetryClient.TrackTrace($"done {progress++}%");
        }
        // Update status code and success as appropriate.
    }
    catch (Exception e)
    {
        telemetryClient.TrackException(e);
        // Update status code and success as appropriate.
        throw;
    }
    finally
    {
        telemetryClient.StopOperation(operation);
    }
}
在此示例中,telemetryClient.StartOperation 创建 DependencyTelemetry 并填充相关上下文。 假设有一个父操作,它是由计划操作的传入请求创建的。 只要在与传入请求相同的异步控制流中启动 BackgroundTask,它就会与该父操作相关联。
BackgroundTask 和所有嵌套的遥测项自动与引发此项的请求相关联,即使请求结束也一样。
从不含与之关联的任何操作 (Activity) 的后台线程启动任务时,BackgroundTask 没有任何父级。 但是,它可以具有嵌套操作。 从任务报告的所有遥测项与 DependencyTelemetry 中创建的 BackgroundTask 相关联。
传出依赖项跟踪
用户可以跟踪自己的依赖项类型或不受 Application Insights 支持的操作。
Service Bus队列或存储队列中的 Enqueue 方法可用作此类自定义跟踪的示例。
自定义依赖项跟踪的常规方法是:
- 调用
TelemetryClient.StartOperation(扩展)方法,该方法填充关联所需的DependencyTelemetry属性和某些其他属性,例如开始时间、时间戳和持续时间。 - 在
DependencyTelemetry上设置其他自定义属性,比如名称和所需的任何其他上下文。 - 进行依赖项调用,并等它完成。
- 完成后,使用
StopOperation停止操作。 - 处理异常。
public async Task RunMyTaskAsync()
{
    using (var operation = telemetryClient.StartOperation<DependencyTelemetry>("task 1"))
    {
        try
        {
            var myTask = await StartMyTaskAsync();
            // Update status code and success as appropriate.
        }
        catch(...)
        {
            // Update status code and success as appropriate.
        }
    }
}
释放某个操作会导致该操作停止,因此可以这样做而不是调用 StopOperation。
警告
在某些情况下,未经处理的异常可能会阻止调用 finally,因此可能无法跟踪操作。
并行处理和跟踪操作
调用 StopOperation 只会停止已启动的操作。 如果当前运行的操作与要停止的操作不匹配,StopOperation 不执行任何操作。 如果在同一执行上下文中并行启动多个操作,则可能发生这种情况。
var firstOperation = telemetryClient.StartOperation<DependencyTelemetry>("task 1");
var firstTask = RunMyTaskAsync();

var secondOperation = telemetryClient.StartOperation<DependencyTelemetry>("task 2");
var secondTask = RunMyTaskAsync();

await firstTask;

// FAILURE!!! This will do nothing and will not report telemetry for the first operation
// as currently secondOperation is active.
telemetryClient.StopOperation(firstOperation);

await secondTask;
请确保始终在同一异步方法中调用 StartOperation 和处理操作,以隔离并行运行的操作。 如果操作是同步的(或非异步的),请包装进程并使用 Task.Run 跟踪。
public void RunMyTask(string name)
{
    using (var operation = telemetryClient.StartOperation<DependencyTelemetry>(name))
    {
        Process();
        // Update status code and success as appropriate.
    }
}

public async Task RunAllTasks()
{
    var task1 = Task.Run(() => RunMyTask("task 1"));
    var task2 = Task.Run(() => RunMyTask("task 2"));

    await Task.WhenAll(task1, task2);
}
ApplicationInsights 操作与 System.Diagnostics.Activity
System.Diagnostics.Activity 表示分布式跟踪上下文,由框架和库用来在进程内外创建和传播上下文,并关联遥测项。
Activity 与 System.Diagnostics.DiagnosticSource 配合运行,后者是框架/库之间的通知机制,用于通知需要关注的事件,例如传入或传出请求和异常。
活动是 Application Insights 中的顶级功能。 自动依赖项和请求集合严重依赖于活动以及 DiagnosticSource 事件。 如果你在应用程序中创建了 Activity,将不会导致创建 Application Insights 遥测。 Application Insights 需要接收 DiagnosticSource 事件,并需要了解事件名称和有效负载,以便将 Activity 转换为遥测数据。
每个 Application Insights 操作(请求或依赖项)都涉及 Activity。 调用 StartOperation 时,它会在下面创建 Activity。
StartOperation 是手动跟踪请求或依赖项遥测的推荐方法,并确保一切事项都是相关的。
计数器
Application Insights 支持性能计数器和事件计数器。 本指南概述了这两者,包括它们在.NET应用程序中的用途、配置和用法。
性能计数器内置于Windows作系统中,并提供预定义的指标,例如 CPU 使用率、内存消耗和磁盘活动。 这些计数器非常适合以最少的设置来监视标准性能指标。 它们有助于跟踪资源利用率或排查基于Windows的应用程序的系统级瓶颈,但不支持自定义特定于应用程序的指标。
Event 计数器跨多个平台工作,包括Windows、Linux 和 macOS。 它们允许开发人员定义和监视轻型、可自定义的特定于应用程序的指标,从而提供比性能计数器更大的灵活性。 当系统指标不足以满足要求或跨平台应用程序中需要详细遥测时,事件计数器非常有用。 它们需要显式实现和配置,这使得设置更加费力。
性能计数器
Windows提供各种性能计数器,例如用于收集处理器、内存和磁盘使用情况统计信息的计数器。 你还可以定义自己的性能计数器。
如果应用程序在本地主机或具有管理访问权限的虚拟机上的 Internet 信息服务器 (IIS) 下运行,则应用程序支持性能计数器收集。 作为Azure Web Apps运行的应用程序不能直接访问性能计数器,但 Application Insights 收集了一部分可用的计数器。
小窍门
与其他指标一样,可以设置警报以便在计数器超出指定的限制时收到警报。 若要设置警报,请打开“警报”窗格并选择“添加警报”。
先决条件
通过将其添加到 Performance Monitor Users 组,授予应用池服务帐户监视性能计数器的权限。
net localgroup "Performance Monitor Users" /add "IIS APPPOOL\NameOfYourPool"
查看计数器
“指标”窗格显示了一组默认的性能计数器。
ASP.NET
ASP.NET Web 应用程序的默认计数器:
- % 进程\处理器时间
- % 进程\处理器时间标准化
- 内存\可用字节数
- ASP.NET 请求数/秒
- .NET 公共语言运行时 (CLR) 引发的异常数/秒
- ASP.NET 应用程序请求执行时间
- 进程\私有字节
- Process\IO 数据字节数/秒
- ASP.NET 应用程序队列中的应用程序\请求
- 处理器(_Total)\% 处理器占用时间
ASP.NET Core
ASP.NET Core Web 应用程序的默认计数器:
- % 进程\处理器时间
- % 进程\处理器时间标准化
- 内存\可用字节数
- 进程\私有字节
- Process\IO 数据字节数/秒
- 处理器(_Total)\% 处理器占用时间
注释
ASP.NET Core中对性能计数器的支持有限:
- SDK 版本 2.4.1 及更高版本在 Azure Web Apps(Windows)中运行时,会自动收集性能指标。
- 如果应用程序在 Windows 上运行,且目标为
NETSTANDARD2.0或更高版本,2.7.1 及以上版本的 SDK 将收集性能计数器。 - 对于面向 .NET Framework 的应用程序,SDK 的所有版本都支持性能计数器。
- SDK 2.8.0 和更高版本在 Linux 中支持 CPU/内存计数器。 但不在 Linux 中支持其他计数器。 若要在 Linux(和其他非Windows环境中获取系统计数器),请使用事件计数器。
添加计数器
如果你需要的性能计数器未包括在指标列表中,则你可以添加它。
ASP.NET
选项 1:ApplicationInsights.config 中的配置
通过在本地服务器上使用此 PowerShell 命令,了解服务器中有哪些计数器可用:
Get-Counter -ListSet *有关详细信息,请参阅
Get-Counter。打开
ApplicationInsights.config。如果在开发期间将 Application Insights 添加到应用:
- 在项目中编辑
ApplicationInsights.config。 - 将其重新部署到服务器。
- 在项目中编辑
编辑性能收集器指令:
    <Add Type="Microsoft.ApplicationInsights.Extensibility.PerfCounterCollector.PerformanceCollectorModule, Microsoft.AI.PerfCounterCollector">
      <Counters>
        <Add PerformanceCounter="\Objects\Processes"/>
        <Add PerformanceCounter="\Sales(photo)\# Items Sold" ReportAs="Photo sales"/>
      </Counters>
    </Add>
可以捕获标准计数器和自己实现的计数器。
\Objects\Processes是在所有Windows系统上可用的标准计数器的一个示例。
\Sales(photo)\# Items Sold 是自定义计数器的一个示例,可在 Web 服务中实现。
格式为 \Category(instance)\Counter,而对于不具有实例的类别,仅为 \Category\Counter。
与 ReportAs 不匹配的计数器名称需要 [a-zA-Z()/-_ \.]+ 参数。
如果指定实例,它会成为所报告指标的 CounterInstanceName 维度。
选项 2:代码中的配置
请参阅以下部分。
ASP.NET Core
在 PerformanceCollectorModule 中 WebApplication.CreateBuilder() 方法后面配置 Program.cs:
using Microsoft.ApplicationInsights.Extensibility.PerfCounterCollector;

var builder = WebApplication.CreateBuilder(args);

builder.Services.AddApplicationInsightsTelemetry();

// The following configures PerformanceCollectorModule.

builder.Services.ConfigureTelemetryModule<PerformanceCollectorModule>((module, o) =>
    {
        // The application process name could be "dotnet" for ASP.NET Core self-hosted applications.
        module.Counters.Add(new PerformanceCounterCollectionRequest(@"\Process([replace-with-application-process-name])\Page Faults/sec", "DotnetPageFaultsPerfSec"));
    });

var app = builder.Build();
在代码中收集 ASP.NET Web 应用程序或 .NET/.NET Core 控制台应用程序的性能计数器
若要收集系统性能计数器并将其发送到 Application Insights,可以改编以下代码片段:
    var perfCollectorModule = new PerformanceCollectorModule();
    perfCollectorModule.Counters.Add(new PerformanceCounterCollectionRequest(
      @"\Process([replace-with-application-process-name])\Page Faults/sec", "PageFaultsPerfSec"));
    perfCollectorModule.Initialize(TelemetryConfiguration.Active);
或者,可以执行与所创建自定义指标相同的操作:
    var perfCollectorModule = new PerformanceCollectorModule();
    perfCollectorModule.Counters.Add(new PerformanceCounterCollectionRequest(
      @"\Sales(photo)\# Items Sold", "Photo sales"));
    perfCollectorModule.Initialize(TelemetryConfiguration.Active);
在 Azure App Service 上,针对运行在 Azure Web Apps 和 Windows 容器中的应用程序的性能计数器
部署到 Azure Web Apps 的 ASP.NET 和 ASP.NET Core 应用程序在特殊的沙盒环境中运行。 部署到Azure App Service的应用程序可以利用Windows容器或托管在沙盒环境中。 如果应用程序部署在Windows容器中,则容器映像中提供了所有标准性能计数器。
沙盒环境不允许直接访问系统性能计数器。 但是,有限的一部分计数器将作为环境变量公开,如作为环境变量公开的性能计数器中所述。 在此环境中只能使用一部分计数器。
适用于 ASP.NET 和 ASP.NET Core 的 Application Insights SDK 检测代码是否已部署到 Web 应用或非Windows容器。 检测确定是在沙盒环境中收集性能计数器,还是在Windows容器或虚拟机上托管时使用标准收集机制。
用于性能计数器的Log Analytics查询
可以在 Log Analytics 中搜索和显示性能计数器报告。
PerformanceCounters 架构公开每个性能计数器的 category、counter 名称和 instance 名称。 在每个应用程序的遥测中,将仅看到该应用程序的计数器。 例如,若要查看哪些计数器可用:
performanceCounters | summarize count(), avg(value) by category, instance, counter
此处的 Instance 是指性能计数器实例,而不是角色或服务器计算机实例。 通常,性能计数器实例名称会按进程或应用程序的名称对计数器(如处理器时间)进行分段。
若要获取最近一段时间内可用内存的图表:
performanceCounters | where counter == "Available Bytes" | summarize avg(value), min(value) by bin(timestamp, 1h) | render timechart
与其他遥测一样,performanceCounters 同样也具有列 cloud_RoleInstance,指示正在其上运行应用的主机服务器实例的标识。 例如,若要应用在不同计算机上的性能:
performanceCounters | where counter == "% Processor Time" and instance == "SendMetrics" | summarize avg(value) by cloud_RoleInstance, bin(timestamp, 1d)
性能计数器常见问题解答
若要查看常见问题解答 (FAQ),请参阅性能计数器常见问题解答。
事件计数器
EventCounter是.NET/.NET核心机制来发布和使用计数器或统计信息。 所有 OS 平台都支持 EventCounters - Windows、Linux 和 macOS。 它可以视为仅支持Windows系统的PerformanceCounters的跨平台等价物。
虽然用户可以发布任何自定义事件计数器以满足其需求,但默认情况下,.NET会发布一组这些计数器。 本文档逐步讲解在 Azure Application Insights 中收集和查看事件计数器(系统定义或用户定义的)所需的步骤。
小窍门
与其他指标一样,可以设置警报以便在计数器超出指定的限制时收到警报。 若要设置警报,请打开“警报”窗格并选择“添加警报”。
使用 Application Insights 收集 EventCounters
Application Insights 支持使用 EventCounters 来收集 EventCounterCollectionModule,新发布的 NuGet 包 Microsoft.ApplicationInsights.EventCounterCollector 中包含该模块。
使用 EventCounterCollectionModule 或 WorkerService 时,将自动启用 。
EventCounterCollectionModule 以 60 秒的收集频率(不可配置)收集计数器。 收集 EventCounters 时,不需要具备特殊的权限。 对于 ASP.NET Core应用程序,还需要添加 Microsoft.ApplicationInsights.AspNetCore 包。
dotnet add package Microsoft.ApplicationInsights.EventCounterCollector
dotnet add package Microsoft.ApplicationInsights.AspNetCore
已收集默认计数器
从 AspNetCore SDK 或 WorkerService SDK 的 2.15.0 版本开始,默认情况下不会收集任何计数器。 模块本身已启用,因此用户可以添加所需的计数器来收集它们。
若要获取由 .NET Runtime 发布的已知计数器列表,请参阅 Available Counters 文档。
自定义要收集的计数器
以下示例介绍如何添加/删除计数器。 使用 AddApplicationInsightsTelemetry() 或 AddApplicationInsightsWorkerService() 启用 Application Insights 遥测收集后,此自定义将作为应用程序服务配置的一部分完成。 下面是 ASP.NET Core应用程序中的示例代码。 有关其他类型的应用程序,请参阅 配置遥测模块。
using Microsoft.ApplicationInsights.Extensibility.EventCounterCollector;
using Microsoft.Extensions.DependencyInjection;

builder.Services.ConfigureTelemetryModule<EventCounterCollectionModule>(
        (module, o) =>
        {
            // Removes all default counters, if any.
            module.Counters.Clear();

            // Adds a user defined counter "MyCounter" from EventSource named "MyEventSource"
            module.Counters.Add(
                new EventCounterCollectionRequest("MyEventSource", "MyCounter"));

            // Adds the system counter "gen-0-size" from "System.Runtime"
            module.Counters.Add(
                new EventCounterCollectionRequest("System.Runtime", "gen-0-size"));
        }
    );
禁用 EventCounter 收集模块
可以使用 EventCounterCollectionModule 禁用 ApplicationInsightsServiceOptions。
以下示例使用 ASP.NET Core SDK。
using Microsoft.ApplicationInsights.AspNetCore.Extensions;
using Microsoft.Extensions.DependencyInjection;

var applicationInsightsServiceOptions = new ApplicationInsightsServiceOptions();
applicationInsightsServiceOptions.EnableEventCounterCollectionModule = false;
builder.Services.AddApplicationInsightsTelemetry(applicationInsightsServiceOptions);
类似的方法也可用于 Worker Service SDK,但命名空间必须更改,如下例所示。
using Microsoft.ApplicationInsights.AspNetCore.Extensions;
using Microsoft.Extensions.DependencyInjection;

var applicationInsightsServiceOptions = new ApplicationInsightsServiceOptions();
applicationInsightsServiceOptions.EnableEventCounterCollectionModule = false;
builder.Services.AddApplicationInsightsTelemetry(applicationInsightsServiceOptions);
Log Analytics事件计数器的查询
可以在 customMetrics 表中的 Log Analytics 中搜索和显示事件计数器报告。
例如,运行以下查询,以查看收集了哪些计数器并可用于查询:
customMetrics | summarize avg(value) by name
若要在最近一段时间内获取特定计数器(例如:ThreadPool Completed Work Item Count)的图表,请运行以下查询。
customMetrics
| where name contains "System.Runtime|ThreadPool Completed Work Item Count"
| where timestamp >= ago(1h)
| summarize avg(value) by cloud_RoleInstance, bin(timestamp, 1m)
| render timechart
与其他遥测一样,customMetrics 同样也具有列 ,指示正在其上运行应用的主机服务器实例的标识cloud_RoleInstance。 上述查询显示每个实例的计数器值,并可用于比较不同服务器实例的性能。
事件计数器常见问题解答
若要查看常见问题解答 (FAQ),请参阅事件计数器常见问题解答。
快照收集
若要了解如何为 ASP.NET 和 ASP.NET Core 应用程序配置快照收集,请参阅 在 Azure Service Fabric、云服务和虚拟机中启用 .NET 应用的快照调试器。
遥测数据的处理和过滤
本部分内容
筛选和预处理遥测
在从 SDK 发送遥测数据之前,可以编写代码来筛选、修改或扩充遥测数据。 处理包括从标准遥测模块发送的数据,例如 HTTP 请求集合和依赖项收集。
筛选 可以在通过 SDK 发送遥测数据之前,修改或丢弃这些数据,通过实现
ITelemetryProcessor。 例如,可以通过排除来自机器人的请求来减少遥测数据量。 与采样不同,你可以完全控制发送或丢弃的内容,但它会影响基于聚合日志的任何指标。 根据您丢弃项的方式,可能还会失去在相关项之间导航的可能性。通过实现
ITelemetryInitializer,为应用发送的任何遥测数据添加或修改属性。 例如,可以添加计算值或版本号,以便筛选门户中的数据。采样 可减少遥测量,而不会影响统计信息。 它会将相关的数据点放在一起,以便在诊断问题时在它们之间导航。 在门户中,总计数被乘以一个系数,以补偿采样的影响。
注释
SDK API 用于发送自定义事件和指标。
Filtering
通过此方法,你可以直接控制遥测流中包括或排除的内容。 筛选可用于删除发送到 Application Insights 的遥测项。 可以将筛选与采样结合使用,也可以单独使用。
若要筛选遥测数据,请编写遥测处理器并将其注册到 TelemetryConfiguration。 所有遥测都经过你的处理器。 可以选择将其从流中删除,或将其提供给链中的下一个处理器。 包括来自标准模块的遥测数据,例如 HTTP 请求收集器和依赖项收集器,以及你自己跟踪的遥测数据。 例如,可以筛选出机器人发出的请求或成功的依赖调用的遥测数据。
ITelemetryProcessor 和 ITelemetryInitializer
遥测处理器和遥测初始值设定项有何区别?
- 在使用它们时可以做的事情有一些重叠。 这两者都可用于添加或修改遥测的属性,不过我们建议出于此目的使用初始值设定项。
- 遥测初始值设定项始终在遥测处理器之前运行。
- 遥测初始值设定项可以多次调用。 按照约定,它们不会设置任何已设置的属性。
- 遥测处理器允许完全替换或放弃遥测项。
- 所有注册的遥测初始化程序都会被调用,以处理每个遥测项。 对于遥测处理器,SDK 保证调用第一个遥测处理器。 其余处理器是否被调用取决于前面的遥测处理器。
- 使用遥测初始化程序用更多属性丰富遥测数据,或覆盖现有属性。 使用遥测处理器筛选出遥测数据。
添加/修改属性
使用遥测初始化程序使用额外信息丰富遥测数据,或替代标准遥测模块设置的遥测属性。
例如,Web 包的 Application Insights 收集有关 HTTP 请求的遥测数据。 默认情况下,它会将响应代码 >=400 的任何请求标记为失败。 如果要将 400 视为成功,可以定义一个设置 success 属性的遥测初始值设定项。
如果提供了遥测初始化器,则在调用任何 Track*() 方法时都会调用它。 此初始化程序包括调用标准遥测模块的方法Track()。 按照约定,这些模块不会设置已由初始值设定项设置的任何属性。 在调用遥测处理器之前调用遥测初始值设定项,因此初始值设定项执行的任何扩充对处理器都可见。
遥测初始化表达式
若要使用其他信息来扩充遥测数据,或替代标准遥测模块设置的遥测属性,请使用遥测初始值设定项。
遥测初始值设定项设置连同每个遥测项一起发送的上下文属性。 可以编写自己的初始化器来设置上下文属性。
标准的初始值设定项均由 Web 或 WindowsServer NuGet 包设置:
| 初始化表达式 | Description |
|---|---|
AccountIdTelemetryInitializer |
设置 AccountId 属性。 |
AuthenticatedUserIdTelemetryInitializer |
根据 JavaScript SDK 的设定来设置 AuthenticatedUserId 属性。 |
AzureRoleEnvironmentTelemetryInitializer |
使用从 Azure 运行时环境中提取的信息更新所有遥测项的 RoleName 和 RoleInstance 属性的 Device 上下文。 |
BuildInfoConfigComponentVersionTelemetryInitializer |
对于包含从 MS 版本生成的 Version 文件提取的值的所有遥测项,更新 Component 上下文的 BuildInfo.config 属性。 |
ClientIpHeaderTelemetryInitializer |
根据请求的 Ip HTTP 标头更新所有遥测项的 Location 上下文的 X-Forwarded-For 属性。 |
DeviceTelemetryInitializer |
更新所有遥测项的 Device 上下文的以下属性:• Type 设置为 PC。• Id 设置为 Web 应用程序运行所在的计算机的域名。• OemName 设置为使用 WMI 从 Win32_ComputerSystem.Manufacturer 字段提取的值。• Model 设置为使用 WMI 从 Win32_ComputerSystem.Model 字段提取的值。• NetworkType 设置为从 NetworkInterface 属性中提取的值。• Language 设置为 CurrentCulture 属性的名称。 |
DomainNameRoleInstanceTelemetryInitializer |
对于包含 Web 应用程序运行所在计算机的域名的所有遥测项,更新 RoleInstance 上下文的 Device 属性。 |
OperationNameTelemetryInitializer |
更新 Name 的 RequestTelemetry 属性以及基于 HTTP 方法的所有遥测项的 Name 上下文的 Operation 属性,以及调用 ASP.NET MVC控制器和作的名称来处理请求。 |
OperationIdTelemetryInitializer 或 OperationCorrelationTelemetryInitializer |
在处理包含自动生成的 Operation.Id 的请求时,更新跟踪的所有遥测项的 RequestTelemetry.Id 上下文属性。 |
SessionTelemetryInitializer |
对于包含从用户浏览器中运行的 Id JavaScript 检测代码生成的 Session Cookie 提取的值的所有遥测项,更新 ai_session 上下文的 ApplicationInsights 属性。 |
SyntheticTelemetryInitializer 或 SyntheticUserAgentTelemetryInitializer |
在处理来自综合源(例如可用性测试或搜索引擎 Bot)的请求时,更新跟踪的所有遥测项的 User、Session 和 Operation 上下文属性。 默认情况下,指标资源管理器不显示综合遥测数据。<Filters> 设置请求的标识属性。 |
UserTelemetryInitializer |
对于包含从用户浏览器中运行的 Application Insights JavaScript 检测代码生成的 Id Cookie 提取的值的所有遥测项,更新 AcquisitionDate 上下文的 User 和 ai_user 属性。 |
WebTestTelemetryInitializer |
设置用户 ID、会话 ID,以及来自可用性测试的 HTTP 请求的综合源属性。<Filters> 设置请求的标识属性。 |
注释
对于在Azure Service Fabric中运行的.NET应用程序,可以包含 Microsoft.ApplicationInsights.ServiceFabric NuGet 包。 该包所含的 FabricTelemetryInitializer 属性会将 Service Fabric 属性添加到遥测项。 有关此 NuGet 包添加的属性的详细信息,请参阅GitHub页面。
添加 ITelemetryInitializer
此博客 介绍通过自动向依赖项发送常规 ping 来诊断依赖项问题的项目。
定义初始化器
using System;
using Microsoft.ApplicationInsights.Channel;
using Microsoft.ApplicationInsights.DataContracts;
using Microsoft.ApplicationInsights.Extensibility;

namespace MvcWebRole.Telemetry
{
  /*
   * Custom TelemetryInitializer that overrides the default SDK
   * behavior of treating response codes >= 400 as failed requests
   *
   */
    public class MyTelemetryInitializer : ITelemetryInitializer
    {
        public void Initialize(ITelemetry telemetry)
        {
            var requestTelemetry = telemetry as RequestTelemetry;
            // Is this a TrackRequest() ?
            if (requestTelemetry == null) return;
            int code;
            bool parsed = Int32.TryParse(requestTelemetry.ResponseCode, out code);
            if (!parsed) return;
            if (code >= 400 && code < 500)
            {
                // If we set the Success property, the SDK won't change it:
                requestTelemetry.Success = true;

                // Allow us to filter these requests in the portal:
                requestTelemetry.Properties["Overridden400s"] = "true";
            }
            // else leave the SDK to set the Success property
        }
    }
}
加载初始化器
ASP.NET
选项 1:代码中的配置
protected void Application_Start()
{
    // ...
    TelemetryConfiguration.Active.TelemetryInitializers.Add(new MyTelemetryInitializer());
}
选项 2:ApplicationInsights.config 中的配置
<ApplicationInsights>
    <TelemetryInitializers>
    <!-- Fully qualified type name, assembly name: -->
    <Add Type="MvcWebRole.Telemetry.MyTelemetryInitializer, MvcWebRole"/>
    ...
    </TelemetryInitializers>
</ApplicationInsights>
有关详细信息,请参阅 此示例。
注释
请确保 applicationinsights.config 文件位于输出目录中,并包含任何最近的更改。
ASP.NET Core
使用
ApplicationInsights.config或TelemetryConfiguration.Active在 ASP.NET Core 应用程序中添加初始化程序是无效的。
对于使用 ASP.NET Core编写的应用,通过将新遥测初始值设定项添加到 DependencyInjection 容器来完成,如下所示。 在 Startup.ConfigureServices 方法中完成此步骤。
var builder = WebApplication.CreateBuilder(args);

builder.Services.AddSingleton<ITelemetryInitializer, MyCustomTelemetryInitializer>();

var app = builder.Build();
注释
builder.Services.AddSingleton<ITelemetryInitializer, MyCustomTelemetryInitializer>(); 适用于简单的初始化程序。 对于其他情况,builder.Services.AddSingleton(new MyCustomTelemetryInitializer() { fieldName = "myfieldName" });是必需的。
移除遥测初始化器
默认情况下,遥测初始化器是存在的。 若要删除所有或特定的遥测初始化表达式,请在调用 AddApplicationInsightsTelemetry()使用以下示例代码。
var builder = WebApplication.CreateBuilder(args);

builder.Services.AddApplicationInsightsTelemetry();

// Remove a specific built-in telemetry initializer
var tiToRemove = builder.Services.FirstOrDefault<ServiceDescriptor>
                    (t => t.ImplementationType == typeof(AspNetCoreEnvironmentTelemetryInitializer));
if (tiToRemove != null)
{
    builder.Services.Remove(tiToRemove);
}

// Remove all initializers
// This requires importing namespace by using Microsoft.Extensions.DependencyInjection.Extensions;
builder.Services.RemoveAll(typeof(ITelemetryInitializer));

var app = builder.Build();
辅助角色服务
使用
ApplicationInsights.config或TelemetryConfiguration.Active为 Worker Service SDK 添加初始值设定项无效。
对于使用 Worker Service 编写的应用程序,添加新的遥测初始值设定项是通过将其添加到 DependencyInjection 容器中来完成的,如下所示。 在 Startup.ConfigureServices 方法中完成此步骤。
    using Microsoft.ApplicationInsights.Extensibility;

    public void ConfigureServices(IServiceCollection services)
    {
        services.AddSingleton<ITelemetryInitializer, MyCustomTelemetryInitializer>();
        services.AddApplicationInsightsTelemetryWorkerService();
    }
移除遥测初始化器
默认情况下,遥测初始化程序存在。 若要删除所有或特定的遥测初始化表达式,请在调用 AddApplicationInsightsTelemetryWorkerService()使用以下示例代码。
   public void ConfigureServices(IServiceCollection services)
   {
        services.AddApplicationInsightsTelemetryWorkerService();
        // Remove a specific built-in telemetry initializer.
        var tiToRemove = services.FirstOrDefault<ServiceDescriptor>
                            (t => t.ImplementationType == typeof(AspNetCoreEnvironmentTelemetryInitializer));
        if (tiToRemove != null)
        {
            services.Remove(tiToRemove);
        }

        // Remove all initializers.
        // This requires importing namespace by using Microsoft.Extensions.DependencyInjection.Extensions;
        services.RemoveAll(typeof(ITelemetryInitializer));
   }
示例 ITelemetryInitializers
添加自定义属性
以下示例初始值设定项将自定义属性添加到每个被监控的遥测数据中。
public void Initialize(ITelemetry item)
{
    var itemProperties = item as ISupportProperties;
    if(itemProperties != null && !itemProperties.Properties.ContainsKey("customProp"))
    {
        itemProperties.Properties["customProp"] = "customValue";
    }
}
添加云角色名称和云角色实例
步骤 1:编写自定义 TelemetryInitializer
以下示例初始化程序将云角色名称设置为每个跟踪的遥测。
using Microsoft.ApplicationInsights.Channel;
using Microsoft.ApplicationInsights.Extensibility;

namespace CustomInitializer.Telemetry
{
    public class MyTelemetryInitializer : ITelemetryInitializer
    {
        public void Initialize(ITelemetry telemetry)
        {
            if (string.IsNullOrEmpty(telemetry.Context.Cloud.RoleName))
            {
                //set custom role name here
                telemetry.Context.Cloud.RoleName = "Custom RoleName";
                telemetry.Context.Cloud.RoleInstance = "Custom RoleInstance";
            }
        }
    }
}
步骤 2:将初始化程序加载到 TelemetryConfiguration
ASP.NET
在 ApplicationInsights.config 文件中:
    <ApplicationInsights>
      <TelemetryInitializers>
        <!-- Fully qualified type name, assembly name: -->
        <Add Type="CustomInitializer.Telemetry.MyTelemetryInitializer, CustomInitializer"/>
        ...
      </TelemetryInitializers>
    </ApplicationInsights>
ASP.NET Web 应用的替代方法是在代码中实例化初始值设定项。 以下示例演示 Global.aspx.cs 文件中的代码:
 using Microsoft.ApplicationInsights.Extensibility;
 using CustomInitializer.Telemetry;

    protected void Application_Start()
    {
        // ...
        TelemetryConfiguration.Active.TelemetryInitializers.Add(new MyTelemetryInitializer());
    }
ASP.NET Core
若要添加新 TelemetryInitializer 实例,请将其添加到依赖关系注入容器。 以下示例演示此方法。 将此代码添加到 ConfigureServices 方法中,属于 Startup.cs 类。
 using Microsoft.ApplicationInsights.Extensibility;
 using CustomInitializer.Telemetry;
 public void ConfigureServices(IServiceCollection services)
{
    services.AddSingleton<ITelemetryInitializer, MyTelemetryInitializer>();
}
控制用于地理位置映射的客户端 IP 地址
以下示例初始化函数在遥测引入期间设置用于地理位置匹配的客户端 IP,而不是客户端套接字 IP 地址。
public void Initialize(ITelemetry telemetry)
{
    var request = telemetry as RequestTelemetry;
    if (request == null) return true;
    request.Context.Location.Ip = "{client ip address}"; // Could utilize System.Web.HttpContext.Current.Request.UserHostAddress;
    return true;
}
遥测处理器
将遥测数据从 SDK 发送到门户之前,遥测处理器可以筛选和修改每个遥测项。
实现 ITelemetryProcessor
遥测处理器构造一个处理链。 实例化遥测处理器时,可以获取对链中下一个处理器的引用。 当遥测数据点传递到进程方法时,它会执行其工作,然后调用链中的下一个遥测处理器(或不调用)。
using Microsoft.ApplicationInsights.Channel;
using Microsoft.ApplicationInsights.Extensibility;
using Microsoft.ApplicationInsights.DataContracts;

public class SuccessfulDependencyFilter : ITelemetryProcessor
{
    private ITelemetryProcessor Next { get; set; }

    // next will point to the next TelemetryProcessor in the chain.
    public SuccessfulDependencyFilter(ITelemetryProcessor next)
    {
        this.Next = next;
    }

    public void Process(ITelemetry item)
    {
        // To filter out an item, return without calling the next processor.
        if (!OKtoSend(item)) { return; }

        this.Next.Process(item);
    }

    // Example: replace with your own criteria.
    private bool OKtoSend (ITelemetry item)
    {
        var dependency = item as DependencyTelemetry;
        if (dependency == null) return true;

        return dependency.Success != true;
    }
}
添加您的处理器
ASP.NET
在 ApplicationInsights.config中插入此代码片段:
<TelemetryProcessors>
    <Add Type="WebApplication9.SuccessfulDependencyFilter, WebApplication9">
    <!-- Set public property -->
    <MyParamFromConfigFile>2-beta</MyParamFromConfigFile>
    </Add>
</TelemetryProcessors>
可以通过在类中提供公共命名属性,从 .config 文件中传递字符串值。
警告
请注意,将 .config 文件中的类型名称和任何属性名称与代码中的类和属性名称匹配。 如果 .config 文件引用不存在的类型或属性,SDK 可能无法以无提示方式发送任何遥测数据。
或者,可以在代码中初始化筛选器。 在合适的初始化类中(例如 Global.asax.cs 中的 AppStart),将处理器插入到链中:
注释
下面的代码示例已过时,但供后人使用。 请考虑 开始使用 OpenTelemetry 或 迁移到 OpenTelemetry。
var builder = TelemetryConfiguration.Active.DefaultTelemetrySink.TelemetryProcessorChainBuilder;
builder.Use((next) => new SuccessfulDependencyFilter(next));

// If you have more processors:
builder.Use((next) => new AnotherProcessor(next));

builder.Build();
在此点之后创建的遥测客户端使用您的处理器。
自适性采样遥测处理器(从 2.0.0-beta3 开始)
此功能默认处于启用状态。 如果应用程序要发送大量遥测数据,此处理器将删除某些遥测数据。
    <TelemetryProcessors>
        <Add Type="Microsoft.ApplicationInsights.WindowsServer.TelemetryChannel.AdaptiveSamplingTelemetryProcessor, Microsoft.AI.ServerTelemetryChannel">
        <MaxTelemetryItemsPerSecond>5</MaxTelemetryItemsPerSecond>
        </Add>
    </TelemetryProcessors>
参数将提供算法尝试实现的目标。 SDK 的每个实例都独立工作。 因此,如果服务器是由多个计算机组成的群集,实际遥测量会相应地倍增。
了解有关采样的详细信息。
固定速率采样遥测处理器(从 2.0.0-beta1 开始)
此外,还有一个标准的采样遥测处理器(自版本 2.0.1 起):
    <TelemetryProcessors>
        <Add Type="Microsoft.ApplicationInsights.WindowsServer.TelemetryChannel.SamplingTelemetryProcessor, Microsoft.AI.ServerTelemetryChannel">

        <!-- Set a percentage close to 100/N where N is an integer. -->
        <!-- E.g. 50 (=100/2), 33.33 (=100/3), 25 (=100/4), 20, 1 (=100/100), 0.1 (=100/1000) -->
        <SamplingPercentage>10</SamplingPercentage>
        </Add>
    </TelemetryProcessors>
ASP.NET Core
注释
使用 ApplicationInsights.config 或 TelemetryConfiguration.Active 来添加处理器对 ASP.NET Core 应用程序或使用 Microsoft.ApplicationInsights.WorkerService SDK 的情况均无效。
对于 ASP.NET Core,通过使用 AddApplicationInsightsTelemetryProcessor 上的 IServiceCollection 扩展方法添加新的遥测处理器,如下所示。 在您的ConfigureServices类的Startup.cs方法中调用此方法。
var builder = WebApplication.CreateBuilder(args);

// ...
builder.Services.AddApplicationInsightsTelemetry();
builder.Services.AddApplicationInsightsTelemetryProcessor<MyFirstCustomTelemetryProcessor>();

// If you have more processors:
builder.Services.AddApplicationInsightsTelemetryProcessor<MySecondCustomTelemetryProcessor>();

var app = builder.Build();
若要在 ASP.NET Core 中注册需要参数的遥测处理器,请创建实现 ITelemetryProcessorFactory 的自定义类。 在 Create 方法中使用所需参数调用构造函数,然后使用 AddSingleton<ITelemetryProcessorFactory、MyTelemetryProcessorFactory>()。
辅助角色服务
注释
使用 ApplicationInsights.config 或 TelemetryConfiguration.Active 来添加处理器对 ASP.NET Core 应用程序或使用 Microsoft.ApplicationInsights.WorkerService SDK 的情况均无效。
对于 Worker Service,添加新的遥测处理器是通过在 AddApplicationInsightsTelemetryProcessor 使用 IServiceCollection 扩展方法来完成的,如下所示。 在您的ConfigureServices类的Startup.cs方法中调用此方法。
    public void ConfigureServices(IServiceCollection services)
    {
        services.AddApplicationInsightsTelemetryWorkerService();
        services.AddApplicationInsightsTelemetryProcessor<MyFirstCustomTelemetryProcessor>();
        // If you have more processors:
        services.AddApplicationInsightsTelemetryProcessor<MySecondCustomTelemetryProcessor>();
    }
示例筛选器
综合请求
筛选掉机器人和 Web 测试。 尽管指标资源管理器提供了排除合成来源的选项,但此选项通过在 SDK 本身进行筛选来减少流量和数据摄入量。
public void Process(ITelemetry item)
{
    if (!string.IsNullOrEmpty(item.Context.Operation.SyntheticSource)) {return;}

    // Send everything else:
    this.Next.Process(item);
}
身份验证失败
筛除返回“401”响应的请求。
public void Process(ITelemetry item)
{
    var request = item as RequestTelemetry;

    if (request != null &&
    request.ResponseCode.Equals("401", StringComparison.OrdinalIgnoreCase))
    {
        // To filter out an item, return without calling the next processor.
        return;
    }

    // Send everything else
    this.Next.Process(item);
}
筛选掉快速远程依赖项调用
如果只想诊断速度缓慢的调用,请筛选掉快速调用。
注释
此筛选使门户中看到的统计信息偏斜。
public void Process(ITelemetry item)
{
    var request = item as DependencyTelemetry;

    if (request != null && request.Duration.TotalMilliseconds < 100)
    {
        return;
    }
    this.Next.Process(item);
}
采样
若要了解如何为 ASP.NET 和 ASP.NET Core应用程序配置采样,请参阅 application Insights 中的 Sampling。
辅助角色服务
适用于工作服务的 Application Insights SDK 支持 固定速率采样 和 自适应采样。 默认启用自适应采样。 可以使用 EnableAdaptiveSampling 中的选项禁用采样。
若要配置其他采样设置,可以使用以下示例:
using Microsoft.ApplicationInsights.AspNetCore.Extensions;
using Microsoft.ApplicationInsights.Extensibility;

var builder = WebApplication.CreateBuilder(args);

builder.Services.Configure<TelemetryConfiguration>(telemetryConfiguration =>
{
   var telemetryProcessorChainBuilder = telemetryConfiguration.DefaultTelemetrySink.TelemetryProcessorChainBuilder;

   // Using adaptive sampling
   telemetryProcessorChainBuilder.UseAdaptiveSampling(maxTelemetryItemsPerSecond: 5);

   // Alternately, the following configures adaptive sampling with 5 items per second, and also excludes DependencyTelemetry from being subject to sampling:
   // telemetryProcessorChainBuilder.UseAdaptiveSampling(maxTelemetryItemsPerSecond:5, excludedTypes: "Dependency");
});

builder.Services.AddApplicationInsightsTelemetryWorkerService(new ApplicationInsightsServiceOptions
{
   EnableAdaptiveSampling = false,
});

var app = builder.Build();
通过 HTTP 扩充数据
ASP.NET
var requestTelemetry = HttpContext.Current?.Items["Microsoft.ApplicationInsights.RequestTelemetry"] as RequestTelemetry;

if (requestTelemetry != null)
{
    requestTelemetry.Properties["myProp"] = "someData";
}
ASP.NET Core
HttpContext.Features.Get<RequestTelemetry>().Properties["myProp"] = someData
SDK 配置
本部分内容
可以自定义 Application Insights SDK for ASP.NET、ASP.NET Core 和辅助角色服务以更改默认配置。
ASP.NET
Application Insights .NET SDK 包含许多 NuGet 包。 核心包提供 API,用于将遥测数据发送到 Application Insights。 其他包提供遥测模块和初始值设定项,用于自动从应用程序及其上下文跟踪遥测。 可以通过调整配置文件来启用或禁用遥测模块和初始值设定项。 对于其中的一些,你还可以设置参数。
配置文件名称是 ApplicationInsights.config 或 ApplicationInsights.xml。 该名称取决于应用程序的类型。
安装大多数版本的 SDK 时,系统会自动将配置文件添加到项目。
默认情况下,使用支持 add>Application Insights Telemetry 的Visual Studio模板项目中的自动化体验时,将在项目根文件夹中创建 ApplicationInsights.config 文件。 编译后,它会复制到 bin 文件夹。 它也会由 IIS 服务器上的 Application Insights 代理添加到 Web 应用。
没有一个等效的文件用来控制网页中的 SDK。
ASP.NET Core
在 ASP.NET Core应用程序中,除非另有指示,否则所有配置更改都是在 ConfigureServices() 类的 方法中进行的。
注释
在 ASP.NET Core应用程序中,不支持通过修改 TelemetryConfiguration.Active 来更改配置。
辅助角色服务
辅助角色服务 SDK 使用的默认TelemetryConfiguration与 ASP.NET 或 ASP.NET Core 应用程序中使用的自动配置相似,但不包括用于从 HttpContext 丰富遥测数据的遥测初始化程序。
可以自定义用于 Worker Service 的 Application Insights SDK 以更改默认配置。 Application Insights ASP.NET Core SDK 的用户可能熟悉使用 ASP.NET Core 内置的 依赖注入更改配置。 工作服务 SDK 同样基于类似的原则。 在ConfigureServices()部分中,通过调用IServiceCollection的相应方法来进行几乎所有的配置更改,如下一节中详述。
注释
使用 Worker Service SDK 时,不支持通过修改 TelemetryConfiguration.Active 进行配置更改,且更改不会生效。
遥测通道
遥测通道是 Application Insights SDK 不可或缺的组成部分。 它们负责管理发往 Application Insights 服务的遥测数据的缓冲和传输。 SDK 的 .NET 和 .NET 核心版本具有两个内置遥测通道:InMemoryChannel 和 ServerTelemetryChannel。 本部分介绍每个通道,并演示如何自定义通道行为。
注释
若要查看常见问题解答 (FAQ),请参阅遥测通道常见问题解答
什么是遥测通道?
遥测通道负责缓冲遥测项,并将其发送到 Application Insights 服务,系统会在其中存储这些数据,以供查询和分析。 遥测通道是实现 Microsoft.ApplicationInsights.ITelemetryChannel 接口的任何类。
在调用所有遥测初始化程序和遥测处理器之后,将调用遥测通道的 Send(ITelemetry item) 方法。 因此,遥测处理器删除的项都不会进入通道。 一般情况下,Send() 方法不会立即将项发送到后端。 它通常将这些项缓冲在内存中并分批发送,以提高传输效率。
除非必须立即发送缓冲的遥测数据,否则请勿调用 Flush()。 仅在以下场景中使用它:应用程序关闭、异常处理,或者在使用短生命周期的进程(例如后台任务或命令行工具)时。 在 Web 应用程序或长时间运行的服务中,SDK 会自动处理遥测数据发送。 在非必要的情况下调用 Flush() 可能会导致性能问题。
实时指标流还有一个自定义通道,可支持遥测实时流式传输。 此通道与常规遥测通道是相互独立的,本文件不适用于此通道。
内置遥测通道
Application Insights .NET 和 .NET 核心 SDK 附带两个内置通道:
InMemoryChannel:一个轻型通道,它在内存中将项目缓冲到发送为止。 项目会缓存在内存中,每 30 秒刷新一次,或在缓存满 500 个项目时刷新。 此通道只提供最低限度的可靠性保证,因为它在发送遥测数据失败后不会进行重试。 此通道也不会将项保留在磁盘上。 因此,无论应用程序关闭是否正常,任何未发送的项都将永久丢失。 此通道实现了
Flush()方法,可用于同步强制刷新任何内存中的遥测项目。 此通道非常适合短时运行的应用程序,在这种情况下同步刷新是理想的选择。此通道是更大的 Microsoft.ApplicationInsights NuGet 包的一部分,并且是在未作其他配置时 SDK 默认使用的通道。
ServerTelemetryChannel:这是一个更高级的通道,它具有重试策略,并能够将数据存储到本地磁盘。 如果出现暂时性错误,该通道会重新尝试发送遥测数据。 在网络中断或者遥测量较高时,此通道还会使用本地磁盘存储将项保留在磁盘上。 由于这些重试机制和本地磁盘存储,我们认为此通道更可靠。 建议将其用于所有生产方案。 此通道是根据官方文档配置的 ASP.NET 和 ASP.NET Core应用程序的默认通道。 此通道专为具有长时间运行进程的服务器环境进行了优化。 此通道实现的
Flush()方法不是同步的。此通道作为 Microsoft.ApplicationInsights.WindowsServer.TelemetryChannel NuGet 包交付,使用 Microsoft.ApplicationInsights.Web 或 Microsoft.ApplicationInsights.AspNetCore NuGet 包时可自动获取它。
配置遥测通道
你可以对遥测通道进行配置,将其设置为活动的遥测配置。 对于 ASP.NET 应用程序,配置涉及将遥测通道实例设置为 TelemetryConfiguration.Active 或通过修改 ApplicationInsights.config。 对于 ASP.NET Core应用程序,配置涉及将通道添加到依赖项注入容器。
以下部分展示了针对不同应用程序类型配置 StorageFolder 设置的示例。
StorageFolder 只是可配置设置之一。 有关配置设置的完整列表,请参阅本文后面的通道中的可配置设置部分。
ASP.NET
选项 1:代码中的配置
以下代码设置一个 ServerTelemetryChannel 实例,其中 StorageFolder 设置为自定义位置。 请将此代码添加到应用程序的开头,通常是添加到 Global.aspx.cs 中的 Application_Start() 方法内。
using Microsoft.ApplicationInsights.Extensibility;
using Microsoft.ApplicationInsights.WindowsServer.TelemetryChannel;
protected void Application_Start()
{
    var serverTelemetryChannel = new ServerTelemetryChannel();
serverTelemetryChannel.StorageFolder = @"d:\temp\applicationinsights";
    serverTelemetryChannel.Initialize(TelemetryConfiguration.Active);
    TelemetryConfiguration.Active.TelemetryChannel = serverTelemetryChannel;
}
选项 2:ApplicationInsights.config 中的配置
ApplicationInsights.config 中的以下部分展示了 ServerTelemetryChannel 通道的配置情况,其中 StorageFolder 被设置为一个自定义位置:
    <TelemetrySinks>
        <Add Name="default">
            <TelemetryProcessors>
                <!-- Telemetry processors omitted for brevity -->
            </TelemetryProcessors>
            <TelemetryChannel Type="Microsoft.ApplicationInsights.WindowsServer.TelemetryChannel.ServerTelemetryChannel, Microsoft.AI.ServerTelemetryChannel">
                <StorageFolder>d:\temp\applicationinsights</StorageFolder>
            </TelemetryChannel>
        </Add>
    </TelemetrySinks>
ASP.NET Core
修改 ConfigureServices 类的 Startup.cs 方法,如下所示:
using Microsoft.ApplicationInsights.Channel;
using Microsoft.ApplicationInsights.WindowsServer.TelemetryChannel;

public void ConfigureServices(IServiceCollection services)
{
    // This sets up ServerTelemetryChannel with StorageFolder set to a custom location.
    services.AddSingleton(typeof(ITelemetryChannel), new ServerTelemetryChannel() {StorageFolder = @"d:\temp\applicationinsights" });

    services.AddApplicationInsightsTelemetry();
}
重要
ASP.NET Core 应用程序不支持使用 TelemetryConfiguration.Active 配置通道。
重写 ServerTelemetryChannel
默认遥测通道为 ServerTelemetryChannel。 下面的示例演示如何对其进行替代。
using Microsoft.ApplicationInsights.Channel;

var builder = WebApplication.CreateBuilder(args);

// Use the following to replace the default channel with InMemoryChannel.
// This can also be applied to ServerTelemetryChannel.
builder.Services.AddSingleton(typeof(ITelemetryChannel), new InMemoryChannel() {MaxTelemetryBufferCapacity = 19898 });

builder.Services.AddApplicationInsightsTelemetry();

var app = builder.Build();
注释
如果要刷新缓冲区,请参阅刷新数据。 例如,如果在关闭的应用程序中使用 SDK,可能需要刷新缓冲区。
辅助角色服务
默认通道为 ServerTelemetryChannel. 可以重写它,如以下示例所示:
using Microsoft.ApplicationInsights.Channel;

    public void ConfigureServices(IServiceCollection services)
    {
        // Use the following to replace the default channel with InMemoryChannel.
        // This can also be applied to ServerTelemetryChannel.
        services.AddSingleton(typeof(ITelemetryChannel), new InMemoryChannel() {MaxTelemetryBufferCapacity = 19898 });

        services.AddApplicationInsightsTelemetryWorkerService();
    }
代码中针对控制台应用程序的配置
对于控制台应用,.NET和 .NET Core 的代码相同:
var serverTelemetryChannel = new ServerTelemetryChannel();
serverTelemetryChannel.StorageFolder = @"d:\temp\applicationinsights";
serverTelemetryChannel.Initialize(TelemetryConfiguration.Active);
TelemetryConfiguration.Active.TelemetryChannel = serverTelemetryChannel;
ServerTelemetryChannel 的操作详细信息
ServerTelemetryChannel 会将传入的项保存到内存缓冲区中。 这些项目会被序列化、压缩,并存储到一个 Transmission 实例中,每 30 秒执行一次,或者当缓冲数量达到 500 个项目时立即执行。 单个 Transmission 实例最多包含 500 个项目,表示通过对 Application Insights 服务的单个 HTTPS 调用发送的一批遥测数据。
默认情况下,最多可以并行发送 10 Transmission 个实例。 如果遥测数据以更快的速度到达,或者网络或 Application Insights 后端响应较慢,则 Transmission 实例会被存储在内存中。 此内存 Transmission 缓冲区的默认容量为 5 MB。 超过内存中容量后,Transmission 实例将存储在本地磁盘上,最大限制为 50 MB。
当存在网络问题时,Transmission 实例也会存储在本地磁盘上。 只有存储在本地磁盘上的项目才能在应用程序崩溃后保留下来。 每当应用程序再次启动时,系统就会发送这些项目。 如果网络问题仍然存在,则 ServerTelemetryChannel 在重试发送遥测数据之前,将使用指数退避逻辑,范围从 10 秒到 1 小时。
通道中的可配置设置
有关每个通道的可配置设置的完整列表,请参阅:
- InMemoryChannel
- ServerTelemetryChannel
以下是 ServerTelemetryChannel 最常用的设置:
MaxTransmissionBufferCapacity:通道用于缓冲内存中的传输的最大内存量(以字节为单位)。 达到此容量后,新项目将直接存储到本地磁盘。 默认值为 5 MB。 设置较高的值会导致磁盘使用率降低,但请记住,如果应用程序崩溃,内存中的项目会丢失。MaxTransmissionSenderCapacity:同时发送到 Application Insights 的Transmission实例的最大数量。 默认值为 10。 可将此设置配置为更大的数字,生成巨量的遥测数据时建议这样做。 执行负载测试或关闭采样时,往往会出现大量的遥测数据。StorageFolder:磁盘上的文件夹,通道根据需要将项存储到其中。 在Windows中,如果未显式指定其他路径,则使用 %LOCALAPPDATA% 或 %TEMP%。 在除Windows以外的环境中,默认使用以下位置(按顺序):%TMPDIR%、/var/tmp/ 或 /tmp/。
应使用哪个通道?
对于涉及到长时间运行的应用程序的大多数生产方案,建议使用 ServerTelemetryChannel。 有关刷新遥测的详细信息,请了解如何使用 Flush()。
何时使用 Flush()
Flush() 方法会立即发送任何缓冲的遥测数据。 但是,它只应在特定方案中使用。
在以下情况下使用 Flush():
- 应用程序即将关闭,并且你想要确保在退出之前发送遥测数据。
- 你位于异常处理程序中,需要保证遥测数据已送达。
- 你要编写一个短暂的进程,例如快速退出的后台作业或 CLI 工具。
避免在长时间运行的应用程序(如 Web 服务)中使用 Flush()。 SDK 会自动管理缓冲和传输。 在非必要的情况下调用 Flush() 可能会导致性能问题,并且不能保证发送所有数据,尤其是在使用 ServerTelemetryChannel 时,因为它不会同步刷新。
遥测模块
Application Insights 自动收集有关特定工作负荷的遥测数据,无需用户手动跟踪。
默认情况下,启用以下自动收集模块。 可以禁用或配置这些模块,以改变其默认行为。
ASP.NET
每个遥测模块收集特定类型的数据,并使用核心 API 来发送数据。 不同的 NuGet 包会安装这些模块,同时在 .config 文件中添加所需的行。
| Area | Description |
|---|---|
| 请求跟踪 | 收集传入 Web 请求的请求遥测数据(响应时间、结果代码)。 模块: Microsoft.ApplicationInsights.Web.RequestTrackingTelemetryModuleNuGet:Microsoft.ApplicationInsights.Web |
| 依赖关系跟踪 | 收集有关传出依赖项(HTTP 调用、SQL 调用)的遥测数据。 若要在 IIS 中运行,请安装 Application Insights 代理。 还可以使用 TrackDependency API 编写自定义依赖项跟踪。 支持对应用服务和VM 和虚拟机规模集进行自动化检测。 模块: Microsoft.ApplicationInsights.DependencyCollector.DependencyTrackingTelemetryModuleNuGet:Microsoft.ApplicationInsights.DependencyCollector |
| 性能计数器 | 从 IIS 安装收集Windows性能计数器(CPU、内存、网络负载)。 指定哪些计数器(包括自定义的计数器)。 有关详细信息,请参阅收集系统性能计数器。 模块: Microsoft.ApplicationInsights.Extensibility.PerfCounterCollector.PerformanceCollectorModuleNuGet:Microsoft.ApplicationInsights.PerfCounterCollector |
| 事件计数器 | 收集 .NET EventCounters。 建议用于 ASP.NET Core 和跨平台替代 Windows 性能计数器。 模块: (SDK ≥ 2.8.0) EventCounterCollectionModule |
| 实时指标 (QuickPulse) | 收集实时指标窗格的遥测数据。 模块: QuickPulseTelemetryModule |
| 检测信号(应用服务) | 发送应用服务环境的检测信号和自定义指标。 模块: AppServicesHeartbeatTelemetryModule |
| 心跳(VM 和虚拟机规模集) | 传送心跳信号和自定义指标用于 Azure 虚拟机环境。 模块: AzureInstanceMetadataTelemetryModule |
| 诊断遥测数据 | 报告 Application Insights 检测代码中的错误(例如缺少计数器、ITelemetryInitializer 异常)。 跟踪遥测数据会显示在诊断搜索中。模块: Microsoft.ApplicationInsights.Extensibility.Implementation.Tracing.DiagnosticsTelemetryModuleNuGet:Microsoft.ApplicationInsights 请注意:如果只安装此包,则不会自动创建 ApplicationInsights.config 文件。 |
| 开发人员模式(附加了调试程序) | 当连接了调试程序时,强制 TelemetryChannel 立即发送项目。 降低延迟,但会增加 CPU/网络开销。模块: Microsoft.ApplicationInsights.WindowsServer.DeveloperModeWithDebuggerAttachedTelemetryModuleNuGet:Application Insights Windows Server |
| 异常跟踪 (Web) | 跟踪 Web 应用中未经处理的异常。 请参阅故障和异常。 模块: Microsoft.ApplicationInsights.Web.ExceptionTrackingTelemetryModuleNuGet:Microsoft.ApplicationInsights.Web |
| 异常跟踪(未观察/未处理) | 跟踪辅助角色、Windows 服务和控制台应用中的未观察到的任务异常和未经处理的异常。 模块: • Microsoft.ApplicationInsights.WindowsServer.UnobservedExceptionTelemetryModule• Microsoft.ApplicationInsights.WindowsServer.UnhandledExceptionTelemetryModuleNuGet:Microsoft.ApplicationInsights.WindowsServer |
| EventSource 跟踪 | 将配置的 EventSource 事件作为跟踪发送到 Application Insights。 模块: Microsoft.ApplicationInsights.EventSourceListener.EventSourceTelemetryModuleNuGet:Microsoft.ApplicationInsights.EventSourceListener |
| ETW 收集器 | 将配置的 ETW 提供程序事件作为跟踪发送到 Application Insights。 模块: Microsoft.ApplicationInsights.EtwCollector.EtwCollectorTelemetryModuleNuGet:Microsoft.ApplicationInsights.EtwCollector |
| 核心 API(不是模块) |
其他遥测组件和自定义遥测使用的核心 API。 模块: Microsoft.ApplicationInsights packageNuGet:Microsoft.ApplicationInsights 请注意:如果只安装此包,则不会自动创建 ApplicationInsights.config 文件。 |
ASP.NET Core
| Area | Description |
|---|---|
| 请求跟踪 | 通过 ASP.NET Core Application Insights 集成,实现内置的请求跟踪功能。 模块:没有单独的模块类。 NuGet:Microsoft.ApplicationInsights.AspNetCore |
| 依赖关系跟踪 | 通过依赖项收集器。 NuGet:Microsoft.ApplicationInsights.DependencyCollector |
| 性能计数器 | 仅限Windows! 跨平台时,请使用 EventCounterCollectionModule(请参阅下一行)。NuGet:Microsoft.ApplicationInsights.PerfCounterCollector |
| 事件计数器 | 收集 .NET EventCounters。 建议用于 ASP.NET Core 和跨平台替代 Windows 性能计数器。 模块:(SDK 2.8.0 及更高版本) EventCounterCollectionModuleNuGet:Microsoft.ApplicationInsights.EventCounterCollector |
| 实时指标 (QuickPulse) | ASP.NET Core Application Insights 集成中启用了实时指标。 模块:没有单独的模块类。 NuGet:Microsoft.ApplicationInsights.AspNetCore |
| 检测信号收集器(应用服务) | 发送检测信号(作为自定义指标),其中包含有关应用服务环境的详细信息。 在应用服务中托管时,通过基本 SDK 内置。 模块:没有单独的模块类。 NuGet:Microsoft.ApplicationInsights.AspNetCore |
| 检测信号收集器(VM 和虚拟机规模集) | 发送包含有关 Azure VM 环境详细信息的心跳信号(作为自定义指标)。 在Azure VM 和Azure虚拟机规模集上托管时,通过基本 SDK 内置。 模块:没有单独的模块类。 NuGet:Microsoft.ApplicationInsights.AspNetCore |
| 诊断遥测数据 | 报告 Application Insights 检测代码本身中的错误(例如,无法访问性能计数器,ITelemetryInitializer 引发异常)。 跟踪遥测数据会显示在诊断搜索中。模块: Microsoft.ApplicationInsights.Extensibility.Implementation.Tracing.DiagnosticsTelemetryModuleNuGet:Microsoft.ApplicationInsights |
| 开发人员模式(附加了调试程序) | 相同的行为可用;类是Windows Server包的一部分。 模块: Microsoft.ApplicationInsights.WindowsServer.DeveloperModeWithDebuggerAttachedTelemetryModuleNuGet:Microsoft.ApplicationInsights.WindowsServer |
| 异常跟踪 (Web) | ASP.NET Core Application Insights 集成中的自动异常跟踪 模块:没有单独的模块类。 NuGet:Microsoft.ApplicationInsights.AspNetCore |
| 异常跟踪(未观察/未处理) | 通过 ASP.NET Core 运行时/集成实现类似的行为;类名称特定于 Windows Server。 NuGet:Microsoft.ApplicationInsights.WindowsServer |
| EventSource 跟踪 | 将配置的 EventSource 事件作为跟踪发送到 Application Insights。 模块: Microsoft.ApplicationInsights.EventSourceListener.EventSourceTelemetryModuleNuGet:Microsoft.ApplicationInsights.EventSourceListener |
| ETW 收集器 | 仅限Windows(ETW)。 将配置的 ETW 提供程序事件作为跟踪发送到 Application Insights。 模块: Microsoft.ApplicationInsights.EtwCollector.EtwCollectorTelemetryModuleNuGet:Microsoft.ApplicationInsights.EtwCollector |
| 核心 API(不是模块) |
其他遥测组件和自定义遥测使用的核心 API。 模块: Microsoft.ApplicationInsights packageNuGet:Microsoft.ApplicationInsights |
配置遥测模块
ASP.NET
使用 ApplicationInsights.configTelemetryModules 中的 部分来配置、添加或删除模块。 示例如下:
- 配置
DependencyTrackingTelemetryModule(启用 W3C 标头注入)。 - 配置
EventCounterCollectionModule(清除默认值并添加单个计数器)。 - 通过删除
PerformanceCollectorModule禁用 perf-counter 集合。
<ApplicationInsights>
  <TelemetryModules>

    <!-- Dependency tracking -->
    <Add Type="Microsoft.ApplicationInsights.DependencyCollector.DependencyTrackingTelemetryModule, Microsoft.AI.DependencyCollector">
      <!-- Match Core example: enable W3C header injection -->
      <EnableW3CHeadersInjection>true</EnableW3CHeadersInjection>
    </Add>

    <!-- EventCounterCollectionModule: add a single counter (if you use event counters) -->
    <Add Type="Microsoft.ApplicationInsights.Extensibility.PerfCounterCollector.EventCounterCollectionModule, Microsoft.AI.PerfCounterCollector">
      <Counters>
        <!-- Mirrors Core example: only collect 'gen-0-size' from System.Runtime -->
        <Add ProviderName="System.Runtime" CounterName="gen-0-size" />
      </Counters>
    </Add>

    <!-- PerformanceCollectorModule (classic Windows performance counters).
         To DISABLE perf-counter collection, do NOT include this module.
         If it already exists in your file, remove or comment it out.
         Example of the line you would remove:
    <Add Type="Microsoft.ApplicationInsights.Extensibility.PerfCounterCollector.PerformanceCollectorModule, Microsoft.AI.PerfCounterCollector" />
    -->

  </TelemetryModules>
</ApplicationInsights>
注释
ApplicationInsights.config 中存在的确切模块集取决于安装的 SDK 包。
ASP.NET Core
选项 1:使用 ConfigureTelemetryModule 配置遥测模块
若要配置任何默认的 TelemetryModule,请按以下示例所示使用 ConfigureTelemetryModule<T> 中的扩展方法 IServiceCollection:
using Microsoft.ApplicationInsights.DependencyCollector;
using Microsoft.ApplicationInsights.Extensibility.PerfCounterCollector;

var builder = WebApplication.CreateBuilder(args);

builder.Services.AddApplicationInsightsTelemetry();

// The following configures DependencyTrackingTelemetryModule.
// Similarly, any other default modules can be configured.
builder.Services.ConfigureTelemetryModule<DependencyTrackingTelemetryModule>((module, o) =>
        {
            module.EnableW3CHeadersInjection = true;
        });

// The following removes all default counters from EventCounterCollectionModule, and adds a single one.
builder.Services.ConfigureTelemetryModule<EventCounterCollectionModule>((module, o) =>
        {
            module.Counters.Add(new EventCounterCollectionRequest("System.Runtime", "gen-0-size"));
        });

// The following removes PerformanceCollectorModule to disable perf-counter collection.
// Similarly, any other default modules can be removed.
var performanceCounterService = builder.Services.FirstOrDefault<ServiceDescriptor>(t => t.ImplementationType == typeof(PerformanceCollectorModule));
if (performanceCounterService != null)
{
    builder.Services.Remove(performanceCounterService);
}

var app = builder.Build();
选项 2:使用 ApplicationInsightsServiceOptions 配置遥测模块
在 SDK 版本 2.12.2 及更高版本中,可以通过将 ApplicationInsightsServiceOptions 传递给 AddApplicationInsightsTelemetry 来修改一些常用设置,如下例所示:
var builder = WebApplication.CreateBuilder(args);

var aiOptions = new Microsoft.ApplicationInsights.AspNetCore.Extensions.ApplicationInsightsServiceOptions();

// Disables adaptive sampling.
aiOptions.EnableAdaptiveSampling = false;

// Disables live metrics (also known as QuickPulse).
aiOptions.EnableQuickPulseMetricStream = false;

builder.Services.AddApplicationInsightsTelemetry(aiOptions);
var app = builder.Build();
此表包含 ApplicationInsightsServiceOptions 设置的完整列表:
| 设置 | Description | 违约 |
|---|---|---|
| EnablePerformanceCounterCollectionModule | 启用或禁用 PerformanceCounterCollectionModule。 |
True |
| 启用请求跟踪遥测模块 (EnableRequestTrackingTelemetryModule) | 启用或禁用 RequestTrackingTelemetryModule。 |
True |
| 启用事件计数器集合模块 (EnableEventCounterCollectionModule) | 启用或禁用 EventCounterCollectionModule。 |
True |
| 启用依赖追踪遥测模块 | 启用或禁用 DependencyTrackingTelemetryModule。 |
True |
| 启用应用服务心跳遥测模块 | 启用或禁用 AppServicesHeartbeatTelemetryModule。 |
True |
| 启用Azure实例元数据遥测模块 | 启用或禁用 AzureInstanceMetadataTelemetryModule。 |
True |
| EnableQuickPulseMetricStream | 启用/禁用 LiveMetrics 功能。 | True |
| 启用自适应采样 | 启用/禁用自适应采样。 | True |
| EnableHeartbeat | 启用/禁用检测信号功能。 它定期(默认为 15 分钟)发送名为 HeartbeatState 的自定义指标,其中包含有关运行时的信息(如.NET版本和Azure环境信息(如果适用)。 |
True |
| AddAutoCollectedMetricExtractor | 启用/禁用 AutoCollectedMetrics extractor。 此遥测处理器在采样发生之前发送有关请求/依赖项的预聚合指标。 |
True |
| RequestCollectionOptions.TrackExceptions | 启用/禁用请求收集模块的未经处理的异常跟踪报告。 |
netstandard2.0 中为 False(因为使用 ApplicationInsightsLoggerProvider 跟踪异常)。 否则为 true。 |
| 启用诊断遥测模块 | 启用或禁用 DiagnosticsTelemetryModule。 禁用会导致以下设置被忽略:EnableHeartbeat、EnableAzureInstanceMetadataTelemetryModule 和 EnableAppServicesHeartbeatTelemetryModule。 |
True |
有关最新列表,请参阅ApplicationInsightsServiceOptions 中的可配置设置。
针对 Microsoft.ApplicationInsights.AspNetCore SDK 2.15.0 及更高版本的配置建议
在 Microsoft.ApplicationInsights.AspNetCore SDK 2.15.0 及更高版本中,配置 ApplicationInsightsServiceOptions 中提供的每个设置,包括 ConnectionString。 使用应用程序的 IConfiguration 实例。 设置必须位于 ApplicationInsights 节下,如以下示例所示。
appsettings.json 中以下部分配置了连接字符串,并禁用了自适应采样和性能计数器的收集。
{
    "ApplicationInsights": {
    "ConnectionString": "<YOUR-CONNECTION-STRING>",
    "EnableAdaptiveSampling": false,
    "EnablePerformanceCounterCollectionModule": false
    }
}
如果使用 ASP.NET Core 6.0 的 builder.Services.AddApplicationInsightsTelemetry(aiOptions) 或 ASP.NET Core 3.1 及更早版本的 services.AddApplicationInsightsTelemetry(aiOptions),则会覆盖 Microsoft.Extensions.Configuration.IConfiguration 中的设置。
辅助角色服务
选项 1:使用 ConfigureTelemetryModule 配置遥测模块
Application Insights 使用遥测模块自动收集有关特定工作负荷的遥测数据,而无需手动跟踪。
默认情况下,以下自动收集模块处于启用状态。 这些模块负责自动收集遥测数据。 可以禁用或配置这些模块,以改变其默认行为。
DependencyTrackingTelemetryModulePerformanceCollectorModuleQuickPulseTelemetryModule-
AppServicesHeartbeatTelemetryModule(当前存在涉及此遥测模块的问题)。有关临时解决方法,请参阅 GitHub 问题 1689。 AzureInstanceMetadataTelemetryModule
若要配置任何默认遥测模块,请在ConfigureTelemetryModule上使用扩展IServiceCollection方法,如以下示例所示:
    using Microsoft.ApplicationInsights.Extensibility.PerfCounterCollector.QuickPulse;
    using Microsoft.ApplicationInsights.Extensibility.PerfCounterCollector;

    public void ConfigureServices(IServiceCollection services)
    {
        services.AddApplicationInsightsTelemetryWorkerService();

            // The following configures QuickPulseTelemetryModule.
            // Similarly, any other default modules can be configured.
            services.ConfigureTelemetryModule<QuickPulseTelemetryModule>((module, o) =>
            {
                module.AuthenticationApiKey = "<YOUR-API-KEY-HERE>";
            });

            // The following removes PerformanceCollectorModule to disable perf-counter collection.
            // Similarly, any other default modules can be removed.
            var performanceCounterService = services.FirstOrDefault<ServiceDescriptor>
                                        (t => t.ImplementationType == typeof(PerformanceCollectorModule));
            if (performanceCounterService != null)
            {
                services.Remove(performanceCounterService);
            }
    }
选项 2:使用 ApplicationInsightsServiceOptions 配置遥测模块
可以通过向 ApplicationInsightsServiceOptions 传递 AddApplicationInsightsTelemetryWorkerService 来修改一些通用设置,如以下示例所示:
using Microsoft.ApplicationInsights.WorkerService;

public void ConfigureServices(IServiceCollection services)
{
    var aiOptions = new ApplicationInsightsServiceOptions();
    // Disables adaptive sampling.
    aiOptions.EnableAdaptiveSampling = false;

    // Disables live metrics (also known as QuickPulse).
    aiOptions.EnableQuickPulseMetricStream = false;
    services.AddApplicationInsightsTelemetryWorkerService(aiOptions);
}
此 SDK 中的 ApplicationInsightsServiceOptions 位于命名空间 Microsoft.ApplicationInsights.WorkerService中,而不是 ASP.NET Core SDK 中的 Microsoft.ApplicationInsights.AspNetCore.Extensions。
下表列出了在ApplicationInsightsServiceOptions中常用的设置。
| 设置 | Description | 违约 |
|---|---|---|
| EnableQuickPulseMetricStream | 启用/禁用实时指标功能。 | True |
| 启用自适应采样 | 启用/禁用自适应采样。 | True |
| EnableHeartbeat | 启用/禁用 Heartbeats 功能,该功能定期(默认值为每 15 分钟)发送名为“HeartBeatState”的自定义指标,其中包含有关运行时环境(如 .NET 版本和 Azure 环境)的信息(如果适用)。 | True |
| AddAutoCollectedMetricExtractor | 启用/禁用 AutoCollectedMetrics 提取程序,该提取器是遥测处理器,在采样发生之前发送有关 Requests/Dependencies 的预聚合指标。 | True |
| 启用诊断遥测模块 | 启用或禁用 DiagnosticsTelemetryModule。 禁用此设置会导致忽略以下设置: EnableHeartbeat、 EnableAzureInstanceMetadataTelemetryModule和 EnableAppServicesHeartbeatTelemetryModule。 |
True |
有关最新列表,请参阅中的ApplicationInsightsServiceOptions可配置设置。
禁用遥测
ASP.NET
在配置文件中,每个模块都有一个对应的节点。 要禁用某个模块,请删除该节点或将其注释掉。
ASP.NET Core
如果要有条件和动态地禁用遥测,可以在代码中的任何位置使用 ASP.NET Core依赖项注入容器解析 TelemetryConfiguration 实例,并在其中设置 DisableTelemetry 标志。
var builder = WebApplication.CreateBuilder(args);

builder.Services.AddApplicationInsightsTelemetry();

// any custom configuration can be done here:
builder.Services.Configure<TelemetryConfiguration>(x => x.DisableTelemetry = true);

var app = builder.Build();
前面的代码示例阻止将遥测数据发送到 Application Insights。 它不会阻止任何自动收集模块收集遥测数据。 如果要删除特定的自动收集模块,请参阅遥测模块。
辅助角色服务
如果要有条件和动态地禁用遥测,可以在代码中的任何位置使用 ASP.NET Core依赖项注入容器解析 TelemetryConfiguration 实例,并在其中设置 DisableTelemetry 标志。
    public void ConfigureServices(IServiceCollection services)
    {
        services.AddApplicationInsightsTelemetryWorkerService();
    }

    public void Configure(IApplicationBuilder app, IHostingEnvironment env, TelemetryConfiguration configuration)
    {
        configuration.DisableTelemetry = true;
        ...
    }
连接字符串
此设置确定显示数据的 Application Insights 资源。 通常,您会为每个应用程序创建一个单独的资源,并为其配备一个独立的“连接字符串”。
有关代码示例,请参阅 Application Insights 中的连接字符串。
例如,如果要动态设置connection string,若要将应用程序的结果发送到不同的资源,可以从配置文件中省略connection string,并改为在代码中设置它。
ASP.NET
若要为所有 TelemetryClient 实例(包括标准遥测模块)设置connection string,请在初始化方法中执行此步骤,例如 ASP.NET 服务中的global.aspx.cs:
using Microsoft.ApplicationInsights.Extensibility;
using Microsoft.ApplicationInsights;

    protected void Application_Start()
    {
        TelemetryConfiguration configuration = TelemetryConfiguration.CreateDefault();
        configuration.ConnectionString = "<YOUR-CONNECTION-STRING>";
        var telemetryClient = new TelemetryClient(configuration);
如果要将特定的一组事件发送到不同的资源,可以针对特定的遥测客户端设置密钥:
    var tc = new TelemetryClient();
    tc.Context.ConnectionString = "<YOUR-CONNECTION-STRING>";
    tc.TrackEvent("myEvent");
    // ...
若要获取新的connection string,在 Application Insights 门户中创建一个新资源。
ASP.NET Core
在 ASP.NET Core 中,使用依赖项注入 (DI) 容器中的 Program.cs 在应用程序启动时配置 TelemetryConfiguration 中的连接字符串。
using Microsoft.ApplicationInsights.Extensibility;
using Microsoft.ApplicationInsights;

var builder = WebApplication.CreateBuilder(args);

// Add Application Insights
builder.Services.AddApplicationInsightsTelemetry();

var app = builder.Build();

// Resolve TelemetryConfiguration from DI and set the connection string
var config = app.Services.GetRequiredService<TelemetryConfiguration>();
config.ConnectionString = "<YOUR-CONNECTION-STRING>";

app.Run();
如果要将特定事件集发送到其他资源,可以创建新的 TelemetryClient 实例并显式设置其connection string:
using Microsoft.ApplicationInsights;

var tc = new TelemetryClient();
tc.Context.ConnectionString = "<YOUR-CONNECTION-STRING>";
tc.TrackEvent("myEvent");
// ...
ApplicationId 提供程序
注释
对于 ASP.NET,此提供程序从 SDK v2.6.0*开始提供。
此提供者的目的是根据连接字符串查找应用程序 ID。 应用程序 ID 包含在 RequestTelemetry 和 DependencyTelemetry 中,用于在门户中确定关联。
此功能可通过设置 TelemetryConfiguration.ApplicationIdProvider 实现。
接口:IApplicationIdProvider
public interface IApplicationIdProvider
{
    bool TryGetApplicationId(string connectionString, out string applicationId);
}
我们在 Microsoft.ApplicationInsights SDK 中提供了两个实现:ApplicationInsightsApplicationIdProvider 和 DictionaryApplicationIdProvider。
ApplicationInsightsApplicationIdProvider
这是用于我们的配置文件 API 的包装器。 它会限制请求和缓存结果。 安装 Microsoft.ApplicationInsights.DependencyCollector 或 Microsoft.ApplicationInsights.Web 时,会自动包含此提供程序。
该类公开了名为 ProfileQueryEndpoint 的可选属性。 默认情况下它设置为 https://dc.services.visualstudio.com/api/profiles/{0}/appId。
如果需要配置代理,建议对基址进行代理,并确保路径包括 /api/profiles/{0}/appId。 在运行时,{0} 会被替换为每个请求的连接字符串。
ASP.NET
通过 ApplicationInsights.config 实现的示例配置
<ApplicationInsights>
    ...
    <ApplicationIdProvider Type="Microsoft.ApplicationInsights.Extensibility.Implementation.ApplicationId.ApplicationInsightsApplicationIdProvider, Microsoft.ApplicationInsights">
        <ProfileQueryEndpoint>https://dc.services.visualstudio.com/api/profiles/{0}/appId</ProfileQueryEndpoint>
    </ApplicationIdProvider>
    ...
</ApplicationInsights>
通过代码实现的示例配置
TelemetryConfiguration.Active.ApplicationIdProvider = new ApplicationInsightsApplicationIdProvider();
ASP.NET Core
注释
在 ASP.NET Core 中,没有 ApplicationInsights.config 文件。 配置是通过 Program.cs 或 Startup.cs 中的依赖项注入 (DI) 完成的。
可以替代默认提供程序或自定义其 ProfileQueryEndpoint。
using Microsoft.ApplicationInsights.Extensibility.Implementation.ApplicationId;

var builder = WebApplication.CreateBuilder(args);

// Add Application Insights
builder.Services.AddApplicationInsightsTelemetry();

// Replace default provider with custom configuration
builder.Services.AddSingleton<IApplicationIdProvider>(sp =>
    new ApplicationInsightsApplicationIdProvider
    {
        ProfileQueryEndpoint = "https://custom-proxy/api/profiles/{0}/appId"
    });

var app = builder.Build();
app.Run();
DictionaryApplicationIdProvider
此静态提供程序依赖于您配置的连接字符串/应用程序 ID 对。
此类具有 Defined 属性,该属性是一组连接字符串/应用程序 ID 对的 Dictionary<string,string>。
此类具有可选属性Next,该属性可用于配置另一个提供程序,用于在请求的连接字符串在您的配置中不存在时使用。
ASP.NET
通过 ApplicationInsights.config 实现的示例配置
<ApplicationInsights>
    ...
    <ApplicationIdProvider Type="Microsoft.ApplicationInsights.Extensibility.Implementation.ApplicationId.DictionaryApplicationIdProvider, Microsoft.ApplicationInsights">
        <Defined>
            <Type key="ConnectionString_1" value="ApplicationId_1"/>
            <Type key="ConnectionString_2" value="ApplicationId_2"/>
        </Defined>
        <Next Type="Microsoft.ApplicationInsights.Extensibility.Implementation.ApplicationId.ApplicationInsightsApplicationIdProvider, Microsoft.ApplicationInsights" />
    </ApplicationIdProvider>
    ...
</ApplicationInsights>
通过代码实现的示例配置
TelemetryConfiguration.Active.ApplicationIdProvider = new DictionaryApplicationIdProvider{
 Defined = new Dictionary<string, string>
    {
        {"ConnectionString_1", "ApplicationId_1"},
        {"ConnectionString_2", "ApplicationId_2"}
    }
};
ASP.NET Core
using Microsoft.ApplicationInsights.Extensibility.Implementation.ApplicationId;

var builder = WebApplication.CreateBuilder(args);

builder.Services.AddApplicationInsightsTelemetry();

// Register DictionaryApplicationIdProvider
builder.Services.AddSingleton<IApplicationIdProvider>(sp =>
    new DictionaryApplicationIdProvider
    {
        Defined = new Dictionary<string, string>
        {
            { "ConnectionString_1", "ApplicationId_1" },
            { "ConnectionString_2", "ApplicationId_2" }
        },
        Next = new ApplicationInsightsApplicationIdProvider() // optional fallback
    });

var app = builder.Build();
app.Run();
添加客户端监控
前面几个部分提供了有关自动和手动配置服务器端监视的方法的指导。 若要添加客户端监视,请使用客户端 JavaScript SDK。 可以通过在页面 HTML 的结尾 标记之前添加 </head>来监视任何网页的客户端事务。
尽管可以手动将 JavaScript (Web) SDK 加载程序脚本添加到每个 HTML 页的标头,但建议改为将 JavaScript (Web) SDK 加载程序脚本添加到主页面。 该操作会将 JavaScript (Web) SDK 加载程序脚本注入站点的所有页面。
ASP.NET
对于本文中基于模板的 ASP.NET MVC 应用,需要编辑的文件是 _Layout.cshtml。 可以在视图>共享下找到。 若要添加客户端监视,请打开 _Layout.cshtml,然后按照关于客户端 JavaScript SDK 配置的文章中的基于 JavaScript (Web) SDK 加载程序脚本的设置说明进行操作。
ASP.NET Core
如果应用程序具有客户端组件,请按照后续步骤开始使用 JavaScript (Web) SDK 加载程序脚本注入通过配置来收集用量遥测数据。
在 _ViewImports.cshtml 中,添加注入:
@inject Microsoft.ApplicationInsights.AspNetCore.JavaScriptSnippet JavaScriptSnippet在 _Layout.cshtml 中,将
HtmlHelper插入到<head>节的末尾、任何其他脚本的前面。 若要从页面报告任何自定义 JavaScript 遥测数据,请将其注入到此片段的后面:@Html.Raw(JavaScriptSnippet.FullScript) </head>
作为使用 FullScript 的替代方法,ScriptBody从 application Insights SDK for ASP.NET Core 版本 2.14 开始提供。 如果需要控制 ScriptBody 标记以设置内容安全策略,请使用 <script>:
<script> // apply custom changes to this script tag.
    @Html.Raw(JavaScriptSnippet.ScriptBody)
</script>
前面引用的 .cshtml 文件名取自默认的 MVC 应用程序模板。 从根本上讲,若要为应用程序正确启用客户端监视,JavaScript (Web) SDK 加载程序脚本必须出现在所要监视的应用程序的每个页面的 <head> 部分中。 在应用程序模板中,将 JavaScript (Web) SDK 加载程序脚本添加到 _Layout.cshtml 以启用客户端监视。
如果你的项目不包含 _Layout.cshtml,仍可通过将 JavaScript (Web) SDK 加载程序脚本添加到控制应用内所有页面的 的等效文件来添加<head>。 或者,可将 JavaScript (Web) SDK 加载程序脚本添加到多个页面中,但我们不建议这样做。
注释
JavaScript 注入提供默认配置体验。 如果需要配置超出设置连接字符串,则按照所述移除自动注入,并手动添加 JavaScript SDK。
自定义事件和指标的核心 API
在应用程序中插入几行代码,以了解用户如何使用它,或帮助诊断问题。 可以从设备和桌面应用、Web 客户端和 Web 服务器发送遥测数据。 使用 Application Insights 核心遥测 API 发送自定义事件和指标以及自己的标准遥测版本。 此 API 与标准 Application Insights 数据收集器使用的 API 相同。
API 摘要
除了GetMetric(仅.NET)等一些变体外,核心 API 在所有平台上都是统一的。
| 方法 | 用于 |
|---|---|
TrackPageView |
页面、屏幕、窗格或窗体。 |
TrackEvent |
用户操作和其他事件。 用于跟踪用户行为或监视性能。 |
GetMetric |
零和多维指标,集中配置的聚合,仅限 C# 。 |
TrackMetric |
与特定事件无关的性能度量,例如队列长度。 |
TrackException |
记录异常以用于诊断。 追踪它们发生时与其他事件的关系,并检查栈追踪。 |
TrackRequest |
记录服务器请求的频率和持续时间以进行性能分析。 |
TrackTrace |
资源诊断日志消息。 还可以捕获第三方日志。 |
TrackDependency |
记录应用所依赖的外部组件的调用持续时间和频率。 |
可以将属性和指标附加到其中的大多数遥测调用。
先决条件
如果您尚未引用 Application Insights SDK,请注意以下步骤:
将 Application Insights SDK 添加到项目。
在设备或 Web 服务器代码中,包括:
获取 TelemetryClient 实例
获取TelemetryClient的实例
注释
如果使用 Azure Functions v2+ 或 Azure WebJobs v3+,请参阅 Monitor Azure Functions。
注释
对于 .NET/.NET Core 的 ASP.NET Core 应用和非 HTTP/Worker 应用,请从依赖项注入容器中获取 TelemetryClient 实例,如各自的文档中所述。
private TelemetryClient telemetry = new TelemetryClient();
如果看到一条消息告知此方法已过时,请参阅 microsoft/ApplicationInsights-dotnet#1152 了解详细信息。
自动捕获传入的 HTTP 请求。 你可能想要为应用的其他模块创建更多实例 TelemetryClient 。 例如,中间件类中可能有一个 TelemetryClient 实例来报告业务逻辑事件。 可以设置属性,例如 UserId 和 DeviceId 标识计算机。 此信息附加到实例发送的所有事件。
TelemetryClient.Context.User.Id = "...";
TelemetryClient.Context.Device.Id = "...";
注释
TelemetryClient 是线程安全的。
TrackEvent
在 Application Insights 中, 自定义事件 是一个数据点,可以在 指标资源管理器 中显示为聚合计数,并在 搜索 中显示为单个事件。 (它与 MVC 或其他框架“events”无关)。
在代码中插入 TrackEvent 调用以计算各种事件。 例如,你可能希望跟踪用户选择特定功能的频率。 或者,你可能想知道他们达到特定目标的频率或犯特定类型的错误。
例如,在游戏应用中,每当用户赢得游戏时发送事件:
Log Analytics中的自定义事件
customEvents选项卡或使用体验的表中提供了遥测数据。 事件可能来自trackEvent(..)或点击分析自动收集插件。
如果 采样 正在运行,该 itemCount 属性将显示大于 1的值。 例如,itemCount==10 指在 10 次 trackEvent() 调用中,采样过程只传输了其中一个。 若要获取自定义事件的正确计数,请使用代码,例如 customEvents | summarize sum(itemCount)。
注释
itemCount 的最小值为 1;记录本身表示一个条目。
GetMetric
若要了解如何有效地使用 GetMetric() 调用捕获 .NET 和 .NET Core 应用程序的本地预聚合指标,请参阅 .NET 和 .NET Core 中的自定义指标集合。
TrackMetric
注释
Microsoft.ApplicationInsights.TelemetryClient.TrackMetric 不是发送指标的首选方法。 指标应始终在一段时间内进行预聚合,然后发送。 使用 GetMetric(..) 重载之一获取用于访问 SDK 预聚合功能的指标对象。
如果要实现自己的预聚合逻辑,则可以使用 TrackMetric() 该方法发送生成的聚合。 如果您的应用程序要求每次在不进行时间聚合的情况下发送单独的遥测项,那么您可能有事件遥测的用例。 请参阅 TelemetryClient.TrackEvent(Microsoft.ApplicationInsights.DataContracts.EventTelemetry)。
Application Insights 可以为没有附加到特定事件的指标绘制图表。 例如,可以定期监视队列长度。 使用指标时,各个度量值的关注低于变化和趋势,因此统计图表非常有用。
若要将指标发送到 Application Insights,可以使用 TrackMetric(..) API。 可通过两种方式发送指标:
单个值。 每次在应用程序中执行度量时,都会将相应的值发送到 Application Insights。
例如,假设你有一个指标来描述容器中的项数。 在特定时间段内,首先将三个项放入容器中,然后删除两个项。 因此,你会调用
TrackMetric两次。 首先,传递该值3,然后传递值-2。 Application Insights 为你存储这两个值。聚合。 使用指标时,单个测量值通常不引人关注。 相反,对特定时间段内所发生的事情的摘要非常重要。 此类摘要称为 聚合。
在前面的示例中,该时间段的聚合度量总和为
1,而指标值的计数为2。 使用聚合方法时,每个时间段只调用TrackMetric一次并发送聚合值。 建议使用此方法,因为它可以通过向 Application Insights 发送更少的数据点来显著降低成本和性能开销,同时仍收集所有相关信息。
单个值示例
发送单个指标值:
var sample = new MetricTelemetry();
sample.Name = "queueLength";
sample.Sum = 42.3;
telemetryClient.TrackMetric(sample);
Log Analytics中的自定义指标
customMetrics 的 表中提供了遥测数据。 每一行表示应用中的 trackMetric(..) 调用。
-
valueSum:度量之和。 若要获取平均值,请除以valueCount。 -
valueCount:聚合到此trackMetric(..)调用中的测量次数。
注释
valueCount 的最小值为 1;记录本身表示一个条目。
页面视图
在设备或网页应用中,加载每个屏幕或页面时,默认情况下会发送页面视图遥测数据。 但是,可以更改默认值,以在更多时间点或不同时间段跟踪页面视图。 例如,在显示选项卡或窗格的应用中,你可能希望在用户打开新窗格时跟踪页面。
用户和会话数据作为属性与页面视图一起发送,因此当存在页面视图遥测时,用户和会话图表会变得活跃。
自定义页面视图
在 Log Analytics 中的页面遥测
在 Log Analytics 中,两个表显示来自浏览器操作的数据:
-
pageViews:包含有关 URL 和页面标题的数据。 -
browserTimings:包含有关客户端性能的数据,例如处理传入数据所需的时间。
若要查找浏览器处理不同页面所需的时间:
browserTimings
| summarize avg(networkDuration), avg(processingDuration), avg(totalDuration) by name
若要发现不同浏览器的受欢迎程度,请参阅:
pageViews
| summarize count() by client_Browser
若要将页面视图关联到 AJAX 调用,请与依赖项联接:
pageViews
| join (dependencies) on operation_Id
TrackRequest
服务器 SDK 使用 TrackRequest 记录 HTTP 请求。
如果要在未运行 Web 服务模块的上下文中模拟请求,也可以自行调用它。
发送请求遥测的建议方法是将请求作为操作上下文。
操作上下文
通过将遥测项与操作上下文相关联,可以将其关联在一起。 标准请求跟踪模块用于处理 HTTP 请求时发送的异常和其他事件。 在搜索和分析中,可以使用请求的作 ID 轻松查找与请求关联的任何事件。
手动跟踪遥测时,确保遥测关联的最简单方法是使用此模式:
// Establish an operation context and associated telemetry item:
using (var operation = telemetryClient.StartOperation<RequestTelemetry>("operationName"))
{
    // Telemetry sent in here uses the same operation ID.
    ...
    telemetryClient.TrackTrace(...); // or other Track* calls
    ...

    // Set properties of containing telemetry item--for example:
    operation.Telemetry.ResponseCode = "200";

    // Optional: explicitly send telemetry item:
    telemetryClient.StopOperation(operation);

} // When operation is disposed, telemetry item is sent.
有关相关性的详细信息,请参阅 Application Insights 中的遥测关联。
除了设置作上下文, StartOperation 还创建指定的类型的遥测项。 在处理操作时,或如果显式调用 StopOperation,它将发送遥测项。 如果使用 RequestTelemetry 遥测类型,则其持续时间设置为开始和停止之间的时间间隔。
在某个操作范围内报告的遥测项将成为该操作的子项。 操作上下文可以嵌套。
在 搜索中,作上下文用于创建 相关项 列表。

有关自定义操作跟踪的详细信息,请参阅 使用 Application Insights .NET SDK 跟踪自定义操作。
Log Analytics 中的请求
在 Application Insights Analytics 中,请求显示在 requests 表中。
如果 采样 正在运行,该 itemCount 属性将显示大于 1的值。 例如,itemCount==10 指在 10 次 trackRequest() 调用中,采样过程只传输了其中一个。 若要获取按请求名称分段的请求数和平均持续时间的正确计数,请使用如下代码:
requests
| summarize count = sum(itemCount), avgduration = avg(duration) by name
TrackException
将异常发送到 Application Insights:
报告包括堆栈跟踪。
SDK 自动捕获许多异常,因此并不总是必须显式调用 TrackException 。
Log Analytics中的异常
在 Application Insights Analytics 中,表中会显示 exceptions 异常。
如果 采样 正在运行,该 itemCount 属性将显示大于 1的值。 例如,itemCount==10 指在 10 次 trackException() 调用中,采样过程只传输了其中一个。 若要获取按异常类型分段的正确异常计数,请使用如下代码:
exceptions
| summarize sum(itemCount) by type
大部分重要的堆栈信息已经提取到单独的变量中,但你可以拉开结构 details 以获取更多信息。 由于此结构是动态的,因此应将结果转换为所需的类型。 例如:
exceptions
| extend method2 = tostring(details[0].parsedStack[1].method)
若要将异常与其相关请求相关联,请使用联接:
exceptions
| join (requests) on operation_Id
TrackTrace
使用 TrackTrace 可以通过将“痕迹导航跟踪”发送到 Application Insights 来帮助诊断问题。 可以发送诊断数据的区块,并在 搜索中检查它们。
在 .NET Log 适配器中,使用此 API 将第三方日志发送到门户。
telemetry.TrackTrace(message, SeverityLevel.Warning, properties);
记录诊断事件,比如进入或退出函数。
| 参数 | Description |
|---|---|
message |
诊断数据。 可以比名称长得多。 |
properties |
字符串到字符串的映射。 更多数据用于筛选门户中 的异常 。 默认值为空。 |
severityLevel |
支持的值: SeverityLevel.ts。 |
可以搜索消息内容,但与属性值不同,无法对其进行筛选。
message 的大小限制远高于属性的限制。 一个优点是 TrackTrace 能将相对较长的数据放入消息中。 例如,可以在那里对 POST 数据进行编码。
还可以向邮件添加严重性级别。 与其他遥测一样,可以添加属性值来帮助筛选或搜索不同的跟踪集。 例如:
var telemetry = new Microsoft.ApplicationInsights.TelemetryClient();
telemetry.TrackTrace("Slow database response",
                SeverityLevel.Warning,
                new Dictionary<string,string> { {"database", db.ID} });
在 “搜索”中,可以轻松筛选出与特定数据库相关的特定严重性级别的所有消息。
Log Analytics中的跟踪
在 Application Insights Analytics 中,对 TrackTrace 的调用会显示在 traces 表中。
如果 采样 正在运行,该 itemCount 属性将显示大于 1的值。 例如,itemCount==10 指在 10 次 trackTrace() 调用中,采样过程只传输了其中一个。 若要获取正确的跟踪调用计数,请使用代码,例如 traces | summarize sum(itemCount)。
TrackDependency
使用 TrackDependency 调用来跟踪对外部代码段的响应时间和调用成功率。 结果显示在门户中的依赖项图表中。 在进行依赖项调用时,必须添加以下代码片段。
注释
对于 .NET 和 .NET Core,您可以选择使用 TelemetryClient.StartOperation 方法填充用于关联的必要属性以及其他属性,如开始时间和持续时间,这样就无需像以下示例中那样创建自定义计时器。 有关详细信息,请参阅使用 Application Insights .NET SDK 进行自定义操作跟踪中的传出依赖项跟踪部分。
var success = false;
var startTime = DateTime.UtcNow;
var timer = System.Diagnostics.Stopwatch.StartNew();
try
{
    success = dependency.Call();
}
catch(Exception ex)
{
    success = false;
    telemetry.TrackException(ex);
    throw new Exception("Operation went wrong", ex);
}
finally
{
    timer.Stop();
    telemetry.TrackDependency("DependencyType", "myDependency", "myCall", startTime, timer.Elapsed, success);
}
请记住,服务器 SDK 包括一个 依赖项模块 ,用于自动发现和跟踪某些依赖项调用,例如数据库和 REST API。 必须在服务器上安装代理才能使模块正常工作。
如果您想跟踪自动跟踪系统未检测到的调用,请使用此调用。
若要在 C# 中关闭标准依赖项跟踪模块,请编辑 ApplicationInsights.config 并删除对 DependencyCollector.DependencyTrackingTelemetryModule的引用。
Log Analytics中的依赖项
在 Application Insights Analytics 中, trackDependency 调用显示在 dependencies 表中。
如果 采样 正在运行,则 itemCount 属性显示大于 1 的值。 例如,itemCount==10 指在 10 次 trackDependency() 调用中,采样过程只传输了其中一个。 若要获取按目标组件分段的正确依赖项计数,请使用如下代码:
dependencies
| summarize sum(itemCount) by target
若要将依赖项与其相关请求相关联,请使用联接:
dependencies
| join (requests) on operation_Id
清除数据
通常,SDK 会以固定间隔(通常是 30 秒)或缓冲区满时(通常是 500 个项目)发送数据。 在某些情况下,可能需要刷新缓冲区。 在一个即将关闭的应用程序中使用 SDK 的一个示例是。
使用 Flush()时,建议使用以下 模式:
telemetry.Flush();
// Allow some time for flushing before shutdown.
System.Threading.Thread.Sleep(5000);
使用 FlushAsync()时,建议使用以下模式:
await telemetryClient.FlushAsync()
// No need to sleep
我们建议在应用程序关闭时始终刷新,以确保不会丢失遥测数据。
注释
审查 Autoflush 配置:启用 autoflush 功能在web.config文件中可能会导致通过 Application Insights 监控的.NET 应用程序性能下降。 启用自动流后,每次调用 System.Diagnostics.Trace.Trace* 方法都会将单个遥测项作为单独的不同 Web 请求发送到引入服务。 这可能会导致 Web 服务器上的网络和存储耗尽。 为了增强性能,建议禁用 autoflush,同时利用 ServerTelemetryChannel,旨在实现更有效的遥测数据传输。
该函数是 服务器遥测通道的异步函数。
经过身份验证的用户
在 Web 应用中,默认情况下,用户 由 Cookie 标识 。 如果用户从其他计算机或浏览器访问你的应用,或者如果用户删除 Cookie,则可能会多次计数。
如果用户登录到应用,可以通过在浏览器代码中设置经过身份验证的用户 ID 来获取更准确的计数。 无需使用用户的实际登录名称。 它只能是该用户唯一的 ID。 它不得包含空格或任何字符 ,;=|。
用户 ID 也在会话 Cookie 中设置,并发送到服务器。 如果安装了服务器 SDK,则会将经过身份验证的用户 ID 作为客户端和服务器遥测的上下文属性的一部分发送。 然后,可以对其进行筛选和搜索。
如果应用将用户分组到帐户中,还可以传递帐户的标识符。 相同的字符限制适用。
在 指标资源管理器中,可以创建统计 用户、已验证和 用户帐户的图表。
还可以 搜索 具有特定用户名和帐户的客户端数据点。
注释
.NET Core SDK中ApplicationInsightsServiceOptions类的EnableAuthenticationTrackingJavaScript属性简化了JavaScript配置,以便在Application Insights JavaScript SDK发送的每个跟踪中将用户名作为授权ID注入其中。
当此属性设置为 true 时,ASP.NET Core中用户的用户名与 client-side telemetry 一起打印。 因此,不再需要手动添加 appInsights.setAuthenticatedUserContext,因为它已由 SDK 注入 ASP.NET Core。 身份验证 ID 还会发送到服务器,并在 .NET Core 中的 SDK 中进行标识和用于服务器端遥测,如 JavaScript API 参考中所述。
对于无法与 ASP.NET Core MVC 以相同方式运行的 JavaScript 应用程序(例如 SPA Web 应用),您仍需手动添加 appInsights.setAuthenticatedUserContext。
使用属性筛选、搜索并分类您的数据
可以将属性和度量值附加到事件、指标、页面视图、异常和其他遥测数据。
属性 是字符串值,可用于筛选使用情况报告中的遥测数据。 例如,如果你的应用提供了多个游戏,则可以将游戏的名称附加到每个事件,以便你可以看到哪些游戏更受欢迎。
字符串长度限制为 8,192。 如果要发送大块数据,请使用消息参数 TrackTrace。
指标 是可以以图形方式呈现的数值。 例如,你可能想要查看玩家的分数是否逐渐增加。 图形可以按随事件一起发送的属性进行分段,以便可以获取不同游戏的单独或堆积图。
指标值应大于或等于 0 才能正确显示。
可以使用的 属性、属性值和指标数量 有一些限制。
// Set up some properties and metrics:
var properties = new Dictionary <string, string>
    {{"game", currentGame.Name}, {"difficulty", currentGame.Difficulty}};
var metrics = new Dictionary <string, double>
    {{"Score", currentGame.Score}, {"Opponents", currentGame.OpponentCount}};

// Send the event:
telemetry.TrackEvent("WinGame", properties, metrics);
重要
请确保不要在属性中记录个人身份信息。
设置属性和指标的替代方法
如果更方便,可以在单独的对象中收集事件的参数:
var event = new EventTelemetry();

event.Name = "WinGame";
event.Metrics["processingTime"] = stopwatch.Elapsed.TotalMilliseconds;
event.Properties["game"] = currentGame.Name;
event.Properties["difficulty"] = currentGame.Difficulty;
event.Metrics["Score"] = currentGame.Score;
event.Metrics["Opponents"] = currentGame.Opponents.Length;

telemetry.TrackEvent(event);
警告
请勿重复使用同一遥测项实例(event 在此示例中)多次调用 Track*() 。 这种做法可能会导致使用不正确的配置发送遥测数据。
Log Analytics中的自定义度量和属性
在 Log Analytics 中,自定义指标和属性显示在每个遥测记录的 customMeasurements 和 customDimensions 属性中。
例如,如果将名为“game”的属性添加到请求遥测,此查询将计算不同“game”值的出现次数,并显示自定义指标“score”的平均值:
requests
| summarize sum(itemCount), avg(todouble(customMeasurements.score)) by tostring(customDimensions.game)
请注意:
- 从
customDimensions或customMeasurementsJSON 中提取值时,它具有动态类型,因此必须强制转换该值tostring或todouble。 - 若要考虑 采样的可能性,请使用
sum(itemCount)不count()。
计时事件
有时你可能需要记录完成动作所需的时间。 例如,你可能想要了解用户在游戏中考虑选择的时间。 若要获取此信息,请使用度量参数。
var stopwatch = System.Diagnostics.Stopwatch.StartNew();

// ... perform the timed action ...

stopwatch.Stop();

var metrics = new Dictionary <string, double>
    {{"processingTime", stopwatch.Elapsed.TotalMilliseconds}};

// Set up some properties:
var properties = new Dictionary <string, string>
    {{"signalSource", currentSignalSource.Name}};

// Send the event:
telemetry.TrackEvent("SignalProcessed", properties, metrics);
自定义遥测的默认属性
如果要为编写的某些自定义事件设置默认属性值,请在实例中 TelemetryClient 设置它们。 它们附加在从客户端发送的每一项遥测数据上。
using Microsoft.ApplicationInsights.DataContracts;

var gameTelemetry = new TelemetryClient();
gameTelemetry.Context.GlobalProperties["Game"] = currentGame.Name;
// Now all telemetry is automatically sent with the context property:
gameTelemetry.TrackEvent("WinGame");
单个遥测调用可以替代其属性字典中的默认值。
若要为所有遥测数据(包括标准收集模块的数据)添加属性,请实现 。
禁用遥测
若要 动态停止和启动 遥测的收集和传输,请执行以下步骤:
using  Microsoft.ApplicationInsights.Extensibility;

TelemetryConfiguration.Active.DisableTelemetry = true;
开发人员模式
在调试期间,使遥测数据在管道中快速传输非常有用,以便能立即查看结果。 还可以获取其他消息,这些消息可帮助你跟踪遥测问题。 在生产中将其关闭,因为它可能会减慢你的应用速度。
设置所选自定义遥测的仪表密钥
var telemetry = new TelemetryClient();
telemetry.InstrumentationKey = "---my key---";
// ...
动态连接字符串
为了避免混合开发、测试和生产环境中的遥测数据,可以 创建单独的 Application Insights 资源 并更改其密钥,具体取决于环境。
可以在代码中设置检测密钥,而不是从配置文件中获取检测密钥。 在初始化方法中设置密钥,例如 ASP.NET 服务中的 global.aspx.cs:
protected void Application_Start()
{
Microsoft.ApplicationInsights.Extensibility.
TelemetryConfiguration.Active.InstrumentationKey =
// - for example -
WebConfigurationManager.Settings["ikey"];
...
}
TelemetryContext
TelemetryClient 具有 Context 属性,其中包含随所有遥测数据一起发送的值。 它们通常由标准遥测模块设置,但你也可以自行设置它们。 例如:
telemetry.Context.Operation.Name = "MyOperationName";
如果你自行设置这些值中的任何一个,请考虑从 ApplicationInsights.config 中删除相关行,以便你的值和标准值不会感到困惑。
- 组件:应用及其版本。
- 设备:有关运行应用的设备的数据。 在 Web 应用中,遥测是从服务器或客户端设备传输的。
- InstrumentationKey:Azure 中用于显示遥测数据的 Application Insights 资源。 它通常从 ApplicationInsights.config加载。
- 位置:设备的地理位置。
-
操作:在 Web 应用中,当前 HTTP 请求。 在其他应用类型中,可以将此值设置为将事件组合在一起。
- ID:生成的值,该值关联不同的事件,以便在诊断搜索中检查任何事件时,可以找到相关项。
- 名称:标识符,通常是 HTTP 请求的 URL。
- SyntheticSource:如果不是 null 或为空,则表示请求的源已标识为机器人或 Web 测试。 在默认情况下,它不会被包括在度量探索器中的计算中。
- 会话:用户的会话。 ID 设置为生成的值,当用户一段时间未处于活动状态时会更改该值。
- 用户:用户信息。
限制
每个应用程序,即每个连接字符串的指标和事件数量都有一些限制。 限制取决于选择的定价计划。
| Resource | 默认限制 | 最大限制 | 注释 |
|---|---|---|---|
| 每日的总数据量 | 100 GB | 联系支持人员。 | 可以设置上限来减少数据。 如果需要更多数据,可以在门户中最多将上限提高到 1,000 GB。 如需大于 1,000 GB 的容量,请将电子邮件发送到 AIDataCap@microsoft.com。 |
| Throttling | 32,000 事件/秒 | 联系支持人员。 | 限制按分钟计量。 |
| 数据保留日志 | 30 至 730 天 | 730 天 | 此资源用于日志。 |
| 数据保留指标 | 90 天 | 90 天 | 此资源用于指标资源管理器。 |
| 可用性多步测试详细结果保留 | 90 天 | 90 天 | 此资源提供了每个步骤的详细结果。 |
| 最大遥测项目大小 | 64 KB | 64 KB | |
| 每批最大遥测项数 | 64,000 | 64,000 | |
| 属性和指标名称长度 | 150 | 150 | 请参阅类型架构。 |
| 属性值字符串长度 | 8,192 | 8,192 | 请参阅类型架构。 |
| 跟踪和异常消息长度 | 32,768 | 32,768 | 请参阅类型架构。 |
| 每个 Application Insights 资源的可用性测试计数 | 100 | 100 | |
| 每个资源组的可用性测试次数 | 800 | 800 | 请参阅 Azure Resource Manager |
| 每个测试的可用性测试最大重定向次数 | 10 | 10 | |
| 可用性测试最小测试频率 | 300 秒 | 自定义测试频率或小于 5 分钟的频率需要自定义 TrackAvailability 实现。 | |
| .NET Profiler 和 Snapshot Debugger 数据保留 | 两周 | 联系支持人员。 最长保留期限为六个月。 | |
| .NET Profiler每天发送的数据 | 无限制 | 无限制。 | |
| 每天发送的 Snapshot Debugger 数据 | 每个受监视的应用每天 30 个快照 | 无限制。 | 可以通过配置修改每个应用程序收集的快照数。 |
有关定价和配额的详细信息,请参阅 Application Insights 计费。
若要避免达到数据速率限制,请使用 采样。
若要确定数据的保留时间,请参阅 数据保留和隐私。
示例应用程序
.NET核心控制台应用程序:如果使用以 .NET Core(2.0 或更高版本)或 .NET Framework(4.7.2 或更高版本)编写的控制台应用程序,请使用此示例。
ASP.NET Core 使用 HostedServices 的后台任务:如果你在使用 ASP.NET Core 并按照 官方指南 创建后台任务,请使用此示例。
.NET核心辅助角色服务:如果有.NET辅助角色服务应用程序,请根据 官方指南使用此示例。
Troubleshooting
测试应用程序主机与引入服务之间的连接性
Application Insights SDK 和代理会发送遥测,以将其作为 REST 调用引入到终结点。 可以使用原始 REST 客户端通过 PowerShell 或使用 curl 命令,测试从 Web 服务器或应用程序主机计算机到引入服务终结点的连接。 请参阅 Azure 监视器 Application Insights 中的应用程序遥测丢失故障排除。
开源 SDK
发布说明
服务更新 还汇总了主要的 Application Insights 改进。
后续步骤
- 验证是否正在运行受支持的 Application Insights SDK 版本 。
- 有关 Application Insights 的类型和数据模型,请参阅数据模型。
- 查看 System.Diagnostics.Activity 用户指南,了解如何关联遥测。
- 若要查看常见问题解答(FAQ),请参阅: