Azure Monitor从系统收集并聚合指标和日志,以监视可用性、性能和复原能力,并通知你影响系统的问题。 可以使用 Azure 门户、PowerShell、Azure CLI、REST API 或客户端库来设置和查看监视数据。
不同的指标和日志可用于不同的资源类型。 本文介绍可为此服务收集的监视数据类型以及分析这些数据的方法。
使用 Azure Monitor 收集数据
下表介绍了如何收集数据来监视服务,以及收集到的数据可以做些什么:
| 要收集的数据 | 说明 | 如何收集和路由数据 | 查看数据的位置 | 支持的数据 |
|---|---|---|---|---|
| 指标数据 | 指标是数字值,用于描述系统某个方面在特定时间点的情况。 使用算法聚合指标,将指标与其他指标进行比较,并分析一段时间内趋势的指标。 | - 定期自动收集。
- 可以将某些平台指标路由到Log Analytics工作区以与其他数据进行查询。 检查每个指标的“DS 导出”设置,查看是否可以使用诊断设置来路由指标数据。 |
指标浏览器 | Azure Monitor 支持的 Azure Data Explorer 指标 |
| 资源日志数据 | 日志是记录的具有时间戳的系统事件。 日志可包含不同类型的数据,可以结构化或采用自由文本格式。 可以将资源日志数据路由到Log Analytics工作区进行查询和分析。 | 创建诊断设置以收集和路由资源日志数据。 | Log Analytics | 由 Azure Monitor 支持的 Azure Data Explorer 资源日志数据 |
| 活动日志数据 | Azure Monitor活动日志提供有关订阅级别事件的洞察。 活动日志包括何时修改了资源或何时启动了虚拟机等信息。 | - 自动收集。
- 创建诊断设置到一个 Log Analytics 工作区,且不收取任何费用。 |
活动日志 |
有关Azure Monitor支持的所有数据的列表,请参阅:
Azure Data Explorer 的内置监控
Azure Data Explorer提供用于监视服务的指标和日志。
使用指标监视Azure Data Explorer性能、运行状况和使用情况
Azure Data Explorer指标提供有关Azure Data Explorer群集资源的运行状况和性能的关键指标。 使用指标以独立指标的形式监视特定方案中Azure Data Explorer群集使用情况、运行状况和性能。 还可以使用指标作为操作Azure仪表板和Azure警报的基础。
要在 Azure 门户中使用指标监控 Azure Data Explorer 资源,请执行以下步骤:
- 登录到 Azure 门户。
- 在Azure Data Explorer群集的左侧窗格中,搜索 metrics。
- 选择“指标”,以打开指标窗格,然后开始对群集进行分析。
在指标窗格中,选择要跟踪的特定指标,选择聚合数据的方式,并创建要在仪表板上查看的指标图表。
Resource 和 Metric Namespace 选取器已预选为 Azure Data Explorer 集群。 下图中的数字对应编号列表。 这些内容可以指导你掌握在设置和查看指标时使用的不同选项。

- 若要创建指标图表,请选择指标名称和每个指标的相关聚合。 有关不同指标的详细信息,请参阅 supported Azure Data Explorer 指标。
- 选择“添加指标”可以查看在同一图表中绘制的多个指标。
- 选择“+ 新建图表”可在一个视图中查看多个图表。
- 使用时间选取器更改时间范围(默认:过去 24 小时)。
- 对具有维度的指标使用 Add filter 和 应用拆分。
- 选择“固定到主面板”可将图表配置添加到主面板,以便可以再次查看它。
- 设置 新警报规则 以根据设定条件可视化指标。 新的警报规则包括您的图表中的目标资源、指标、拆分维度和筛选器维度。 在 alert 规则创建窗格中修改这些设置。
使用诊断日志监视 Azure Data Explorer 的数据摄取、命令、查询和表格
Azure Data Explorer是一项快速、完全托管的数据分析服务,用于实时分析来自应用程序、网站、IoT 设备等的大量数据流。 Azure Monitor资源日志提供有关Azure资源操作的数据。 Azure Data Explorer使用诊断日志来深入了解引入、命令、查询和表。 可以将操作日志导出到Azure Storage、事件中心或Log Analytics,以监视引入、命令和查询状态。 可以将来自Azure Storage和Azure Event Hubs的日志路由到Azure Data Explorer群集中的表,以便进一步分析。
重要
诊断日志数据可能包含敏感数据。 请根据监视需求限制日志目标的权限。
注意事项
在 Azure 门户中,Metrics 和 Insights 页的原始指标数据存储在Azure Monitor中。 这些页面上的查询会直接查询原始指标数据,以提供最准确的结果。 使用诊断设置功能时,可以将原始指标数据迁移到Log Analytics工作区。 在迁移过程中,可能会因为四舍五入而丢失部分数据精度;因此,查询结果可能与原始数据略有不同。 误差幅度小于百分之一。
可以使用诊断日志来配置以下日志数据的集合:
注意事项
注意事项
失败的引入日志仅报告引入作的最终状态,这与引入 结果 指标不同,该指标针对内部重试的暂时性故障发出。
- 成功引入作:这些日志包含有关成功完成的引入作的信息。
- 失败的引入作:这些日志包含有关失败引入作的详细信息,包括错误详细信息。
- 引入批处理操作:这些日志包含准备引入的批处理的详细统计信息,例如持续时间、批大小、Blob 计数和批处理类型。
可以将日志数据发送到Log Analytics工作区、存储帐户或将其流式传输到事件中心。
诊断日志默认已禁用。 使用以下步骤为群集启用诊断日志:
在 Azure 门户中,选择要监视的群集资源。
在“监视”下,选择“诊断设置” 。
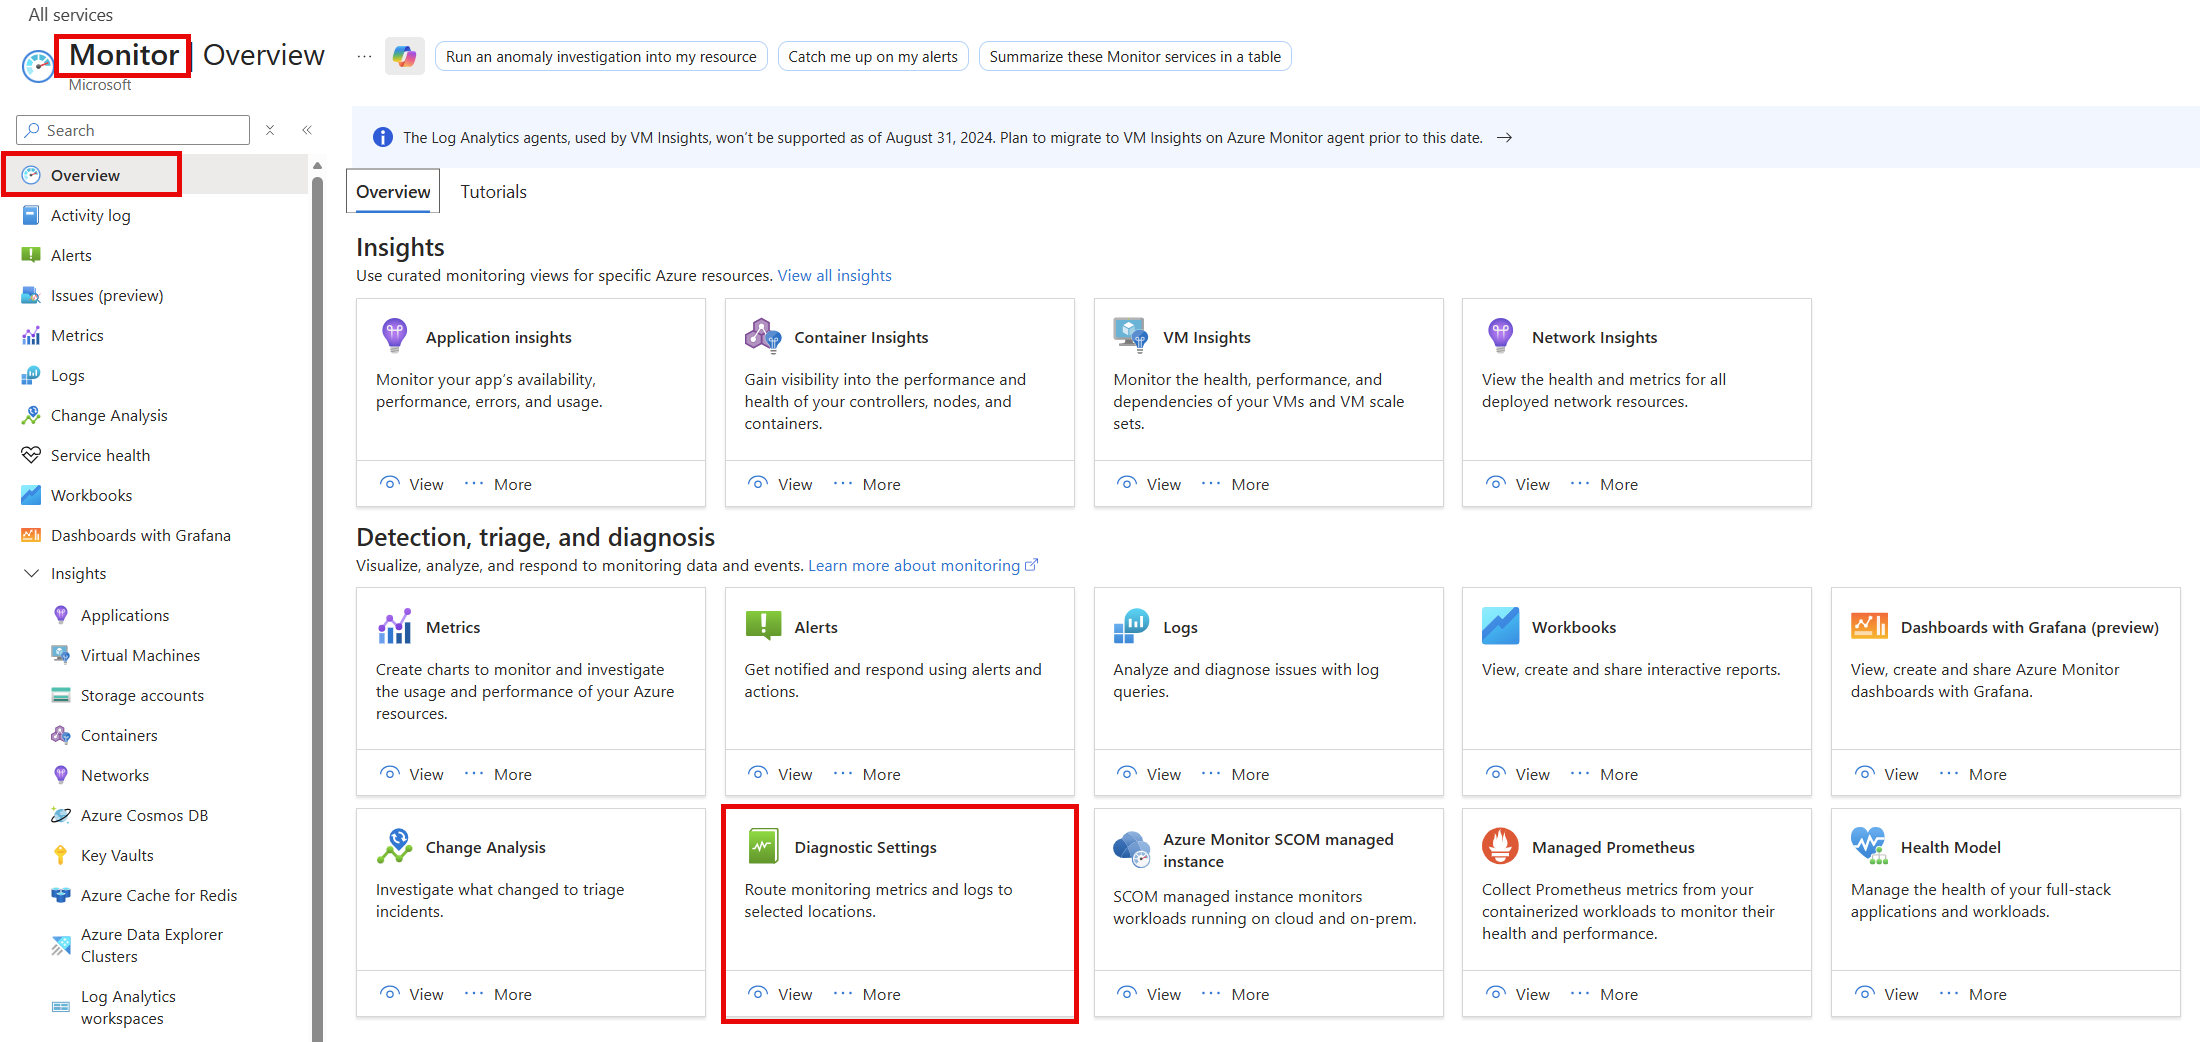
选择“添加诊断设置”。
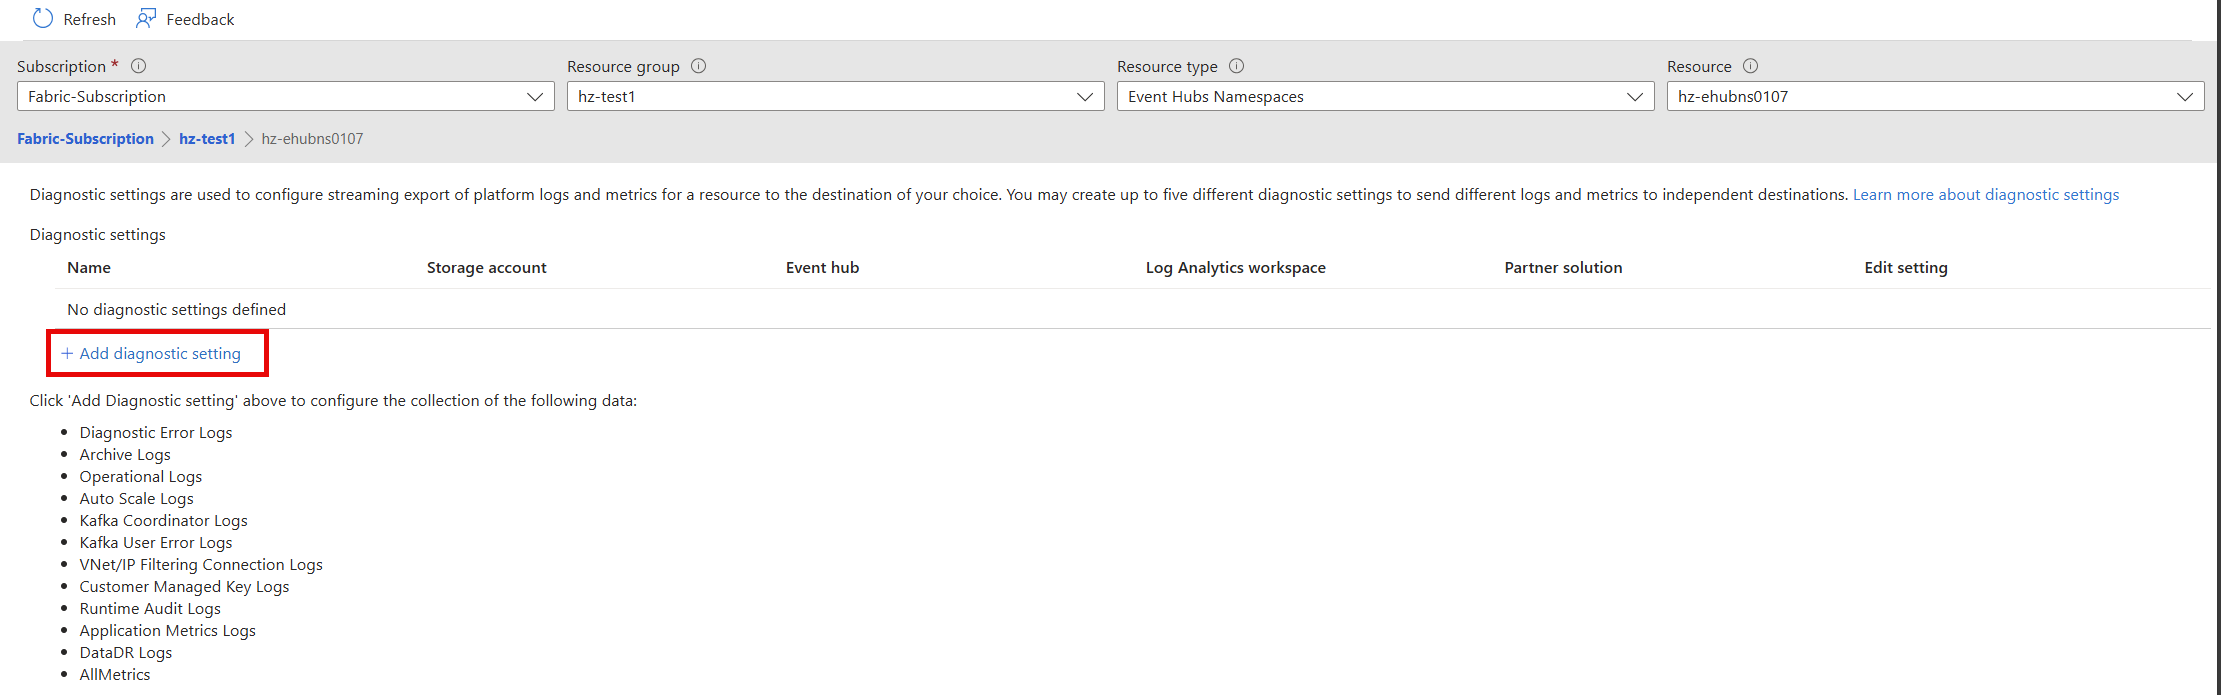
在“诊断设置”窗口中,执行以下操作:
诊断设置屏幕的
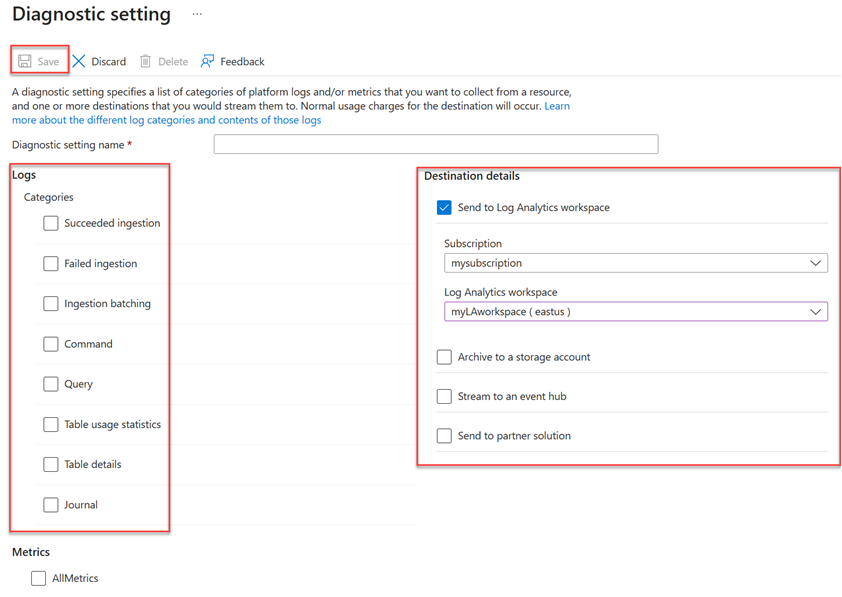
- 输入一个诊断设置名称。
- 选择一个或多个目标:Log Analytics工作区、存储帐户或事件中心。
- 选择要收集的日志: 成功的引入、 失败的引入、 引入批处理、 命令、 查询、 表使用情况统计信息、 表详细信息或 日记。
- 选择 metrics 以收集(可选)。
- 选择“保存”以保存新的诊断日志设置和指标。


创建设置后,日志将开始显示在配置的目标目标中:存储帐户、事件中心或Log Analytics工作区。
注意事项
如果将日志发送到 Log Analytics 工作区,SucceededIngestion、FailedIngestion、IngestionBatching、Command、Query、TableUsageStatistics、TableDetails 和 Journal 日志存储在 Log Analytics 的表中,分别为:SucceededIngestion、FailedIngestion、ADXIngestionBatching、ADXCommand、ADXQuery、ADXTableUsageStatistics、ADXTableDetails 和 ADXJournal。
使用Azure Monitor工具分析数据
Azure门户中提供了这些Azure Monitor工具,可帮助你分析监视数据:
某些Azure服务在Azure门户中有一个内置的监视仪表板。 这些仪表板称为 insights,可以在Azure门户中的 Azure Monitor Insights 部分找到它们。
Metrics 资源管理器允许查看和分析Azure资源的指标。 有关详细信息,请参阅使用 Azure Monitor 指标资源管理器分析指标。
Log Analytics允许使用 Kusto 查询语言(KQL)查询和分析日志数据。 有关详细信息,请参阅 在 Azure Monitor 中开始日志查询。
Azure门户网站具有用于查看和基本搜索活动日志的用户界面。 若要进行更深入的分析,将数据路由到Azure Monitor日志,并在Log Analytics中运行更复杂的查询。
Application Insights监视 Web 应用程序的可用性、性能和使用情况,这样就可以识别和诊断错误,而无需等待用户报告错误。
Application Insights 包括与各种开发工具的连接点,并与 Visual Studio 集成以支持 DevOps 流程。 有关详细信息,请参阅 应用服务的监视。
支持更复杂可视化效果的工具包括:
- Dashboards,使你能够将不同类型的数据合并到Azure门户中的单个窗格中。
- Workbooks,可以在Azure门户中创建的可自定义报表。 工作簿可以包括文本、指标和日志查询。
- Grafana,一个在运行仪表板中表现出色的开放平台工具。 可以使用 Grafana 创建仪表板,其中包含来自除Azure Monitor以外的多个源的数据。
- Power BI,这是一项业务分析服务,用于跨各种数据源提供交互式可视化效果。 可以将Power BI配置为从Azure Monitor自动导入日志数据,以利用这些可视化效果。
导出Azure Monitor数据
可以使用以下方法将数据从Azure Monitor导出到其他工具:
Metrics: 使用 REST API 从 Azure Monitor 指标数据库中提取指标数据。 有关详细信息,请参阅 Azure Monitor REST API 参考。
日志:使用 REST API 或关联的客户端库。
若要开始使用 Azure Monitor REST API,请参阅Azure监视 REST API 演练。
使用 Kusto 查询分析日志数据
可以使用 Kusto 查询语言(KQL)分析Azure Monitor日志数据。 有关详细信息,请参阅 Azure Monitor 中的
使用 Azure Monitor 警报通知您出现的问题
Azure Monitor警报使你能够识别和解决系统中的问题,并在客户注意到它们之前在监视数据中找到特定条件时主动通知你。 可以在Azure Monitor数据平台中针对任何指标或日志数据源发出警报。 有不同类型的 Azure Monitor 警报,根据您正在监视的服务和收集的监视数据而定。 请参阅选择正确的警报规则类型。
有关Azure资源的常见警报示例,请参阅 Sample 日志警报查询。
大规模部署警报
对于某些服务,可以通过将相同的指标警报规则应用于同一Azure区域中存在的多个同一类型的资源来大规模监视。 Azure Monitor基线警报(AMBA)提供了一种半自动化的方法,用于大规模实现重要的平台指标警报、仪表板和指南。
使用Azure Advisor获取个性化建议
对于某些服务,如果在资源操作期间出现严重情况或即将发生变化,则门户中的服务“概述”页面上会显示一个警报。 可以在左侧菜单“监视”下的“顾问建议”中找到警报的详细信息和建议补丁。 在正常操作期间,不会显示任何顾问建议。
有关Azure Advisor的详细信息,请参阅 Azure Advisor 概述。