适用于: Azure Data Factory
  Azure Synapse Analytics
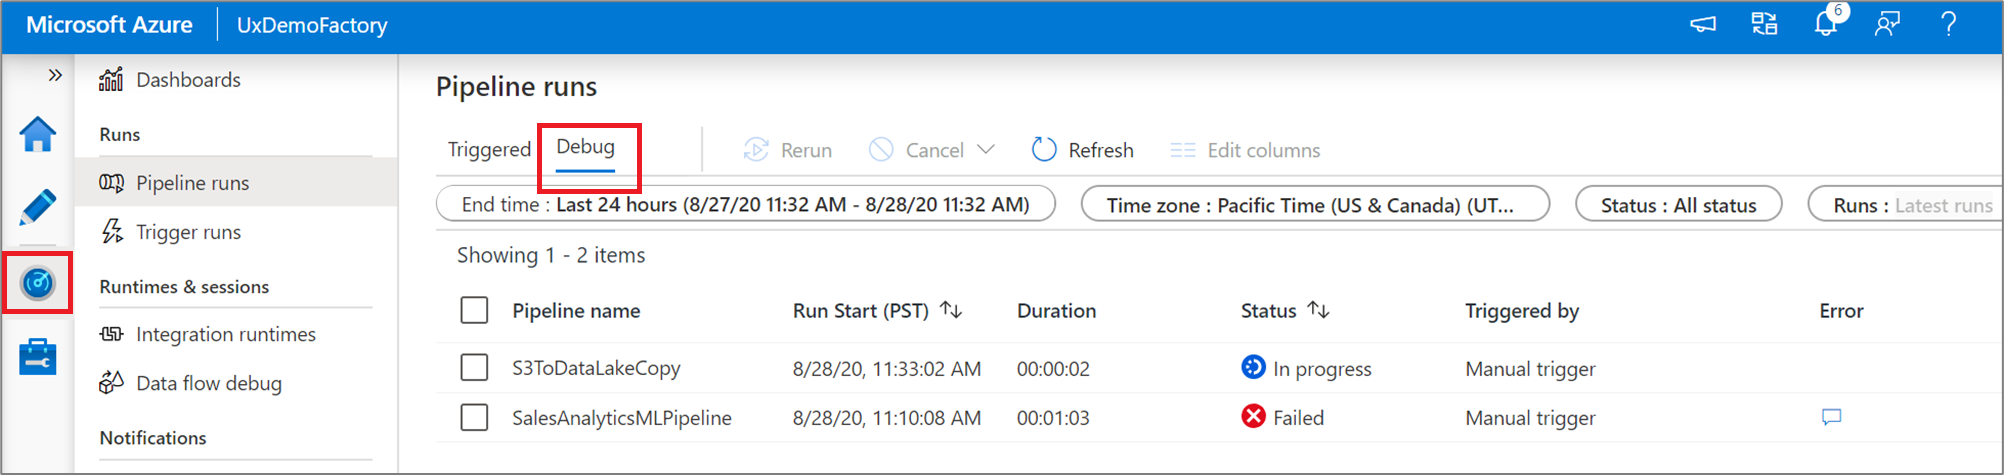
在Azure Data Factory中创建和发布管道后,可以将其与触发器相关联,或手动启动即席运行。 可以在 Azure Data Factory 的用户界面中原生监视所有管道运行。 若要打开监视体验,请在 Azure 门户 的数据工厂边栏选项卡中选择 监控与管理 磁贴。 如果已在 ADF UX 中,请单击左侧边栏上的“监视”图标。
默认情况下,所有数据工厂运行都以浏览器的本地时区显示。 如果你更改时区,所有日期/时间字段都会与你选择的时区保持一致。
监视管道运行
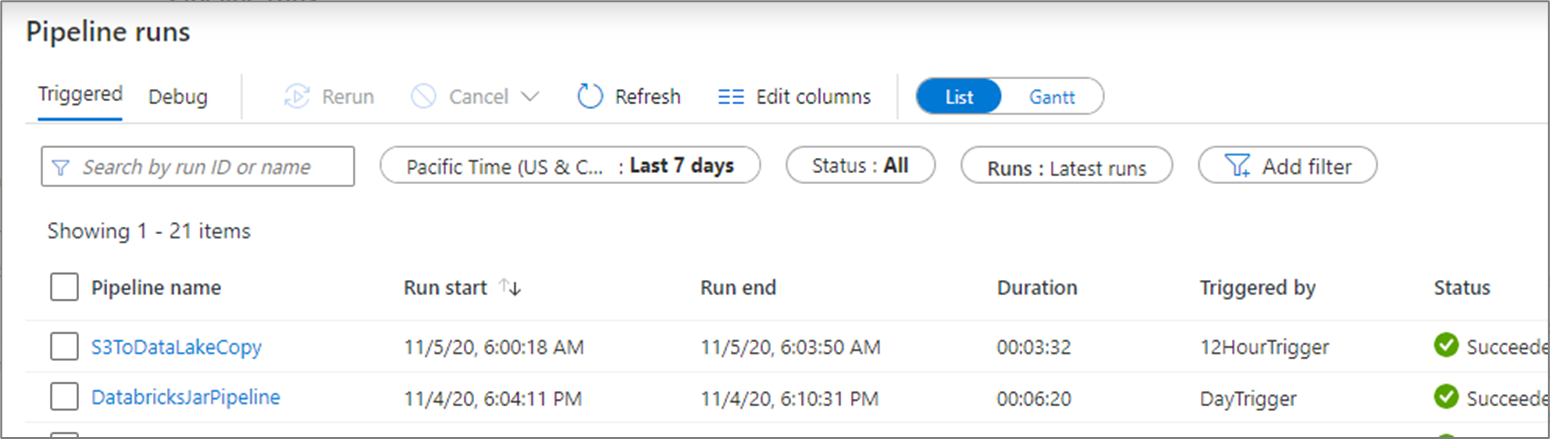
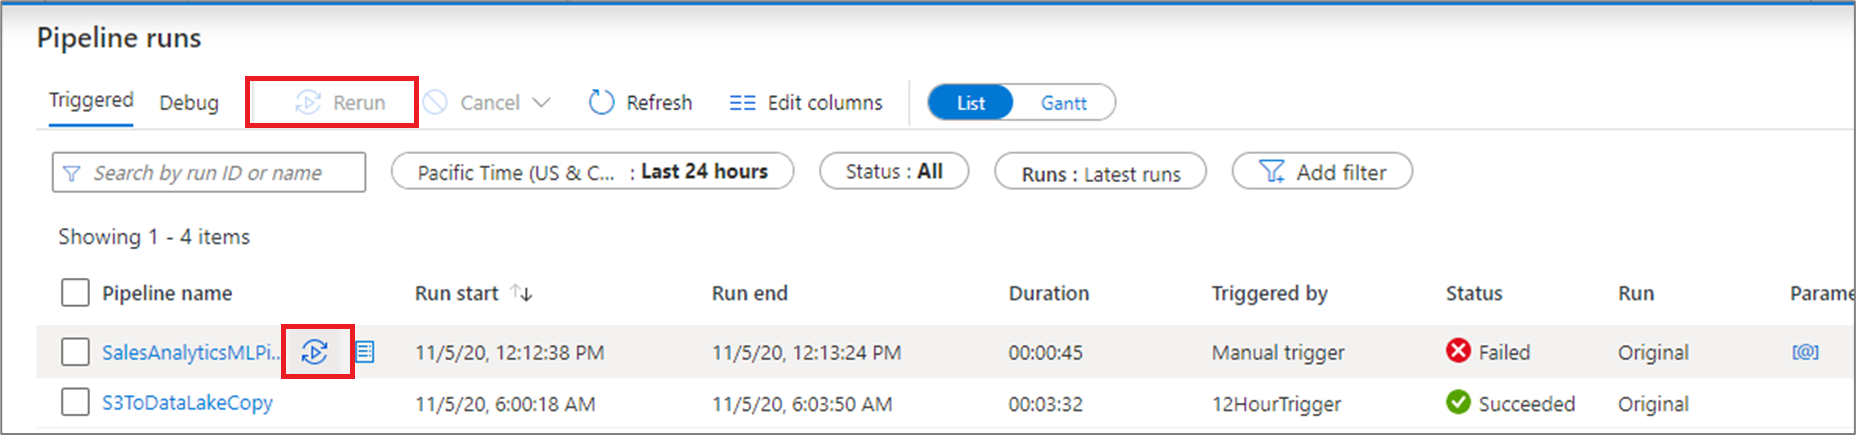
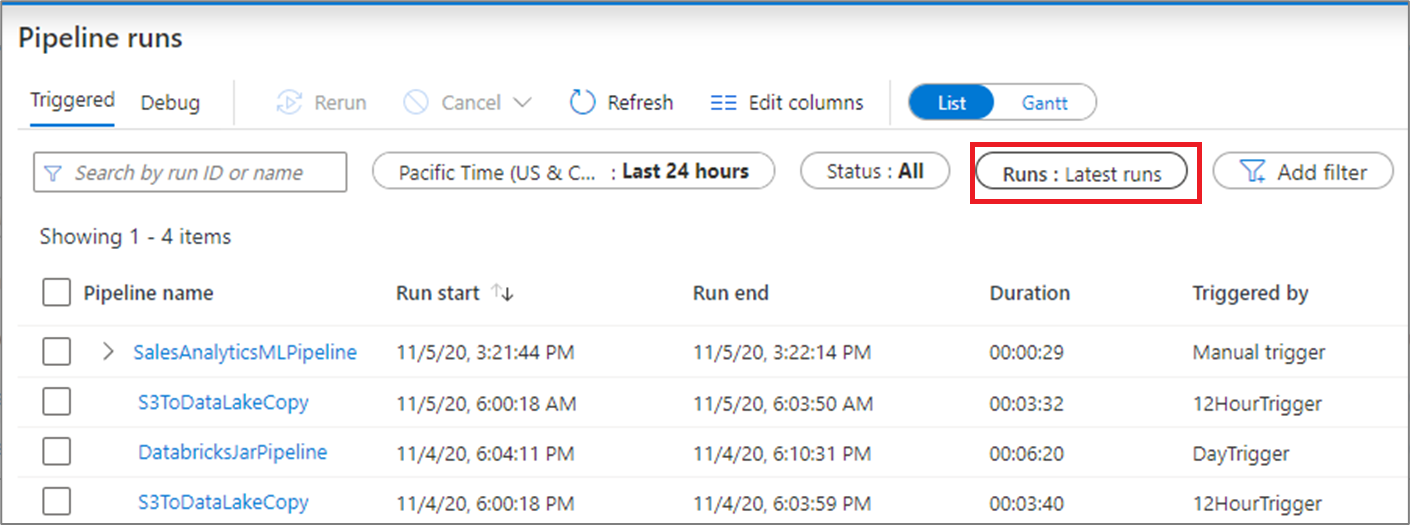
默认监视视图是所选时段内触发的管道运行的列表。 你可以更改时间范围并按状态、管道名称或注释进行筛选。 将鼠标悬停在特定管道运行上可获取特定于运行的操作,如重新运行和消耗报告。
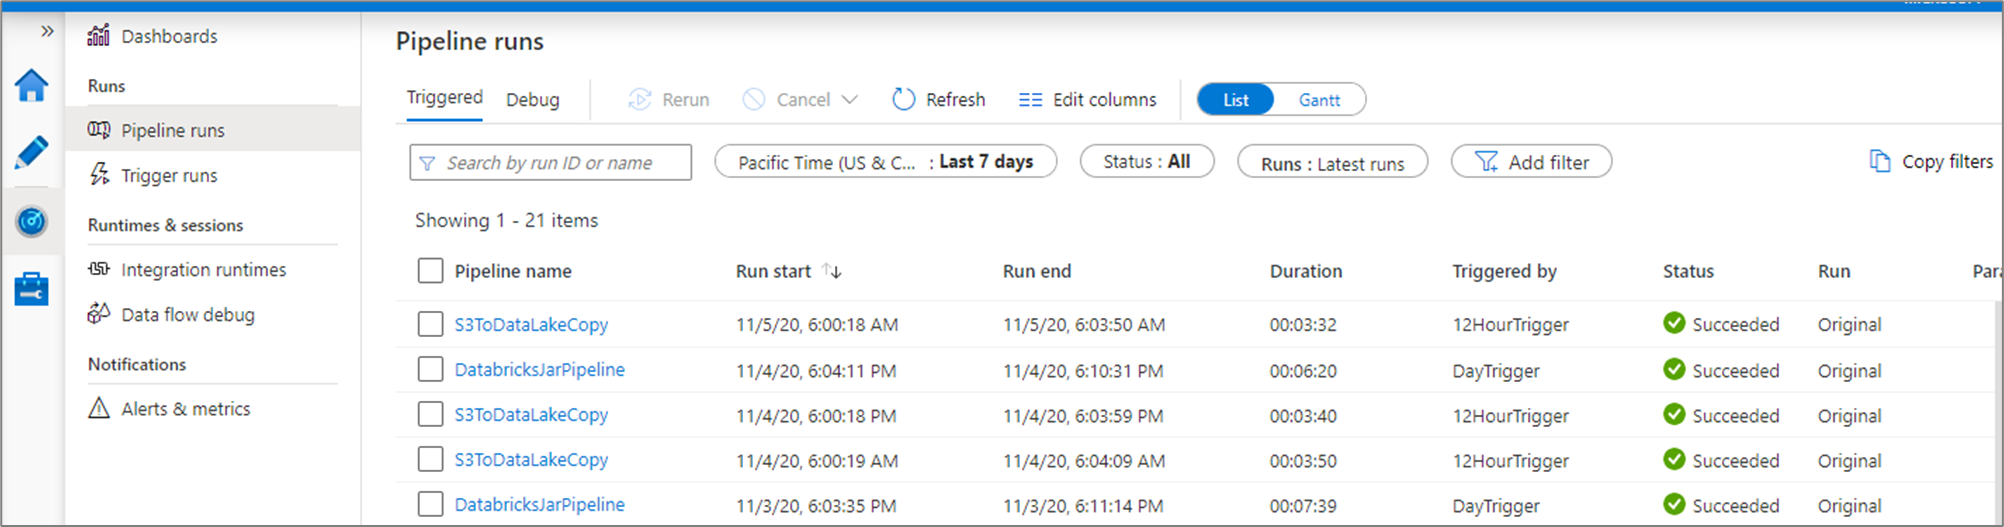
管道运行网格包含以下列:
| 列名 | 说明 |
|---|---|
| 管道名称 | 管道的名称 |
| 运行开始时间 | 管道运行的开始日期和时间(MM/DD/YYYY,HH:MM:SS AM/PM) |
| 运行结束时间 | 管道运行的结束日期和时间(MM/DD/YYYY,HH:MM:SS AM/PM) |
| 持续时间 | 运行持续时间 (HH:MM:SS) |
| 触发者 | 启动了管道的触发器的名称 |
| 状态 | 失败、成功、进行中、已取消或已排队 |
| 批注 | 与管道关联的可筛选标记 |
| 参数 | 管道运行的参数(名称/值对) |
| 错误 | 在管道失败的情况下出现的运行错误 |
| 运行 | “原始”、“重新运行”或“重新运行(最新)” |
| 运行 ID | 管道运行的 ID |
需要手动选择“刷新”按钮来刷新管道和活动运行的列表。 当前不支持自动刷新。
若要查看调试运行的结果,请选择“调试”选项卡。
监视活动运行
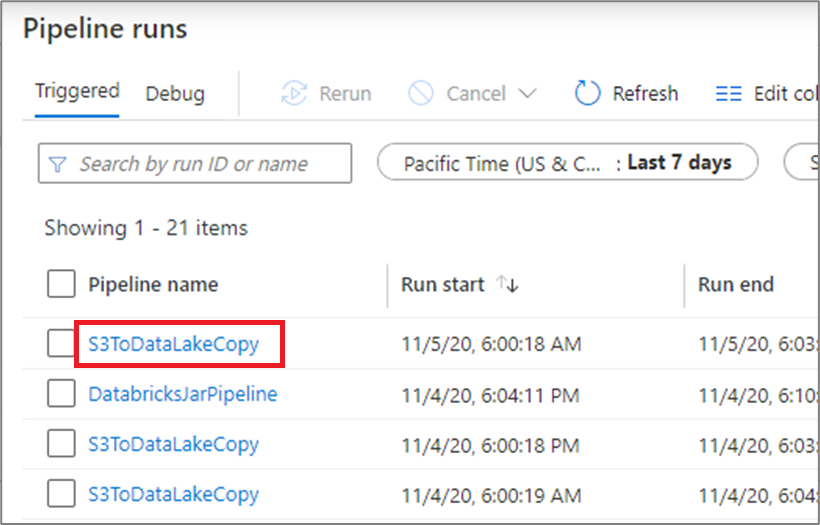
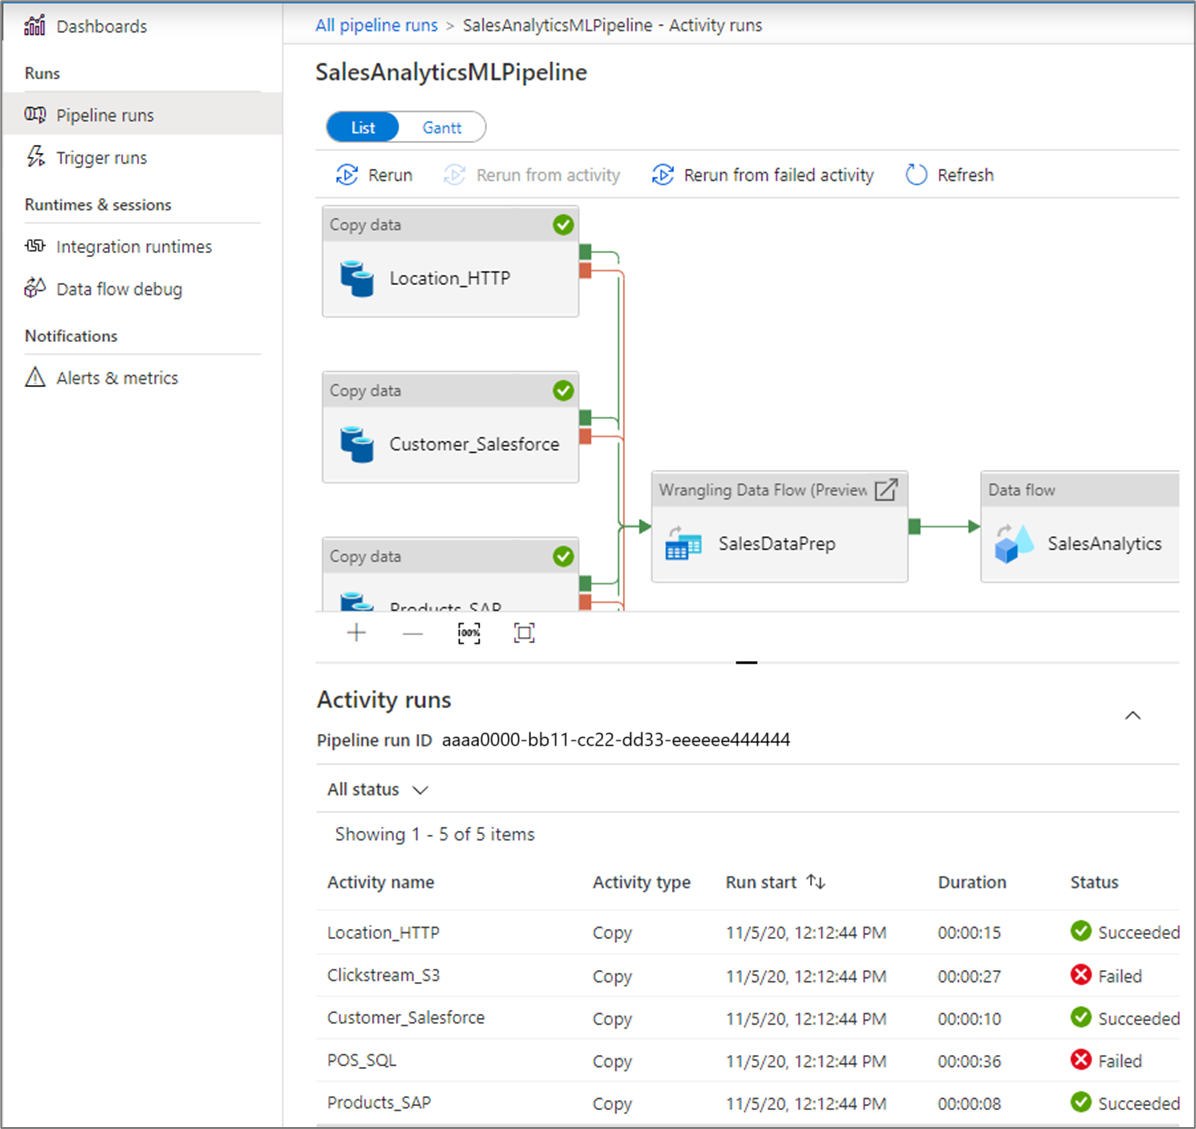
若要获取某特定管道运行的单个活动运行的详细视图,请单击管道名称。
列表视图显示对应于每个管道运行的活动运行。 将鼠标悬停在特定活动运行上,可以获取与该运行相关的信息,例如 JSON 输入、JSON 输出,以及详细的活动监控体验。
| 列名 | 说明 |
|---|---|
| 活动名称 | 管道中的活动的名称 |
| 活动类型 | 活动的类型,例如 Copy, ExecuteDataFlow 或 AzureMLExecutePipeline |
| 行动 | 图标,用于查看 JSON 输入信息、JSON 输出信息或详细的特定于活动的监视体验 |
| 运行开始时间 | 活动运行的开始日期和时间(MM/DD/YYYY,HH:MM:SS AM/PM) |
| 持续时间 | 运行持续时间 (HH:MM:SS) |
| 状态 | 失败、成功、正在进行或已取消 |
| Integration Runtime | 活动在哪个 Integration Runtime 上运行 |
| 用户属性 | 活动的用户定义属性 |
| 错误 | 在活动失败的情况下出现的运行错误 |
| 运行 ID | 活动运行的 ID |
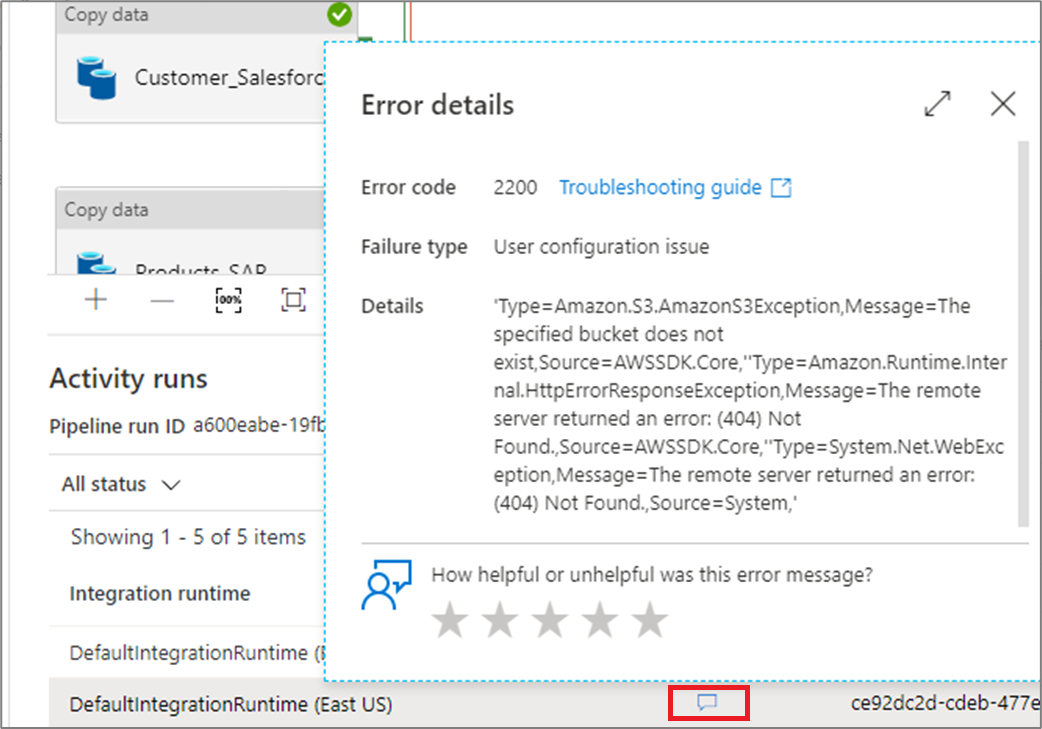
如果某个活动失败,可通过单击错误列中的图标来查看详细的错误消息。
提升要监视的用户属性
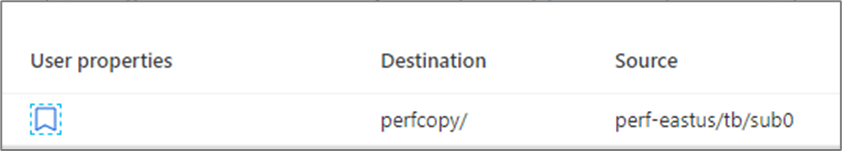
将任何管道活动属性提升为用户属性,使其成为受监视的实体。 例如,可以将管道中复制活动的“源”和“目标”属性提升为用户属性。
注意
最多只能将五个管道活动属性提升为用户属性。
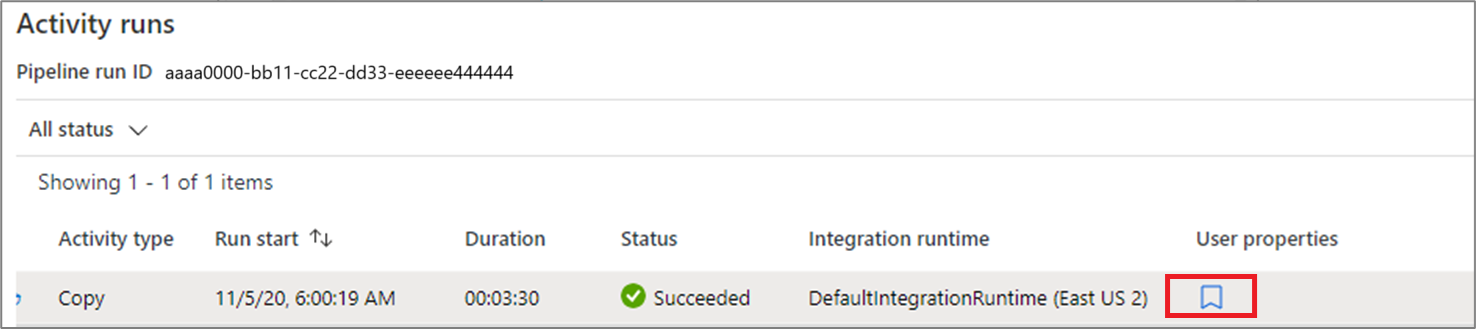
创建用户属性后,便可在监视列表视图中监视它们。
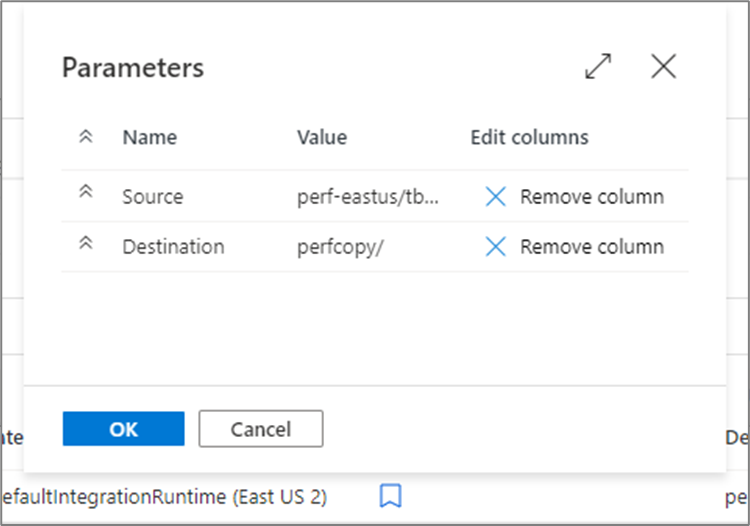
如果复制活动的源是表名称,则可以在活动运行的列表视图中,将源表名称作为一列进行监控。
重新运行管道和活动
容器活动的重新运行行为如下所示:
-
Wait- 活动将像以前一样运行。 -
Set Variable- 活动将像以前一样运行。 -
Filter- 活动将像以前一样运行。 -
Until活动会评估表达式,并会循环,直到条件得到满足。 可能仍会根据重新运行规则跳过内部活动。 -
Foreach活动将始终在其收到的项上循环。 可能仍会根据重新运行规则跳过内部活动。 -
If and switch- 始终会对条件进行评估。 将评估所有内部活动。 根据重新运行规则,内部活动仍可能被跳过,但执行管道等活动将重新运行。 -
Execute pipeline activity- 将触发子管道,但仍可能会根据重新运行规则跳过子管道中的所有活动。
如需从头重新运行已运行过的管道,请将鼠标悬停在特定的管道上,然后选择“重新运行”。 如果选择多个管道,可以使用“重新运行”按钮来运行所有这些管道。
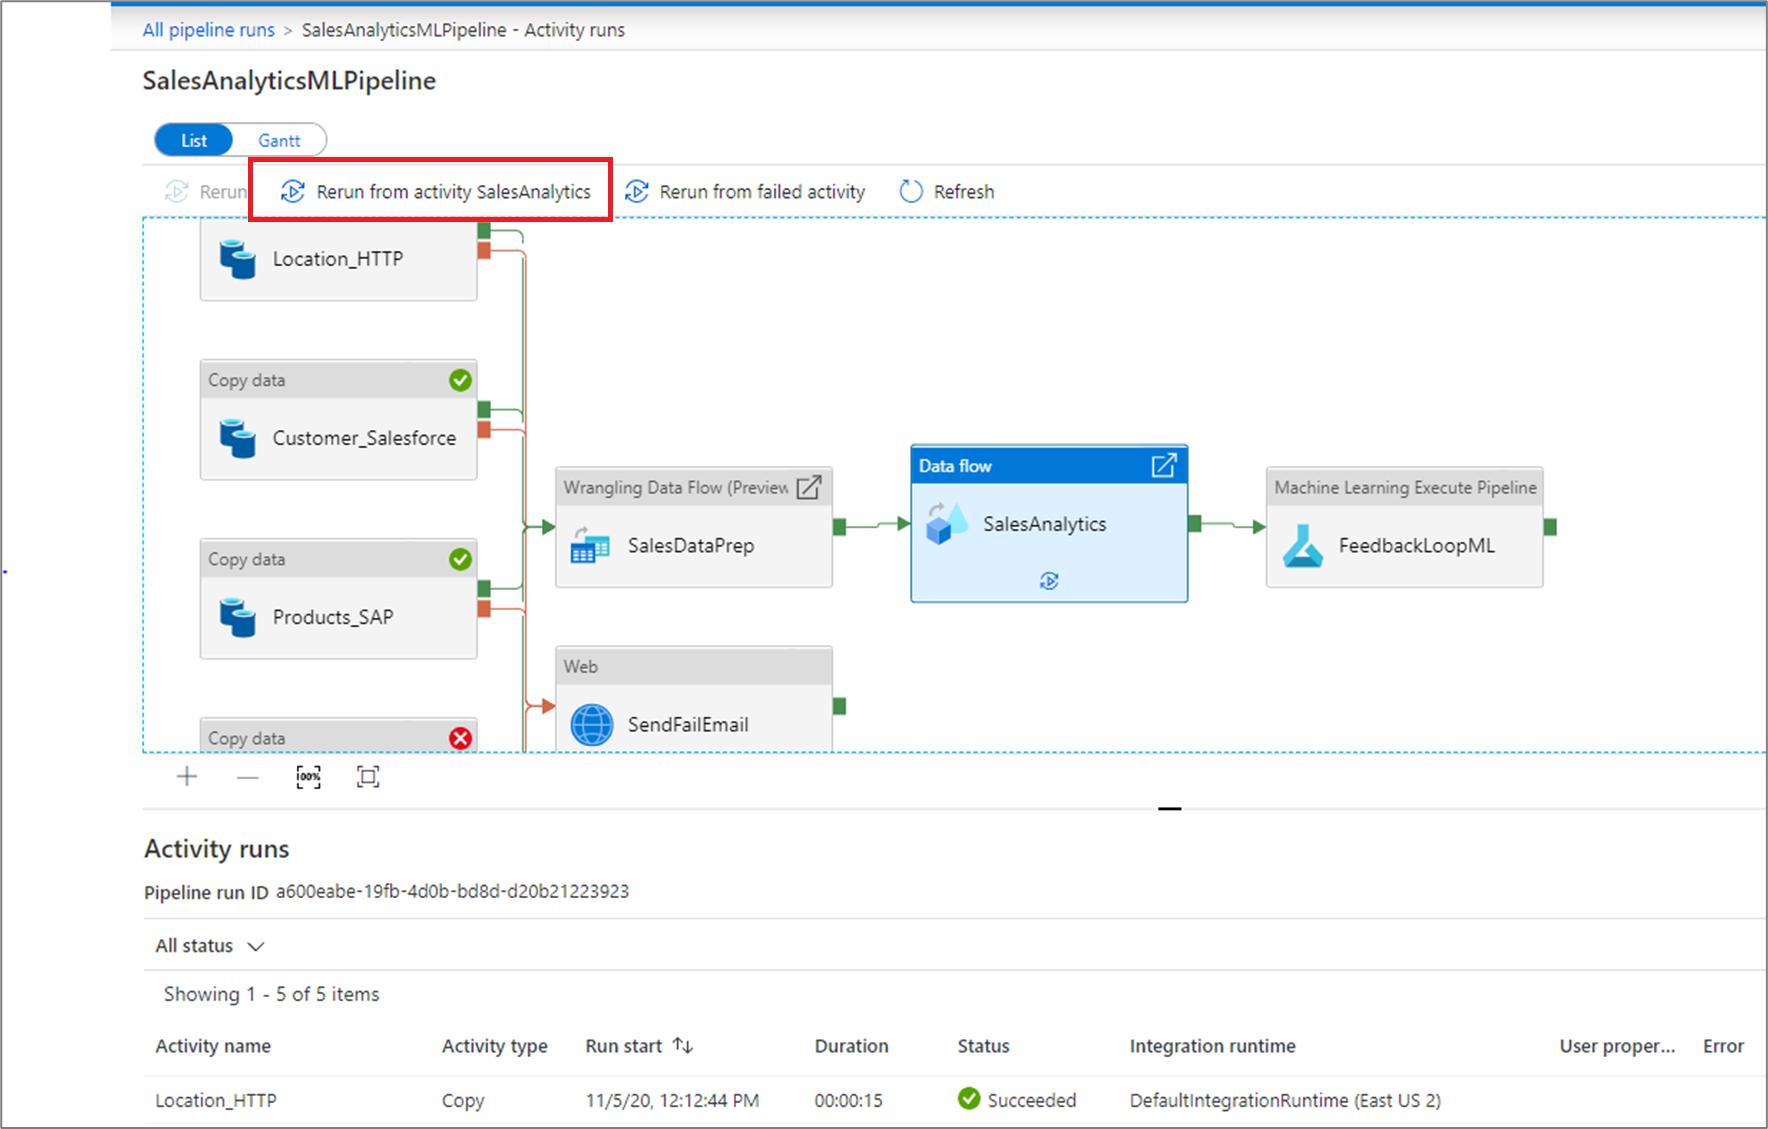
如果需要从某个特定点开始重新运行,可从活动运行视图中执行此操作。 选择需要作为开始位置的活动,并选择“从活动重新运行”。
还可重新运行管道并更改参数。 选择“新建参数”按钮可更改参数。
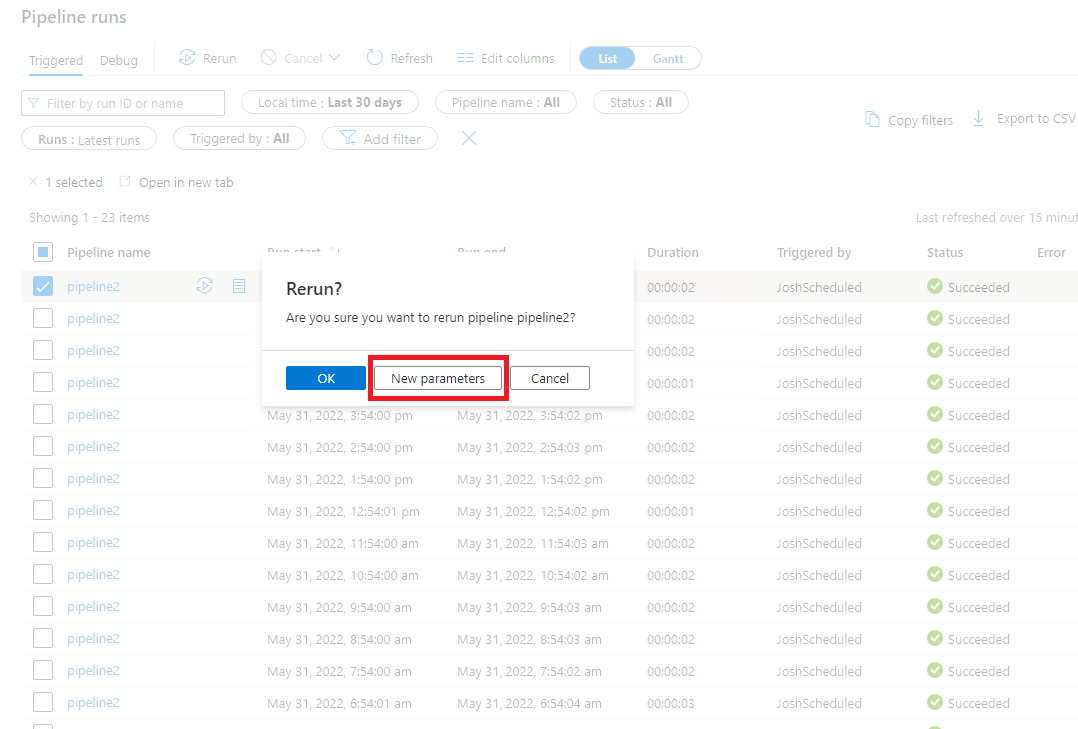
注意
使用新参数重新运行管道将被视为新的管道运行,因此不会显示在管道运行的重新运行分组下。
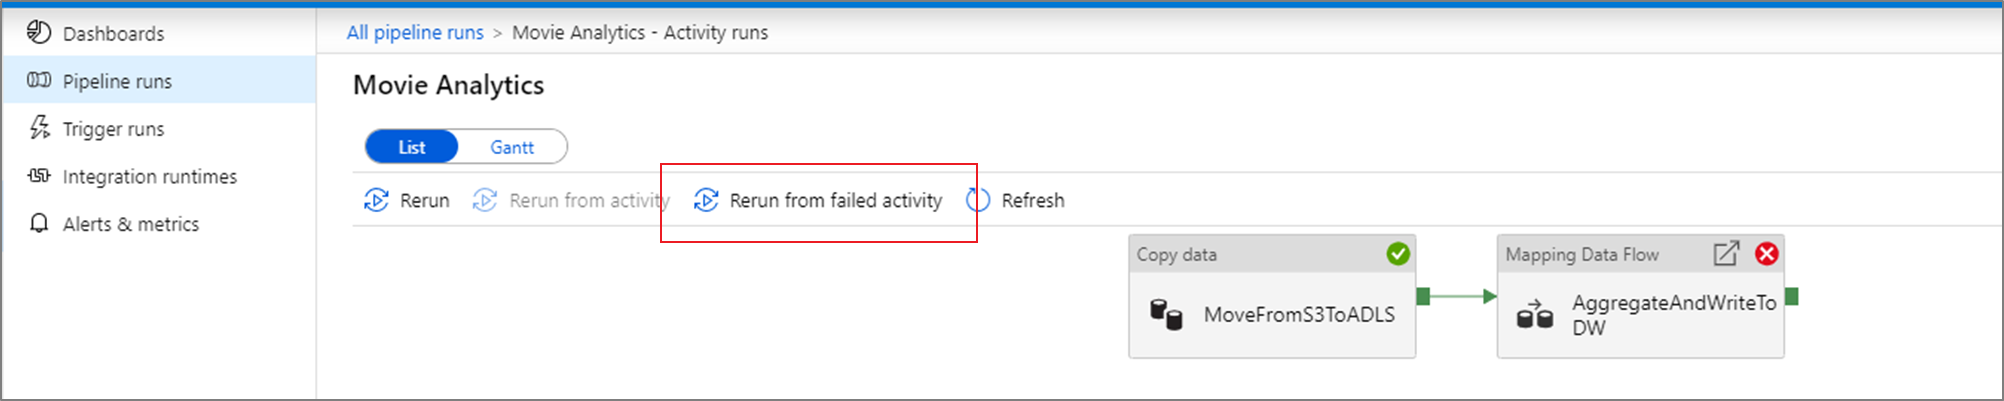
从失败的活动重新运行
如果某个活动失败、超时或被取消,则可以通过选择“从失败的活动重新运行”来从该失败的活动重新运行管道。
查看重新运行历史记录
可以查看列表视图中所有管道运行的重新运行历史记录。
还可以查看特定管道运行的重新运行历史记录。

监视消耗
通过单击管道运行旁边的消耗图标,可以查看运行消耗的资源。
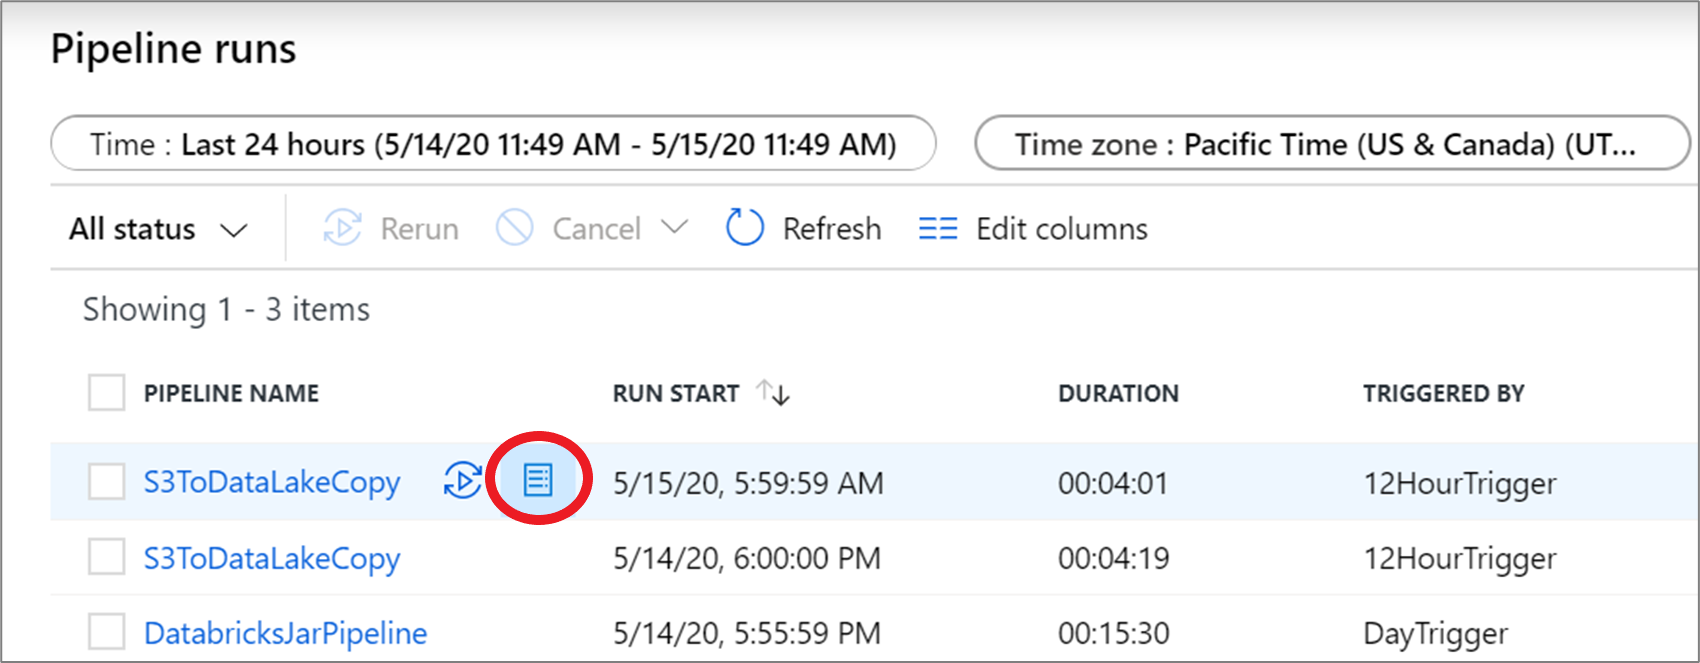
单击此图标会打开相应管道运行所使用的资源的消耗报告。
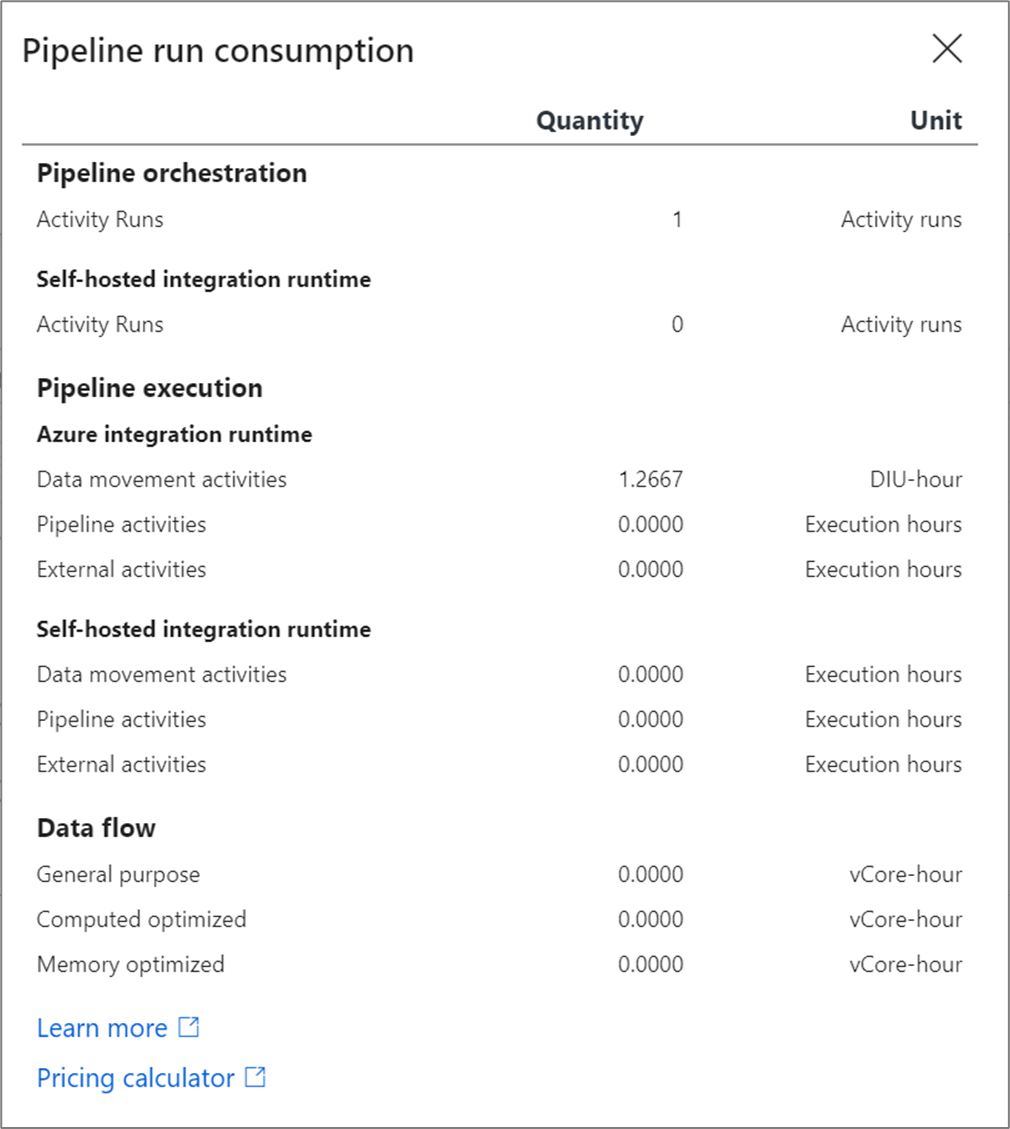
可以将这些值插入 Azure 定价计算器以估算管道运行的成本。
注意
定价计算器返回的这些值是估计值。 这不代表 Azure Data Factory 将向您收取的实际金额。
甘特图
甘特图是一种可用于查看某个时间范围内的运行历史记录的视图。 切换到甘特视图后,将会看到所有管道运行都按名称分组,并显示为与运行所用时间长度相关的条形。 还可以按已在管道上创建的注释/标记进行分组。 在活动运行级别也可使用甘特视图。
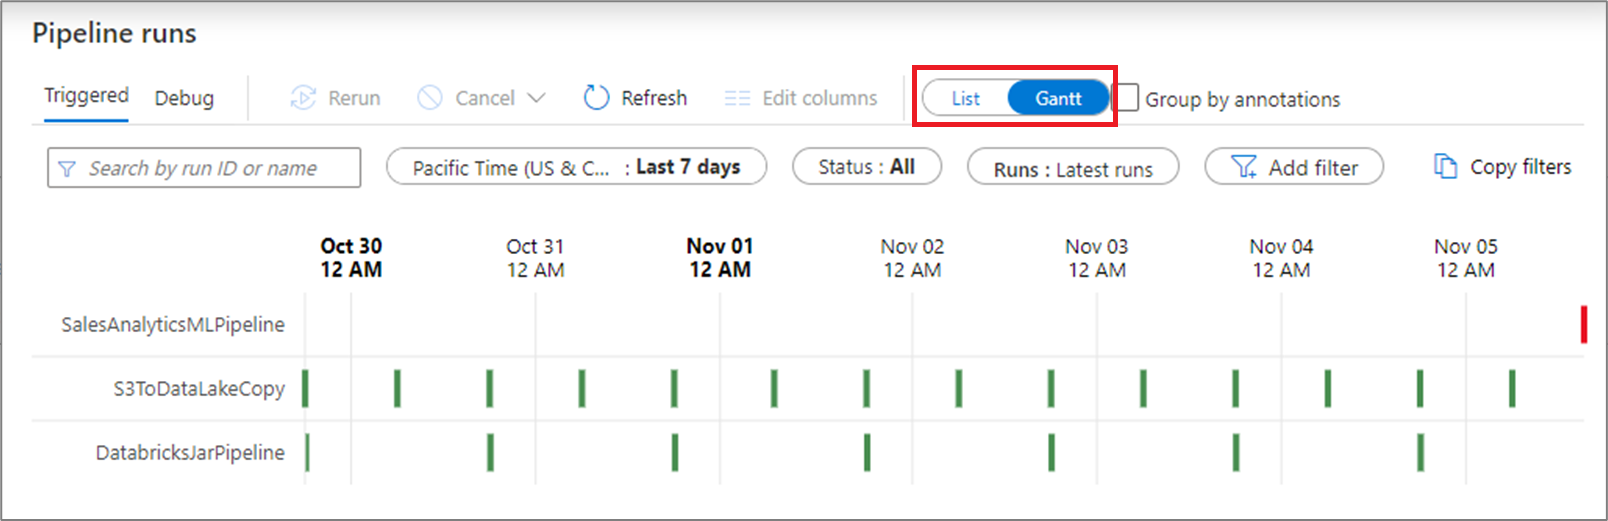
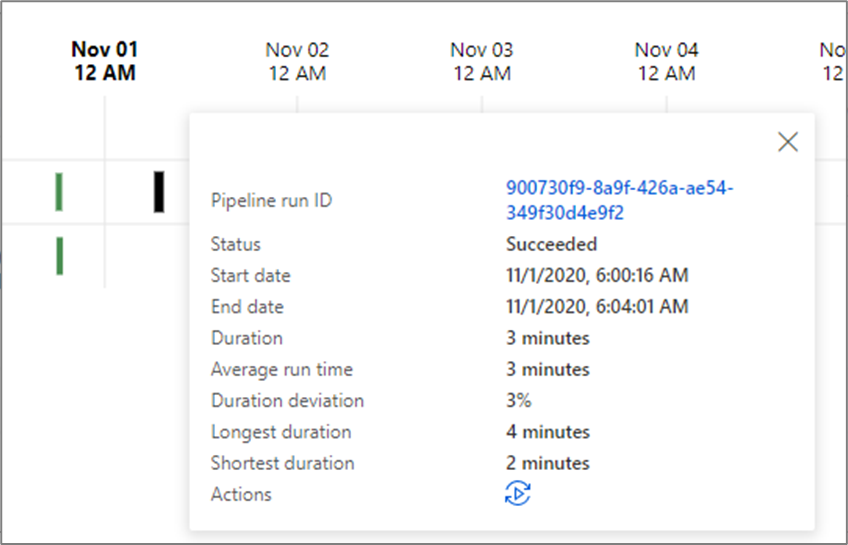
条形长度表示管道持续时间。 还可以选择条形来查看更多详细信息。
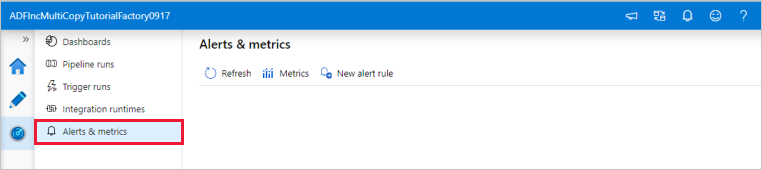
警报
可在数据工厂中发出有关受支持指标的警报。 在数据工厂监视页上选择“监视”“警报和指标”即可开始。>
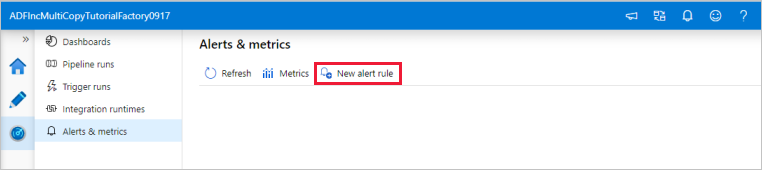
创建警报
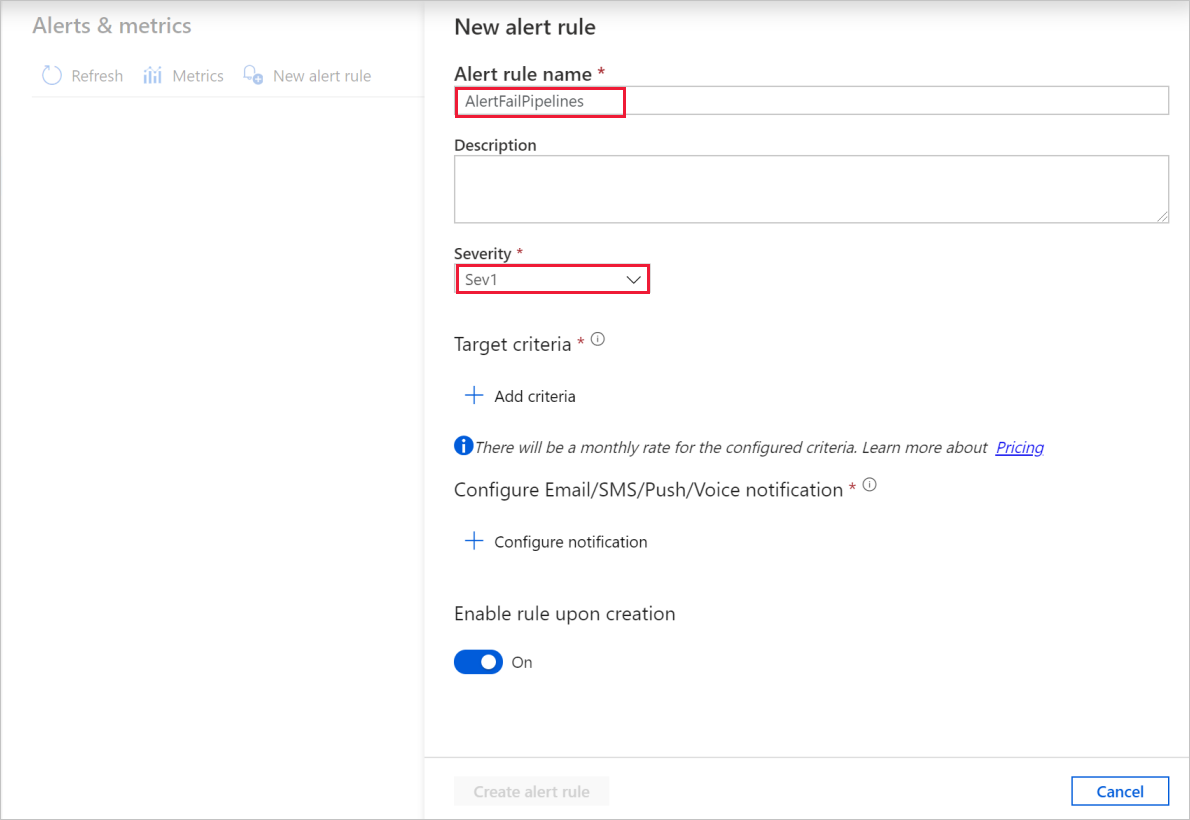
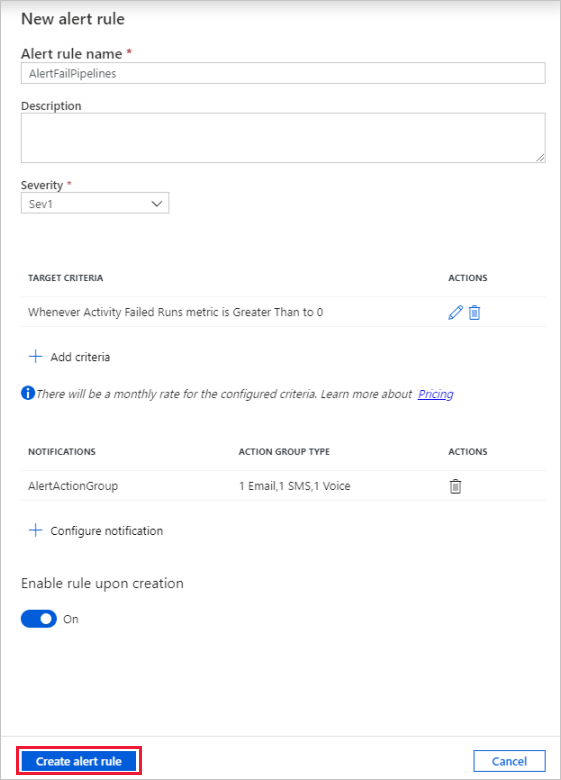
选择“新建警报规则”,以新建警报。
指定规则名称,然后选择警报严重性。
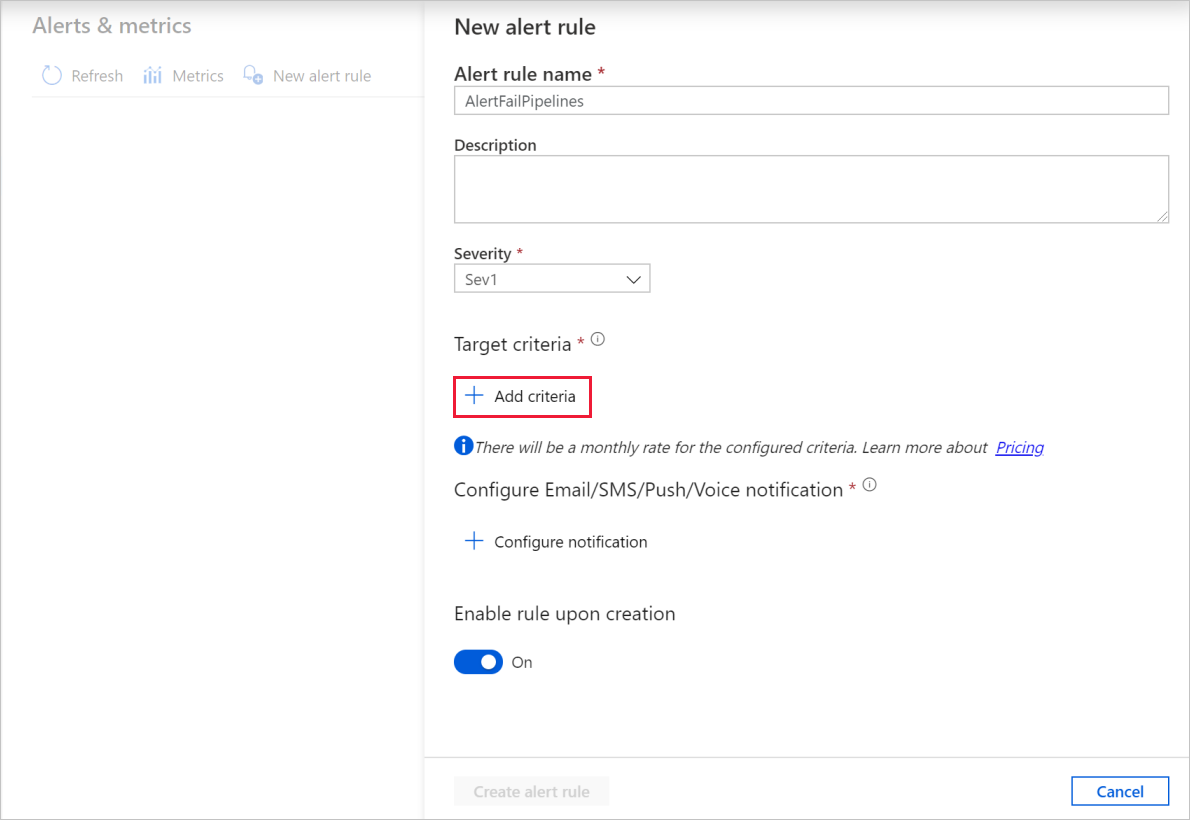
选择警报条件。
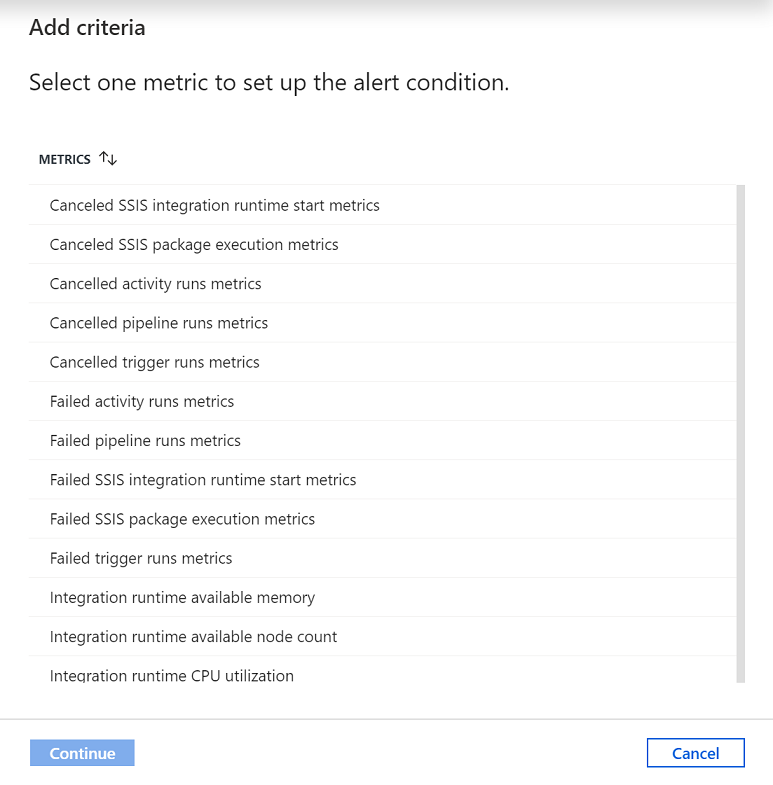
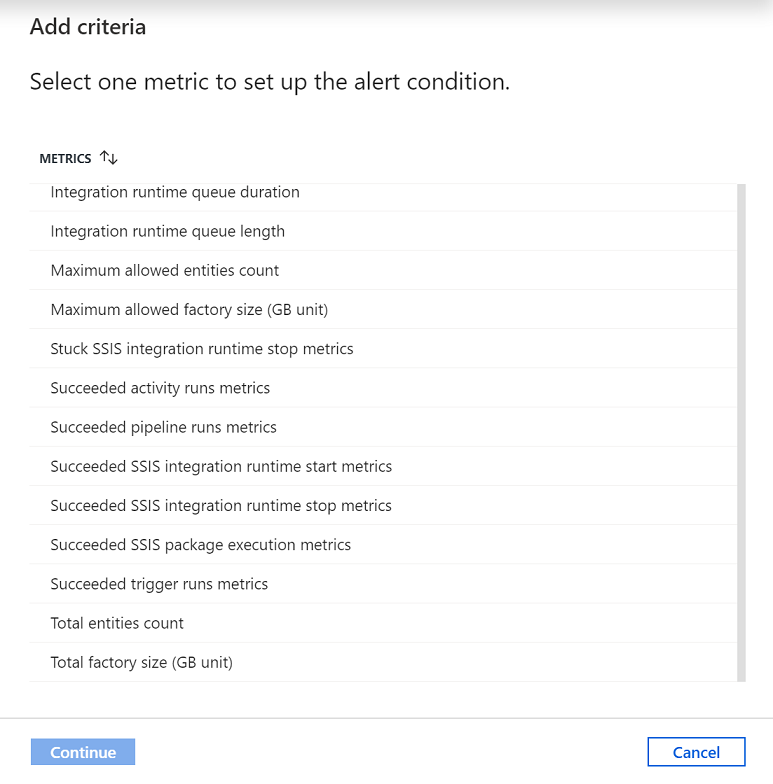
可以针对各种指标创建警报,包括 ADF 实体计数/大小、活动/管道/触发器运行、Integration Runtime (IR) CPU 使用率/内存/节点计数/队列,以及 SSIS 包执行和 SSIS IR 启动/停止操作。
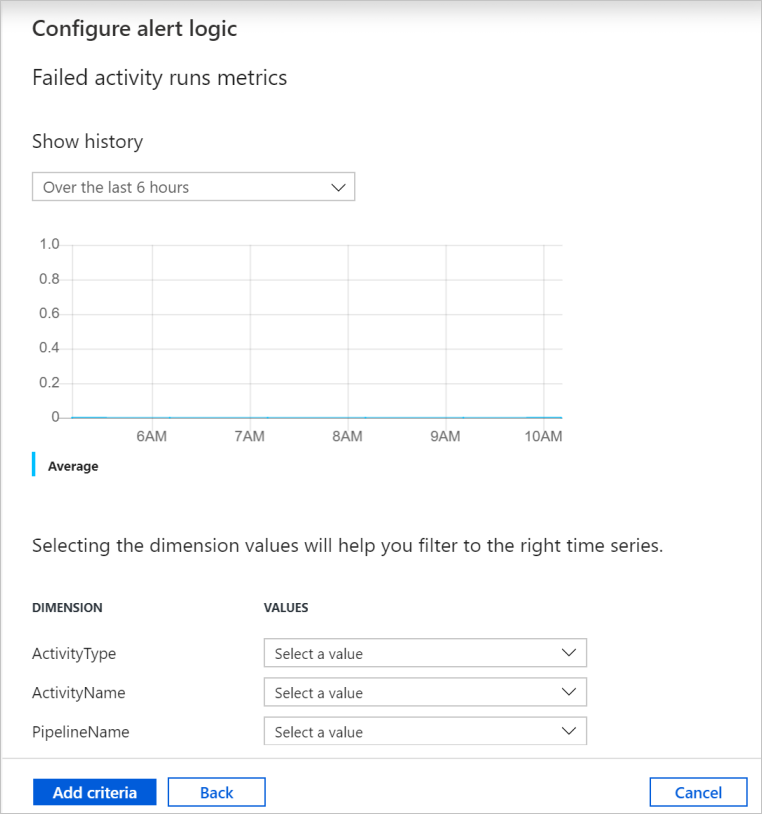
配置警报逻辑。 可以针对所选的指标为所有管道和对应的活动创建警报。 还可以选择特定的活动类型、活动名称、管道名称或故障类型。
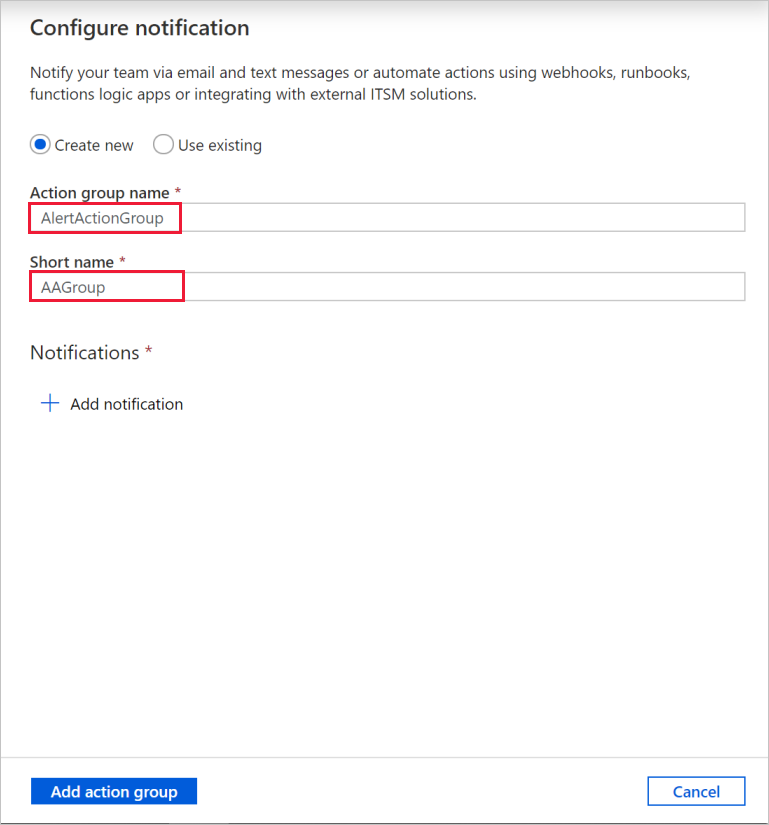
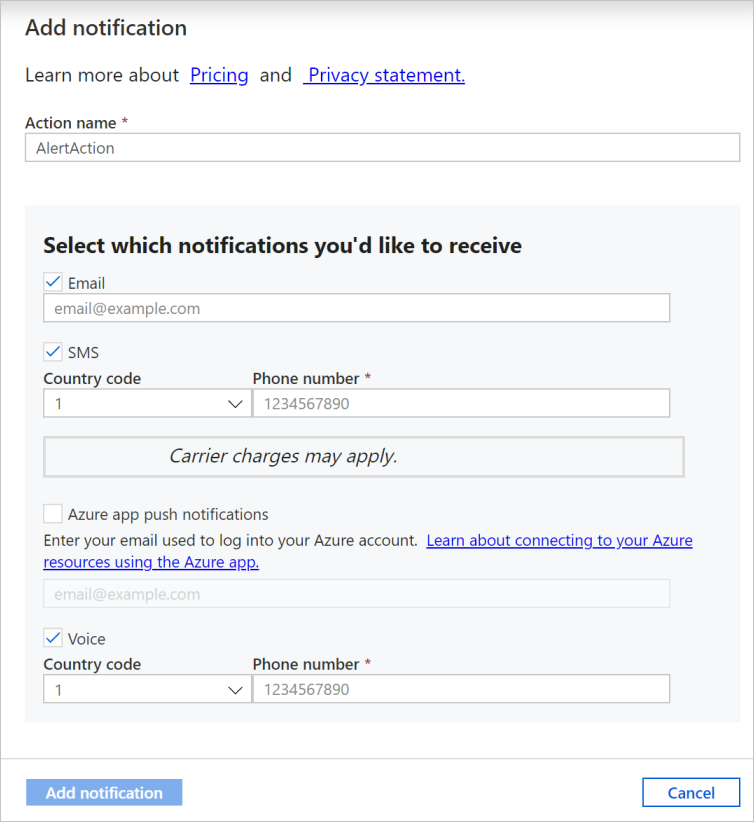
为警报配置电子邮件、短信、推送和语音通知。 为警报通知创建一个操作组,或选择现有的操作组。
创建警报规则。
相关内容
若要了解有关监视和管理管道的信息,请参阅以编程方式监视和管理管道一文。