Note
Access to this page requires authorization. You can try signing in or changing directories.
Access to this page requires authorization. You can try changing directories.
Azure Monitor Application Insights is an application performance monitoring (APM) feature of Azure Monitor. For supported scenarios, you can use OpenTelemetry (OTel), a vendor-neutral observability framework, to instrument your applications and collect telemetry data, then analyze that telemetry in Application Insights.
Application Insights Experiences
Application Insights supports OpenTelemetry (OTel) to collect telemetry data in a standardized format across platforms. Integration with Azure services allows for efficient monitoring and diagnostics, improving application observability and performance.
Investigate
- Application dashboard: An at-a-glance assessment of your application's health and performance.
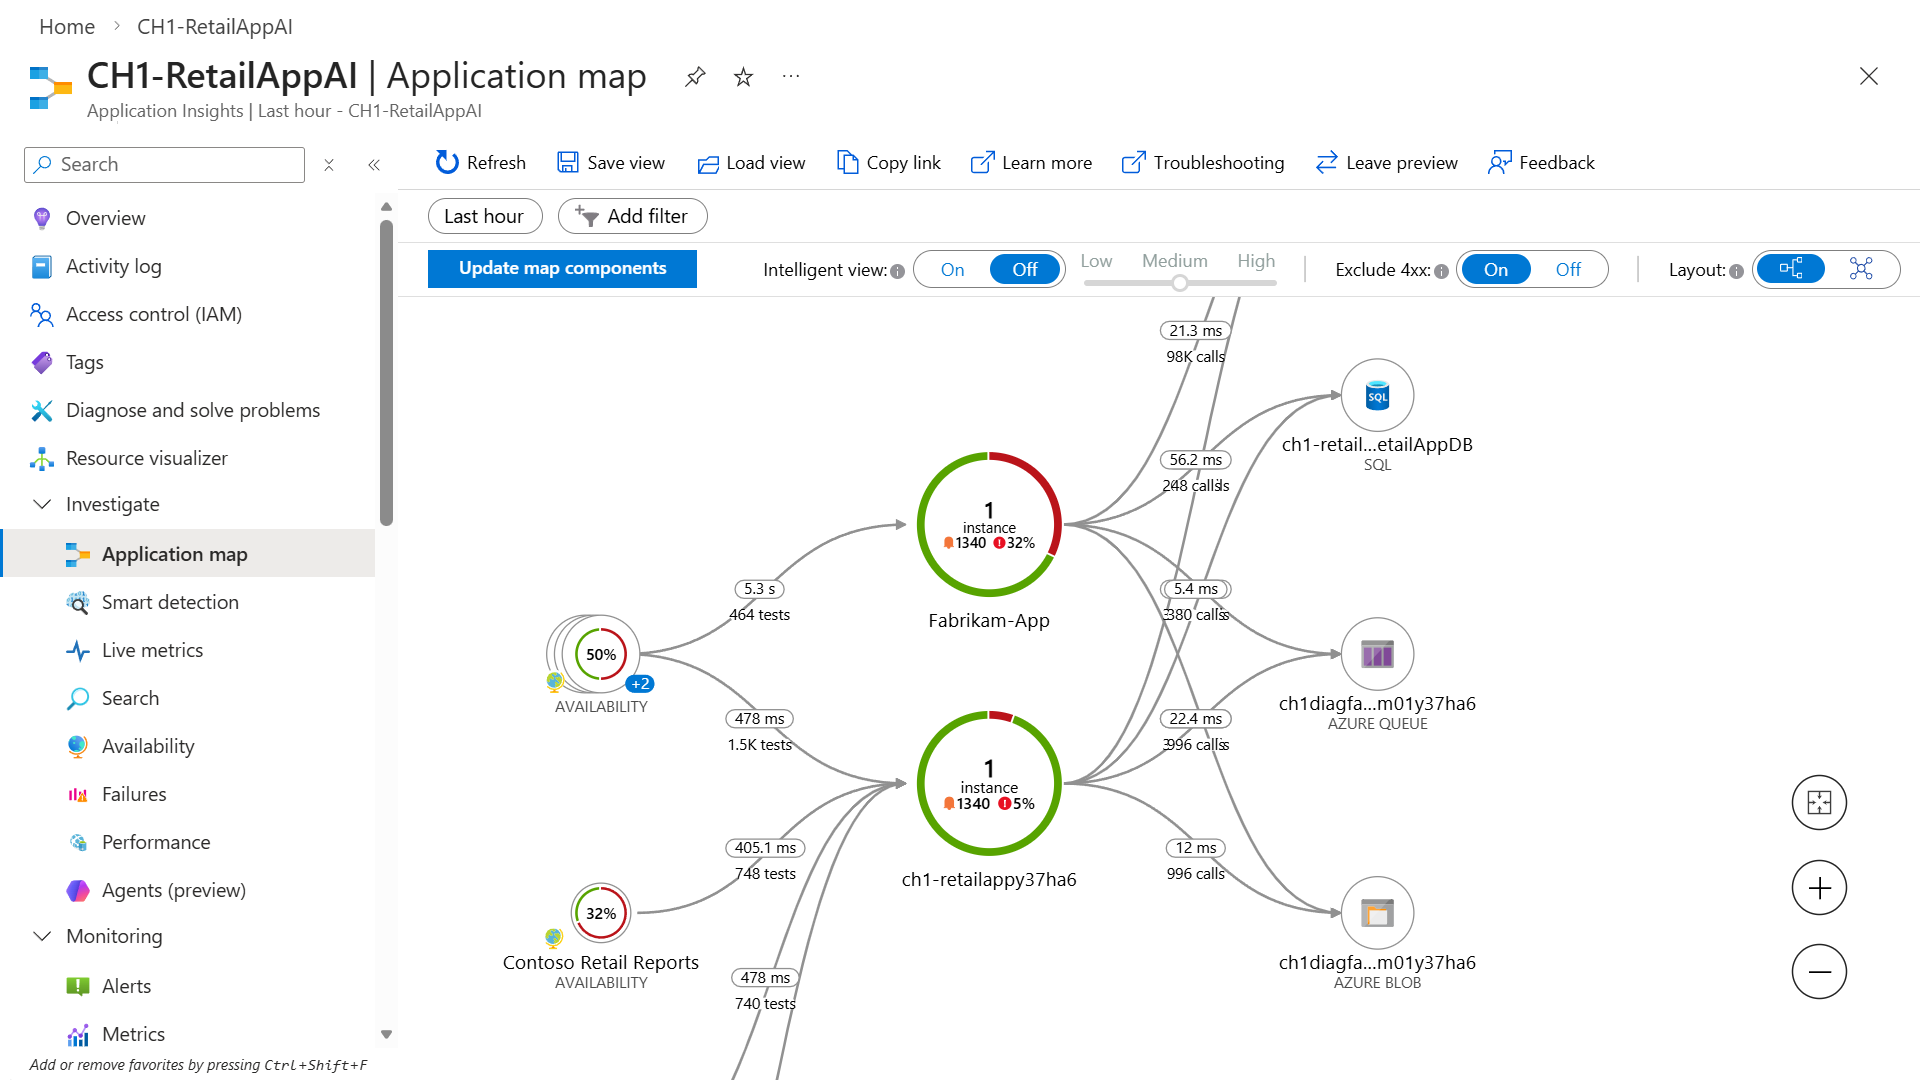
- Application map: A visual overview of application architecture and components' interactions.
- Live metrics: A real-time analytics dashboard for insight into application activity and performance.
- Search view: Trace and diagnose transactions to identify issues and optimize performance.
- Availability view: Proactively monitor and test the availability and responsiveness of application endpoints.
- Failures view: Identify and analyze failures in your application to minimize downtime.
- Performance view: Review application performance metrics and potential bottlenecks.
Monitoring
- Alerts: Monitor a wide range of aspects of your application and trigger various actions.
- Metrics: Dive deep into metrics data to understand usage patterns and trends.
- Diagnostic settings: Configure streaming export of platform logs and metrics to the destination of your choice.
- Logs: Retrieve, consolidate, and analyze all data collected into Azure Monitoring Logs.
- Workbooks: Create interactive reports and dashboards that visualize application monitoring data.
- SDK Stats: Visualize exporter success, dropped counts, retry counts, and drop reasons from Application Insights SDKs and agents.
Usage
- Users, sessions, and events: Determine when, where, and how users interact with your web app.
- Funnels: Analyze conversion rates to identify where users progress or drop off in the funnel.
- Flows: Visualize user paths on your site to identify high engagement areas and exit points.
- Cohorts: Group users by shared characteristics to simplify trend identification, segmentation, and performance troubleshooting.
Code analysis
- .NET Profiler: Capture, identify, and view performance traces for your application.
- Snapshot debugger: Automatically collect debug snapshots when exceptions occur in .NET application
Logic model
The logic model diagram visualizes components of Application Insights and how they interact.
Note
Firewall settings must be adjusted for data to reach ingestion endpoints. For more information, see Azure Monitor endpoint access and firewall configuration.
Getting started
This section covers getting started with OpenTelemetry-based data collection.
Entry points include:
- Server-side web apps
- Server-side web apps hosted on a Virtual Machine (VM)
- Client-side JavaScript apps
- Azure Functions
- AI Agents
Tip
- For most code-based server-side scenarios, the recommended setup uses the Azure Monitor OpenTelemetry Distro.
- Scenarios where OpenTelemetry isn't available are clearly identified.
Choose the tab that best matches your workload or hosting model. Each tab shows the recommended data-collection path for that scenario.
Use this path for server-side web apps that you instrument in code.
- Create an Application Insights resource.
- Get the resource's connection string.
- Add the OpenTelemetry Distro to your app.
- Configure the connection string.
Tip
Some platforms enable data collection automatically through autoinstrumentation. Switch to code-based instrumentation with the OpenTelemetry Distro if you want more configuration and extensibility options.
After you complete the setup for your scenario, run your app and wait a few minutes for telemetry to appear in Application Insights. Then explore Application Insights experiences.
Important
If you're still using Application Insights Classic API SDKs, see Migrate from Application Insights Classic API SDKs to Azure Monitor OpenTelemetry.
Other OpenTelemetry integrations on Azure
Use the following resources for Azure services, software development kits (SDKs), and tools that use OpenTelemetry:
- Azure SDK semantic conventions
- Java tracing in the Azure SDK
- Azure Cosmos DB SDK observability
- .NET observability with OpenTelemetry
- OpenTelemetry ingestion into Azure Data Explorer, Azure Synapse Data Explorer, and Real-Time Intelligence
- Azure Container Apps OpenTelemetry agent
- Aspire dashboard overview
Troubleshooting
For assistance with troubleshooting Application Insights, see our dedicated troubleshooting documentation.
Help and support
Azure technical support
For Azure support issues, open an Azure support ticket.
General Questions
Post general questions to the Azure Questions and Answers forum.
Coding Questions
Post coding questions to Stack Overflow by using an azure-application-insights tag.
Feedback Community
Leave product feedback for the engineering team in the Feedback Community.
