Note
Access to this page requires authorization. You can try signing in or changing directories.
Access to this page requires authorization. You can try changing directories.
Applies to: ✅ Azure Data Explorer
Calculates the session count based on the ID column over a timeline. The plugin is invoked with the evaluate operator.
Syntax
TabularExpression | evaluate session_count(IdColumn, TimelineColumn, Start, End, Bin, LookBackWindow [, dim1, dim2, ...])
Learn more about syntax conventions.
Parameters
| Name | Type | Required | Description |
|---|---|---|---|
| TabularExpression | string |
✔️ | The tabular expression that serves as input. |
| IdColumn | string |
✔️ | The name of the column with ID values that represents user activity. |
| TimelineColumn | string |
✔️ | The name of the column that represents the timeline. |
| Start | scalar | ✔️ | The start of the analysis period. |
| End | scalar | ✔️ | The end of the analysis period. |
| Bin | scalar | ✔️ | The session's analysis step period. |
| LookBackWindow | scalar | ✔️ | The session lookback period. If the ID from IdColumn appears in a time window within LookBackWindow, the session is considered to be an existing one. If the ID doesn't appear, then the session is considered to be new. |
| dim1, dim2, ... | string |
A list of the dimensions columns that slice the session count calculation. |
Returns
Returns a table that has the session count values for each timeline period and for each existing dimensions combination.
Output table schema is:
| TimelineColumn | dim1 | .. | dim_n | count_sessions |
|---|---|---|---|---|
| type: as of TimelineColumn | .. | .. | .. | long |
Examples
For this example, the data is deterministic, and we use a table with two columns:
Timeline: a running number from 1 to 10,000Id: ID of the user from 1 to 50
Id appears at the specific Timeline slot if it's a divider of Timeline (Timeline % Id == 0).
An event with Id==1 will appear at any Timeline slot, an event with Id==2 at every second Timeline slot, and so on.
Here are 20 lines of the data:
let _data = range Timeline from 1 to 10000 step 1
    | extend __key = 1
    | join kind=inner (range Id from 1 to 50 step 1 | extend __key=1) on __key
    | where Timeline % Id == 0
    | project Timeline, Id;
// Look on few lines of the data
_data
| order by Timeline asc, Id asc
| take 20
Output
| Timeline | Id |
|---|---|
| 1 | 1 |
| 2 | 1 |
| 2 | 2 |
| 3 | 1 |
| 3 | 3 |
| 4 | 1 |
| 4 | 2 |
| 4 | 4 |
| 5 | 1 |
| 5 | 5 |
| 6 | 1 |
| 6 | 2 |
| 6 | 3 |
| 6 | 6 |
| 7 | 1 |
| 7 | 7 |
| 8 | 1 |
| 8 | 2 |
| 8 | 4 |
| 8 | 8 |
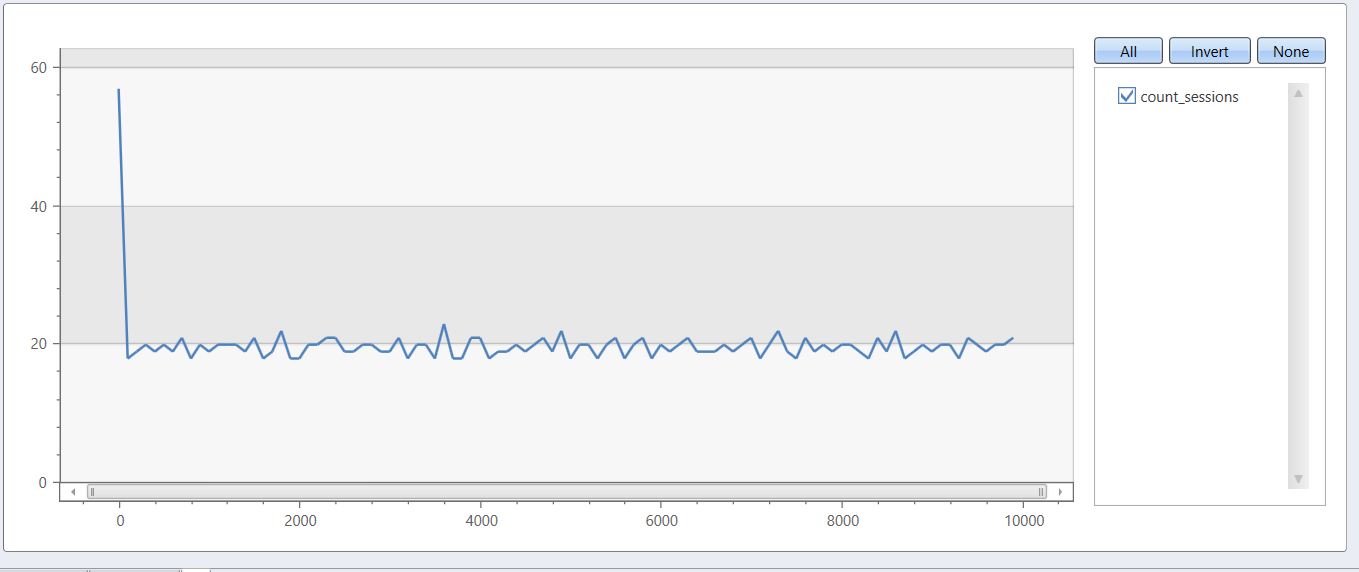
Let's define a session in next terms: session considered to be active as long as user (Id) appears at least once at a timeframe of 100 time slots, while session look-back window is 41 time slots.
The next query shows the count of active sessions according to the above definition.
let _data = range Timeline from 1 to 9999 step 1
    | extend __key = 1
    | join kind=inner (range Id from 1 to 50 step 1 | extend __key=1) on __key
    | where Timeline % Id == 0
    | project Timeline, Id;
// End of data definition
_data
| evaluate session_count(Id, Timeline, 1, 10000, 100, 41)
| render linechart