Note
Access to this page requires authorization. You can try signing in or changing directories.
Access to this page requires authorization. You can try changing directories.
Applies to: ✅ Azure Data Explorer
Calculates useful metrics that include distinct count values, distinct count of new values, retention rate, and churn rate. This plugin is different from activity_counts_metrics plugin in which every time window is compared to all previous time windows.
Syntax
T | evaluate activity_metrics(IdColumn, TimelineColumn, [Start, End,] Window [, dim1, dim2, ...])
Learn more about syntax conventions.
Parameters
| Name | Type | Required | Description |
|---|---|---|---|
| T | string |
✔️ | The input used to calculate activity metrics. |
| IdCoumn | string |
✔️ | The name of the column with ID values that represent user activity. |
| TimelineColumn | string |
✔️ | The name of the column that represents timeline. |
| Start | datetime |
✔️ | The analysis start period. |
| End | datetime |
✔️ | The analysis end period. |
| Step | decimal, datetime, or timespan | ✔️ | The analysis window period. This value may also be a string of week, month, or year, in which case all periods will be startofweek, startofmonth, or startofyear respectively. |
| dim1, dim2, ... | dynamic |
An array of the dimensions columns that slice the activity metrics calculation. |
Returns
The plugin returns a table with the distinct count values, distinct count of new values, retention rate, and churn rate for each timeline period for each existing dimensions combination.
Output table schema is:
| TimelineColumn | dcount_values | dcount_newvalues | retention_rate | churn_rate | dim1 | .. | dim_n |
|---|---|---|---|---|---|---|---|
| type: as of TimelineColumn | long |
long |
double | double | .. | .. | .. |
Notes
Retention Rate Definition
Retention Rate over a period is calculated as:
number of customers returned during the period / (divided by) number customers at the beginning of the period
where the # of customers returned during the period is defined as:
number of customers at end of period - (minus) number of new customers acquired during the period
Retention Rate can vary from 0.0 to 1.0
A higher score means a larger number of returning users.
Churn Rate Definition
Churn Rate over a period is calculated as:
number of customers lost in the period / (divided by) number of customers at the beginning of the period
where the # of customer lost in the period is defined as:
number of customers at the beginning of the period - (minus) number of returning customers during the period
Churn Rate can vary from 0.0 to 1.0
The higher score means the larger number of users are NOT returning to the service.
Churn vs. Retention Rate
The churn vs. retention Rate is derived from the definition of Churn Rate and Retention Rate. The following calculation is always true:
[
Retention Rate] = 100.0% - [Churn Rate]
Examples
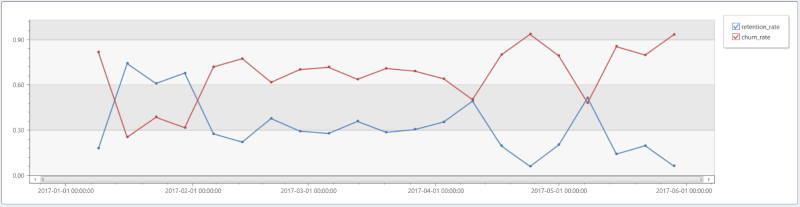
The following example calculates retention and churn rate for week-over-week window.
// Generate random data of user activities
let _start = datetime(2017-01-02);
let _end = datetime(2017-05-31);
range _day from _start to _end  step 1d
| extend d = tolong((_day - _start)/1d)
| extend r = rand()+1
| extend _users=range(tolong(d*50*r), tolong(d*50*r+200*r-1), 1)
| mv-expand id=_users to typeof(long) limit 1000000
//
| evaluate activity_metrics(['id'], _day, _start, _end, 7d)
| project _day, retention_rate, churn_rate
| render timechart
Output
| _day | retention_rate | churn_rate |
|---|---|---|
| 2017-01-02 00:00:00.0000000 | NaN | NaN |
| 2017-01-09 00:00:00.0000000 | 0.179910044977511 | 0.820089955022489 |
| 2017-01-16 00:00:00.0000000 | 0.744374437443744 | 0.255625562556256 |
| 2017-01-23 00:00:00.0000000 | 0.612096774193548 | 0.387903225806452 |
| 2017-01-30 00:00:00.0000000 | 0.681141439205955 | 0.318858560794045 |
| 2017-02-06 00:00:00.0000000 | 0.278145695364238 | 0.721854304635762 |
| 2017-02-13 00:00:00.0000000 | 0.223172628304821 | 0.776827371695179 |
| 2017-02-20 00:00:00.0000000 | 0.38 | 0.62 |
| 2017-02-27 00:00:00.0000000 | 0.295519001701645 | 0.704480998298355 |
| 2017-03-06 00:00:00.0000000 | 0.280387770320656 | 0.719612229679344 |
| 2017-03-13 00:00:00.0000000 | 0.360628154795289 | 0.639371845204711 |
| 2017-03-20 00:00:00.0000000 | 0.288008028098344 | 0.711991971901656 |
| 2017-03-27 00:00:00.0000000 | 0.306134969325153 | 0.693865030674847 |
| 2017-04-03 00:00:00.0000000 | 0.356866537717602 | 0.643133462282398 |
| 2017-04-10 00:00:00.0000000 | 0.495098039215686 | 0.504901960784314 |
| 2017-04-17 00:00:00.0000000 | 0.198296836982968 | 0.801703163017032 |
| 2017-04-24 00:00:00.0000000 | 0.0618811881188119 | 0.938118811881188 |
| 2017-05-01 00:00:00.0000000 | 0.204657727593507 | 0.795342272406493 |
| 2017-05-08 00:00:00.0000000 | 0.517391304347826 | 0.482608695652174 |
| 2017-05-15 00:00:00.0000000 | 0.143667296786389 | 0.856332703213611 |
| 2017-05-22 00:00:00.0000000 | 0.199122325836533 | 0.800877674163467 |
| 2017-05-29 00:00:00.0000000 | 0.063468992248062 | 0.936531007751938 |
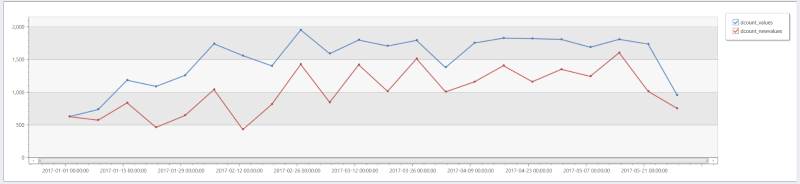
The following example calculates distinct values and 'new' values (IDs that didn't appear in previous time window) for week-over-week window.
// Generate random data of user activities
let _start = datetime(2017-01-02);
let _end = datetime(2017-05-31);
range _day from _start to _end  step 1d
| extend d = tolong((_day - _start)/1d)
| extend r = rand()+1
| extend _users=range(tolong(d*50*r), tolong(d*50*r+200*r-1), 1)
| mv-expand id=_users to typeof(long) limit 1000000
//
| evaluate activity_metrics(['id'], _day, _start, _end, 7d)
| project _day, dcount_values, dcount_newvalues
| render timechart
Output
| _day | dcount_values | dcount_newvalues |
|---|---|---|
| 2017-01-02 00:00:00.0000000 | 630 | 630 |
| 2017-01-09 00:00:00.0000000 | 738 | 575 |
| 2017-01-16 00:00:00.0000000 | 1187 | 841 |
| 2017-01-23 00:00:00.0000000 | 1092 | 465 |
| 2017-01-30 00:00:00.0000000 | 1261 | 647 |
| 2017-02-06 00:00:00.0000000 | 1744 | 1043 |
| 2017-02-13 00:00:00.0000000 | 1563 | 432 |
| 2017-02-20 00:00:00.0000000 | 1406 | 818 |
| 2017-02-27 00:00:00.0000000 | 1956 | 1429 |
| 2017-03-06 00:00:00.0000000 | 1593 | 848 |
| 2017-03-13 00:00:00.0000000 | 1801 | 1423 |
| 2017-03-20 00:00:00.0000000 | 1710 | 1017 |
| 2017-03-27 00:00:00.0000000 | 1796 | 1516 |
| 2017-04-03 00:00:00.0000000 | 1381 | 1008 |
| 2017-04-10 00:00:00.0000000 | 1756 | 1162 |
| 2017-04-17 00:00:00.0000000 | 1831 | 1409 |
| 2017-04-24 00:00:00.0000000 | 1823 | 1164 |
| 2017-05-01 00:00:00.0000000 | 1811 | 1353 |
| 2017-05-08 00:00:00.0000000 | 1691 | 1246 |
| 2017-05-15 00:00:00.0000000 | 1812 | 1608 |
| 2017-05-22 00:00:00.0000000 | 1740 | 1017 |
| 2017-05-29 00:00:00.0000000 | 960 | 756 |