本文阐述了用户在使用 Service Fabric 进行监视和诊断时遇到的常见情况。 所阐述的情况涵盖了 Service Fabric 的全部 3 层:应用程序、群集和基础结构。 每个解决方案均使用 Application Insights 和 Azure Monitor 日志(Azure 监视工具)来处理每种情况。 每个解决方案中的步骤都向用户介绍了如何在 Service Fabric 环境中使用 Application Insights 和 Azure Monitor 日志。
警告
不再支持用于 Service Fabric SDK 的 Application Insights。
先决条件和建议
本文中的解决方案将使用以下工具。 建议对这些工具进行设置和配置:
- Application Insights 与 Service Fabric
- 在群集上启用 Azure 诊断
- 设置 Log Analytics 工作区
- 用于跟踪性能计数器的 Log Analytics 代理
如何在应用程序中查看未经处理的异常?
导航到应用程序配置的 Application Insights 资源。
选择左上角的“搜索”。 然后选择下一个面板上的筛选器。
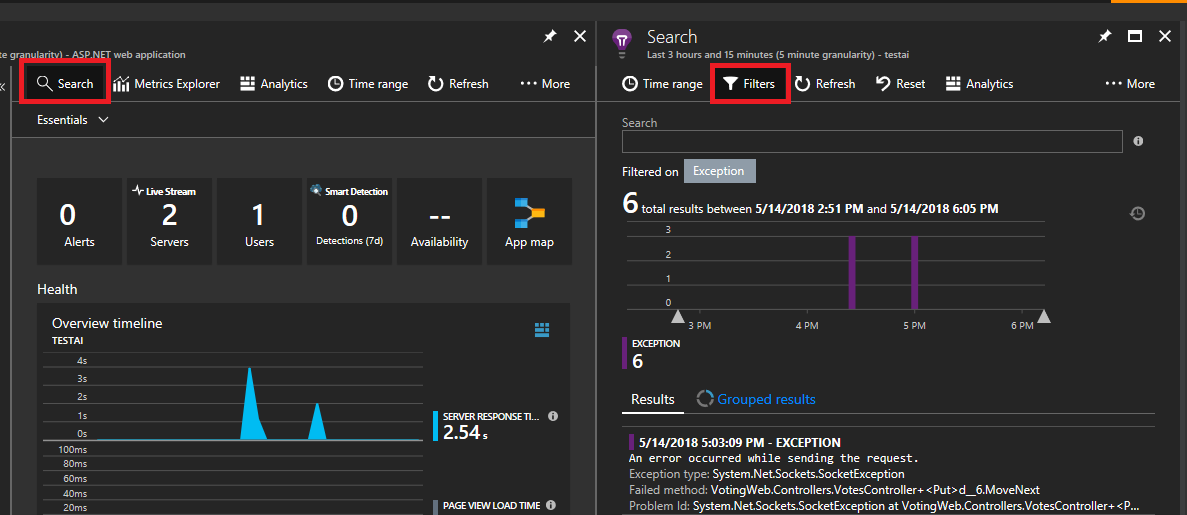
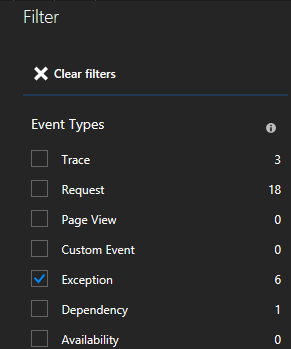
你将看到很多类型的事件(跟踪、请求、自定义事件)。 选择“异常”作为筛选器。
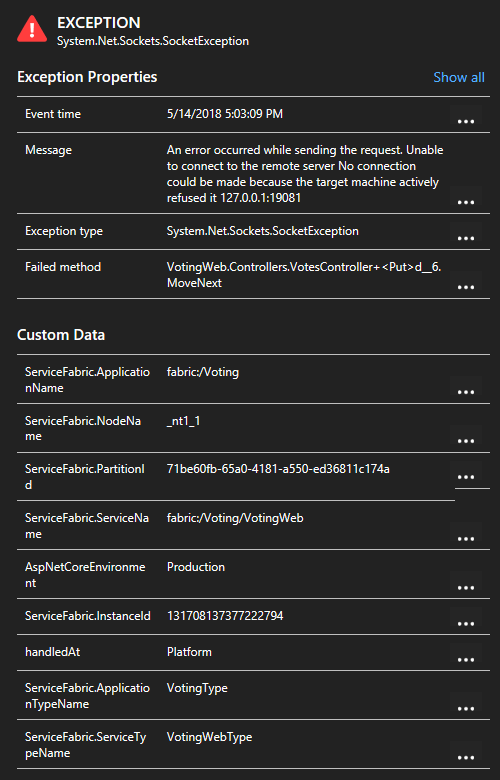
如果使用的是 Service Fabric Application Insights SDK,则单击列表中的异常可以查看更多详细信息,包括服务上下文。
如何查看服务中使用的 HTTP 调用?
在同一个 Application Insights 资源中,可以筛选“请求”而不是异常,并查看发出的所有请求
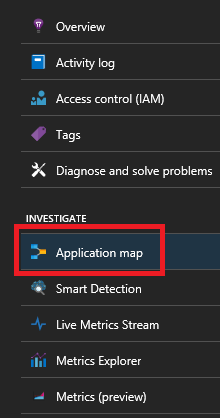
如果使用的是 Service Fabric Application Insights SDK,则可以看到彼此连接的服务的可视形式以及成功和失败请求的数量。 选择左侧的“应用程序映射”
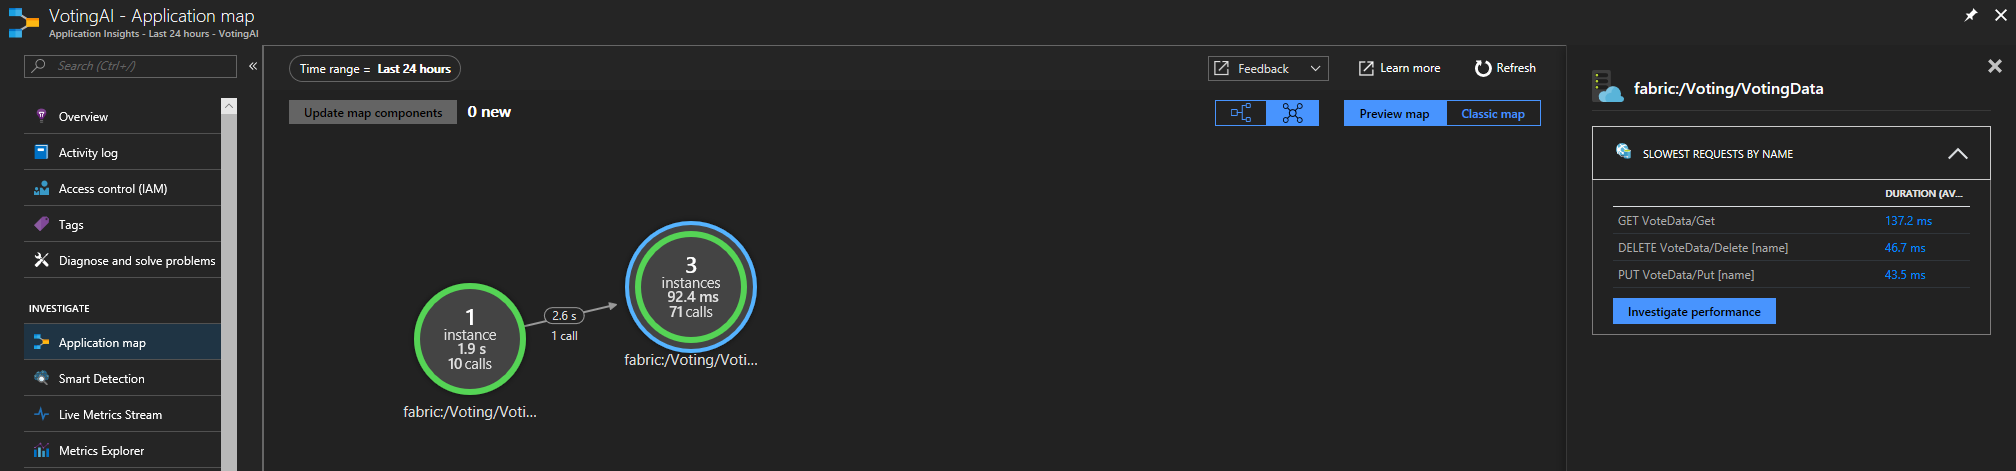
有关应用程序映射的详细信息,请访问应用程序映射文档
如何在节点出现故障时创建警报
节点事件由 Service Fabric 群集跟踪。 导航到名为 ServiceFabric(NameofResourceGroup) 的 Service Fabric 分析解决方案资源
选择标题为“摘要”的边栏选项卡底部的图表
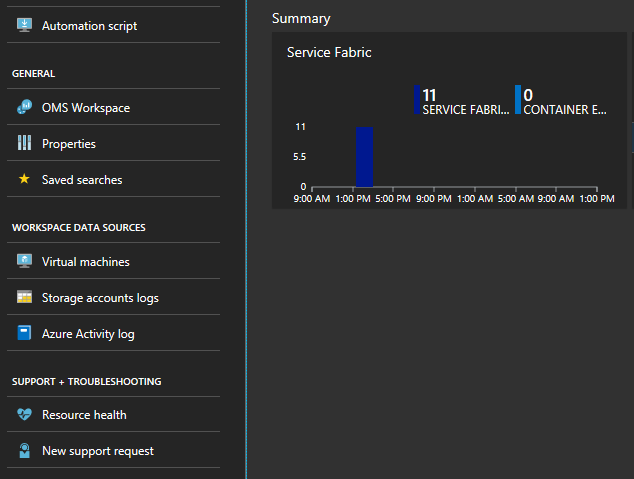
此处有许多图表和磁贴,上面显示了各种指标。 选择其中一个图表,它会带你进入“日志搜索”。 在这里,你可以查询任何群集事件或性能计数器。
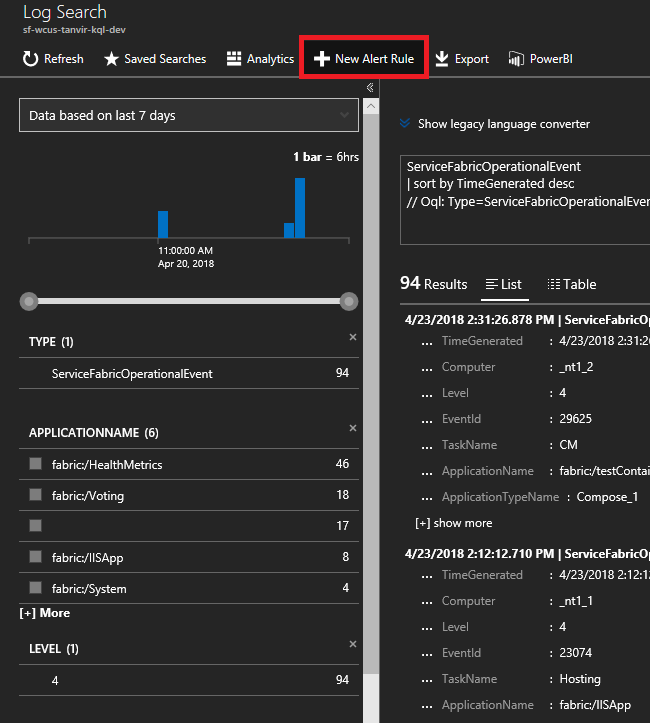
输入以下查询。 这些事件 ID 位于节点事件参考中
ServiceFabricOperationalEvent
| where EventID >= 25622 and EventID <= 25626
选择顶部的“新建警报规则”,现在只要发生基于此查询的事件,就会通过所选通信方式收到警报。
怎样才能收到应用程序升级回滚警报?
在与之前相同的“日志搜索”窗口中,针对升级回滚输入以下查询。 这些事件 ID 位于应用程序事件参考下方
ServiceFabricOperationalEvent
| where EventID == 29623 or EventID == 29624
单击顶部的“新建警报规则”,现在只要发生基于此查询的事件,你就会收到警报。
如何监视性能计数器?
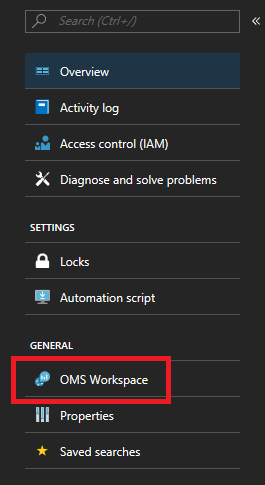
向群集添加 Log Analytics 代理后,需要添加要跟踪的特定性能计数器。导航到门户中的 Log Analytics 工作区页面(工作区选项卡位于解决方案页面的左侧菜单中)。
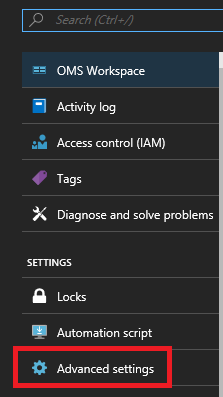
进入工作区的页面后,在同一左侧菜单中选择“高级设置”。
选择“数据”>“Windows 性能计数器”(对于 Linux 计算机,则为“数据”>“Linux 性能计数器”),开始通过 Log Analytics 代理从节点收集特定计数器。 以下是要添加的计数器的格式示例
.NET CLR Memory(<ProcessNameHere>)\\# Total committed BytesProcessor(_Total)\\% Processor Time在快速入门中,VotingData 和 VotingWeb 是所用进程名称,因此,将按以下格式跟踪这些计数器
.NET CLR Memory(VotingData)\\# Total committed Bytes.NET CLR Memory(VotingWeb)\\# Total committed Bytes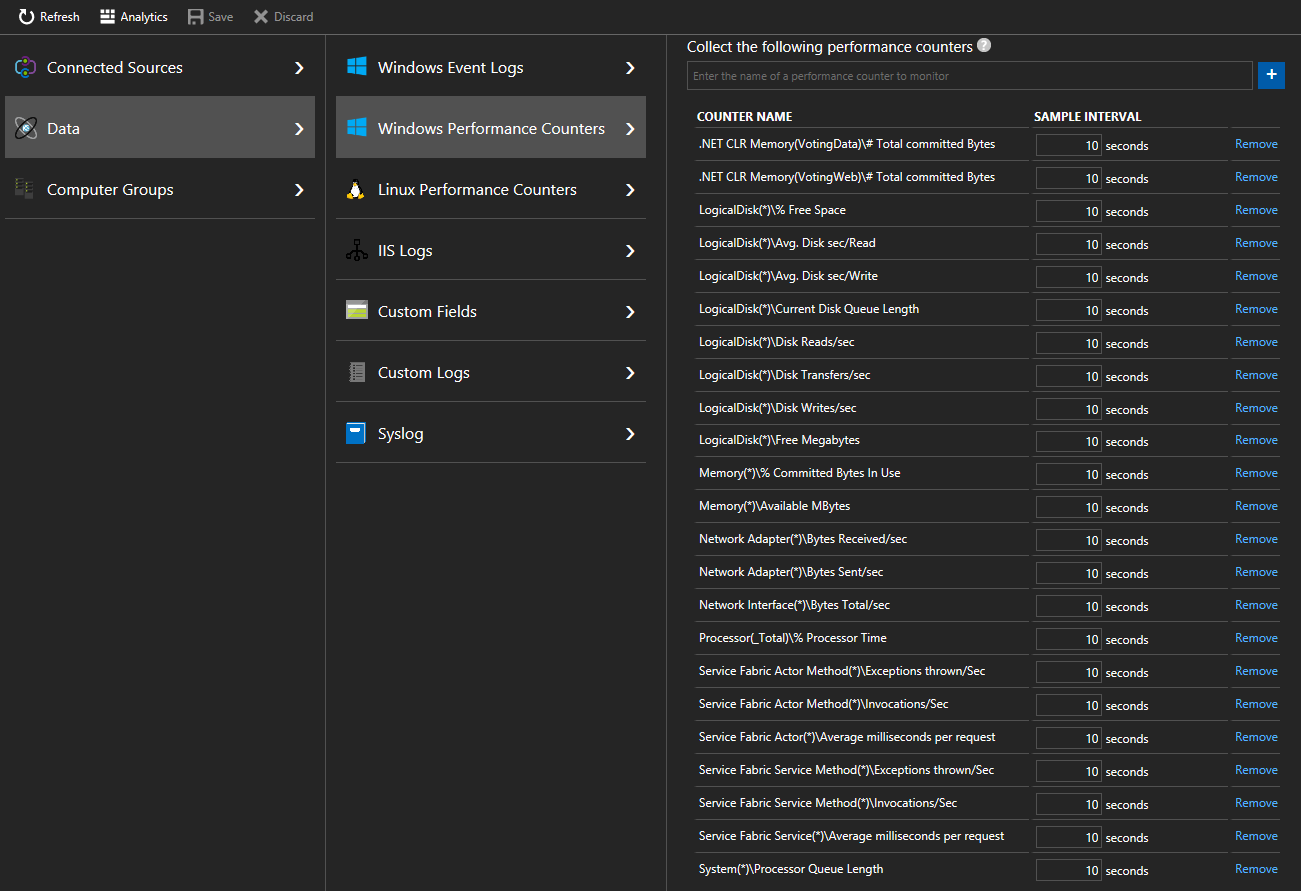
这使你可以查看基础结构处理工作负载的方式,并根据资源利用率设置相关警报。 例如, 如果处理器总利用率超过 90% 或低于 5%,则可能需要设置警报。 用于此项的计数器名称为“处理器时间百分比”。可以通过为以下查询创建警报规则来执行此操作:
Perf | where CounterName == "% Processor Time" and InstanceName == "_Total" | where CounterValue >= 90 or CounterValue <= 5.
如何跟踪 Reliable Services 和 Actors 的性能?
若要跟踪应用程序中 Reliable Services 或 Actors 的性能,还应收集 Service Fabric Actor、Actor Method、Service 和 Service Method 计数器。 下面是要收集的 Reliable Service 和 Actor 性能计数器的示例
注意
Log Analytics 代理当前无法收集 Service Fabric 性能计数器,但其他诊断解决方案可以收集这些计数器
Service Fabric Service(*)\\Average milliseconds per requestService Fabric Service Method(*)\\Invocations/SecService Fabric Actor(*)\\Average milliseconds per requestService Fabric Actor Method(*)\\Invocations/Sec
在 Reliable Services 和 Actors 上查看这些链接可获取性能计数器的完整列表
后续步骤
- 查找常见代码包激活错误
- 在 AI 中设置警报以获取有关性能或使用情况的通知
- Application Insights 中的智能检测针对发送给 AI 的遥测进行主动分析,向你警告潜在的性能问题
- 详细了解有助于进行检测和诊断的 Azure Monitor 日志警报。
- 对于本地群集,Azure Monitor 日志提供了一个网关(HTTP 正向代理),可用于向 Azure Monitor 日志发送数据。 有关更多信息,请参阅使用 Log Analytics 网关将无法访问 Internet 的计算机连接到 Azure Monitor 日志
- 掌握 Azure Monitor 日志中提供的日志搜索和查询功能
- 有关 Azure Monitor 日志及其功能的更详细概述,请参阅什么是 Azure Monitor 日志?