在任何云环境中开发、测试和部署工作负荷时,监视和诊断至关重要。 本教程是一个系列的第二部分,介绍如何使用事件、性能计数器和运行状况报告来监视和诊断 Service Fabric 群集。 有关更多信息,请阅读有关群集监视和基础结构监视的概述。
在本教程中,你将了解如何执行以下操作:
- 查看 Service Fabric 事件
- 查询群集事件的 EventStore API
- 监视基础架构/收集性能计数器
- 查看群集运行状况报告
在此系列教程中,你会学习如何:
- 使用模板在 Azure 上创建安全 Windows 群集
- 监视群集
- 缩小或扩大群集
- 升级群集的运行时
- 删除群集
注意
建议使用 Azure Az PowerShell 模块与 Azure 交互。 若要开始,请参阅安装 Azure PowerShell。 若要了解如何迁移到 Az PowerShell 模块,请参阅 将 Azure PowerShell 从 AzureRM 迁移到 Az。
先决条件
在开始学习本教程之前:
- 如果没有 Azure 订阅,请创建一个试用版订阅
- 安装 Azure PowerShell 或 Azure CLI。
- 创建安全的 Windows 群集
- 为群集设置诊断集合
- 在群集中启用 EventStore 服务
- 配置群集的 Azure Monitor 日志和 Log Analytics 代理
使用 Azure Monitor 日志查看 Service Fabric 事件
Azure Monitor 日志收集并分析云中托管的应用程序和服务的遥测,并提供分析工具以帮助最大限度地提高其可用性和性能。 你可以在 Azure Monitor 日志中运行查询,以获取见解并解决群集中发生的问题。
要访问 Service Fabric 分析解决方案,请转至 Azure 门户,然后选择你在其中创建 Service Fabric 分析解决方案的资源组。
选择资源“ServiceFabric(mysfomsworkspace)”。
在“概述”中,将看到每个已启用解决方案的图形磁贴,包括 Service Fabric 的磁贴。 选择“Service Fabric”图形,继续使用 Service Fabric 分析解决方案。
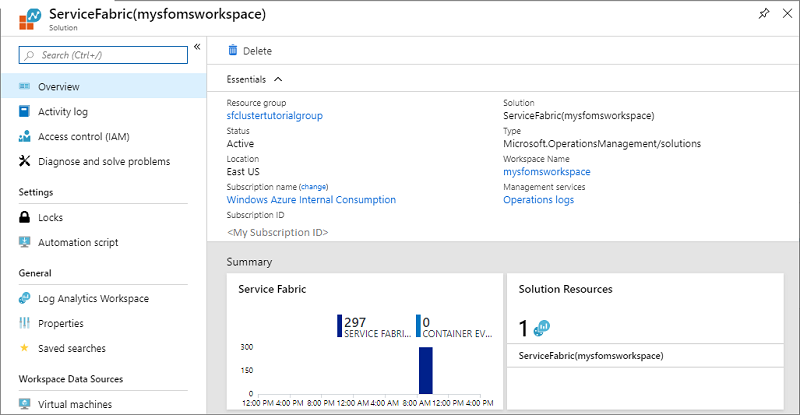
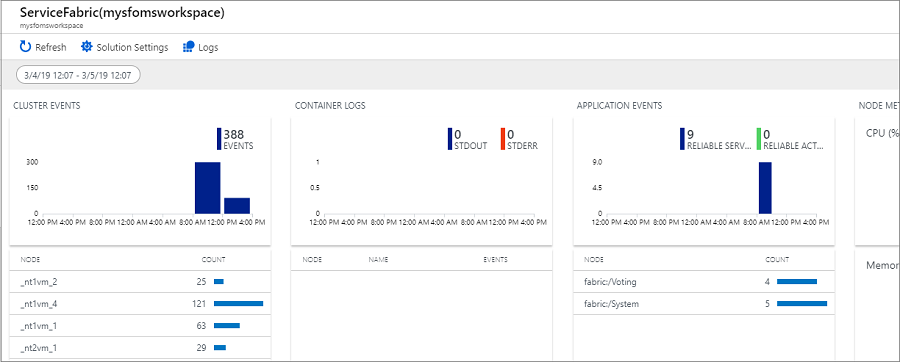
下图是 Service Fabric 分析解决方案的主页。 此主页提供了群集中正在发生的事件的快照视图。
如果创建群集时启用了诊断,则可以看到以下对象的事件:
注意
除了现成的 Service Fabric 事件之外,可以通过更新诊断扩展的配置来收集更详细的系统事件。
查看 Service Fabric 事件,包括对节点执行的操作
在“Service Fabric 分析”页上,单击“群集事件”对应的图形。 将显示已收集的所有系统事件的日志。 该查询使用 Kusto 查询语言,你可以修改该语言以优化要查找的内容。 例如,若要查找针对群集中的节点执行的所有操作,可以使用以下查询。 在操作通道事件参考中可以找到下面使用的事件 ID。
ServiceFabricOperationalEvent
| where EventId < 25627 and EventId > 25619
Kusto 查询语言非常强大。 以下是一些其他有用的查询。
通过将查询保存为具有别名 ServiceFabricEvent 的函数,将 ServiceFabricEvent 查找表创建为用户定义的函数:
let ServiceFabricEvent = datatable(EventId: int, EventName: string)
[
    ...
    18603, 'NodeUpOperational',
    18604, 'NodeDownOperational',
    ...
];
ServiceFabricEvent
返回过去一小时内记录的操作事件:
ServiceFabricOperationalEvent
| where TimeGenerated > ago(1h)
| join kind=leftouter ServiceFabricEvent on EventId
| project EventId, EventName, TaskName, Computer, ApplicationName, EventMessage, TimeGenerated
| sort by TimeGenerated
使用 EventId == 18604 和 EventName ==‘NodeDownOperational’ 返回操作事件:
ServiceFabricOperationalEvent
| where EventId == 18604
| project EventId, EventName = 'NodeDownOperational', TaskName, Computer, EventMessage, TimeGenerated
| sort by TimeGenerated
使用 EventId == 18604 和 EventName ==‘NodeUpOperational’ 返回操作事件:
ServiceFabricOperationalEvent
| where EventId == 18603
| project EventId, EventName = 'NodeUpOperational', TaskName, Computer, EventMessage, TimeGenerated
| sort by TimeGenerated
使用 HealthState == 3(错误)返回运行状况报告,并从 EventMessage 字段中提取更多属性:
ServiceFabricOperationalEvent
| join kind=leftouter ServiceFabricEvent on EventId
| extend HealthStateId = extract(@"HealthState=(\S+) ", 1, EventMessage, typeof(int))
| where TaskName == 'HM' and HealthStateId == 3
| extend SourceId = extract(@"SourceId=(\S+) ", 1, EventMessage, typeof(string)),
         Property = extract(@"Property=(\S+) ", 1, EventMessage, typeof(string)),
         HealthState = case(HealthStateId == 0, 'Invalid', HealthStateId == 1, 'Ok', HealthStateId == 2, 'Warning', HealthStateId == 3, 'Error', 'Unknown'),
         TTL = extract(@"TTL=(\S+) ", 1, EventMessage, typeof(string)),
         SequenceNumber = extract(@"SequenceNumber=(\S+) ", 1, EventMessage, typeof(string)),
         Description = extract(@"Description='([\S\s, ^']+)' ", 1, EventMessage, typeof(string)),
         RemoveWhenExpired = extract(@"RemoveWhenExpired=(\S+) ", 1, EventMessage, typeof(bool)),
         SourceUTCTimestamp = extract(@"SourceUTCTimestamp=(\S+)", 1, EventMessage, typeof(datetime)),
         ApplicationName = extract(@"ApplicationName=(\S+) ", 1, EventMessage, typeof(string)),
         ServiceManifest = extract(@"ServiceManifest=(\S+) ", 1, EventMessage, typeof(string)),
         InstanceId = extract(@"InstanceId=(\S+) ", 1, EventMessage, typeof(string)),
         ServicePackageActivationId = extract(@"ServicePackageActivationId=(\S+) ", 1, EventMessage, typeof(string)),
         NodeName = extract(@"NodeName=(\S+) ", 1, EventMessage, typeof(string)),
         Partition = extract(@"Partition=(\S+) ", 1, EventMessage, typeof(string)),
         StatelessInstance = extract(@"StatelessInstance=(\S+) ", 1, EventMessage, typeof(string)),
         StatefulReplica = extract(@"StatefulReplica=(\S+) ", 1, EventMessage, typeof(string))
使用 EventId != 17523 返回事件的时间表:
ServiceFabricOperationalEvent
| join kind=leftouter ServiceFabricEvent on EventId
| where EventId != 17523
| summarize Count = count() by Timestamp = bin(TimeGenerated, 1h), strcat(tostring(EventId), " - ", case(EventName != "", EventName, "Unknown"))
| render timechart
获取与特定服务和节点聚合的 Service Fabric 操作事件:
ServiceFabricOperationalEvent
| where ApplicationName  != "" and ServiceName != ""
| summarize AggregatedValue = count() by ApplicationName, ServiceName, Computer
使用跨资源查询通过 EventId/EventName 呈现 Service Fabric 事件的计数:
app('PlunkoServiceFabricCluster').traces
| where customDimensions.ProviderName == 'Microsoft-ServiceFabric'
| extend EventId = toint(customDimensions.EventId), TaskName = tostring(customDimensions.TaskName)
| where EventId != 17523
| join kind=leftouter ServiceFabricEvent on EventId
| extend EventName = case(EventName != '', EventName, 'Undocumented')
| summarize ["Event Count"]= count() by bin(timestamp, 30m), EventName = strcat(tostring(EventId), " - ", EventName)
| render timechart
查看 Service Fabric 应用程序事件
可以查看在群集上部署的 Reliable Services 和 Reliable Actors 应用程序的事件。 在“Service Fabric 分析”页上,选择“应用程序事件”对应的图形。
运行以下查询以查看 Reliable Services 应用程序的事件:
ServiceFabricReliableServiceEvent
| sort by TimeGenerated desc
可以看到服务 runasync 在启动和完成时(通常发生在部署和升级时)的不同事件。
此外,还可以使用 ServiceName == "fabric:/Watchdog/WatchdogService" 查找 Reliable Services 的事件:
ServiceFabricReliableServiceEvent
| where ServiceName == "fabric:/Watchdog/WatchdogService"
| project TimeGenerated, EventMessage
| order by TimeGenerated desc
可以类似的方式查看 Reliable Actors 事件:
ServiceFabricReliableActorEvent
| sort by TimeGenerated desc
要为可靠的 Reliable Actor 配置更详细的事件,可以在群集模板中更改诊断扩展配置中的 scheduledTransferKeywordFilter。
Reliable Actors 事件参考中提供了这些参数值的详细信息。
"EtwEventSourceProviderConfiguration": [
                {
                    "provider": "Microsoft-ServiceFabric-Actors",
                    "scheduledTransferKeywordFilter": "1",
                    "scheduledTransferPeriod": "PT5M",
                    "DefaultEvents": {
                    "eventDestination": "ServiceFabricReliableActorEventTable"
                    }
                },
使用 Azure Monitor 日志查看性能计数器
要查看性能计数器,请转至 Azure 门户以及你在其中创建 Service Fabric 分析解决方案的资源组。
选择资源“ServiceFabric (mysfomsworkspace)”,并选择“Log Analytics 工作区”,然后选择“高级设置” 。
选择“数据”,然后选择“Windows 性能计数器”。 此时会显示一个可以选择启用的默认计数器列表,此外还可以设置收集间隔。 还可以添加要收集的其他性能计数器。 此参考文章中介绍了正确的格式。 单击“保存”,然后选择“确定”。
关闭“高级设置”边栏选项卡,然后在“常规”标题下选择“工作区摘要” 。 对于启用的每个解决方案,都有一个图形磁贴,包括 Service Fabric 的磁贴。 选择“Service Fabric”图形,继续使用 Service Fabric 分析解决方案。
操作通道和 Reliable Services 事件也有图形磁贴。 选定计数器的流入数据图形表示形式显示在“节点指标”下。
选择“容器指标”图形可了解更多详细信息。 还可以使用 Kusto 查询语言,像查询群集事件一样查询性能计数器数据,以及基于节点、性能计数器名称和值进行筛选。
查询 EventStore 服务
EventStore 服务提供了在给定时间点了解群集或工作负载状态的方法。 EventStore 是有状态 Service Fabric 服务,它维护群集中的事件。 事件通过 Service Fabric Explorer、REST 和 API 公开。 EventStore 直接查询群集以获取群集中任何实体的诊断数据,要查看 EventStore 中可用事件的完整列表,请参阅 Service Fabric 事件。
可以使用 Service Fabric 客户端库以编程方式查询 EventStore API。
以下是通过 GetClusterEventListAsync 函数查询 2018-04-03T18:00:00Z 和 2018-04-04T18:00:00Z 之间的所有群集事件的示例请求。
var sfhttpClient = ServiceFabricClientFactory.Create(clusterUrl, settings);

var clstrEvents = sfhttpClient.EventsStore.GetClusterEventListAsync(
    "2018-04-03T18:00:00Z",
    "2018-04-04T18:00:00Z")
    .GetAwaiter()
    .GetResult()
    .ToList();
以下是另一个查询 2018 年 9 月群集运行状况和所有节点事件并将其打印出来的示例。
const int timeoutSecs = 60;
var clusterUrl = new Uri(@"http://localhost:19080"); // This example is for a Local cluster
var sfhttpClient = ServiceFabricClientFactory.Create(clusterUrl);

var clusterHealth = sfhttpClient.Cluster.GetClusterHealthAsync().GetAwaiter().GetResult();
Console.WriteLine("Cluster Health: {0}", clusterHealth.AggregatedHealthState.Value.ToString());

Console.WriteLine("Querying for node events...");
var nodesEvents = sfhttpClient.EventsStore.GetNodesEventListAsync(
    "2018-09-01T00:00:00Z",
    "2018-09-30T23:59:59Z",
    timeoutSecs,
    "NodeDown,NodeUp")
    .GetAwaiter()
    .GetResult()
    .ToList();
Console.WriteLine("Result Count: {0}", nodesEvents.Count());

foreach (var nodeEvent in nodesEvents)
{
    Console.Write("Node event happened at {0}, Node name: {1} ", nodeEvent.TimeStamp, nodeEvent.NodeName);
    if (nodeEvent is NodeDownEvent)
    {
        var nodeDownEvent = nodeEvent as NodeDownEvent;
        Console.WriteLine("(Node is down, and it was last up at {0})", nodeDownEvent.LastNodeUpAt);
    }
    else if (nodeEvent is NodeUpEvent)
    {
        var nodeUpEvent = nodeEvent as NodeUpEvent;
        Console.WriteLine("(Node is up, and it was last down at {0})", nodeUpEvent.LastNodeDownAt);
    }
}
监视群集运行状况
Service Fabric 引入了一种具有运行状况实体的运行状况模型,系统组件和监视器可以在其上报告它们监视的本地状况。 运行状况存储聚合所有运行状况数据以确定实体是否正常运行。
群集会自动被系统组件发送的运行状况报告所填充。 从使用系统运行状况报告进行故障排除了解更多信息。
Service Fabric 为每个支持的实体类型提供运行状况查询。 可以通过 API(使用 FabricClient.HealthManager 上的方法)、PowerShell cmdlet 和 REST 访问它们。 这些查询返回有关实体的完整运行状况信息:聚合运行状况、实体运行状况事件、子运行状况(在适用时)、不正常评估(实体不正常时)以及子集运行状况统计信息(在适用时)。
获取群集运行状况
Get-ServiceFabricClusterHealth cmdlet 返回群集实体的运行状况,并包含应用程序和节点(群集的子项)的运行状况。 首先使用 Connect-ServiceFabricCluster cmdlet 连接到群集。
群集的状态是 11 个节点、系统应用程序和 fabric:/Voting 按所述进行配置。
以下示例使用默认运行状况策略获取群集运行状况。 11 个节点处于正常状态,但是群集的聚合运行状况是错误,因为 fabric:/Voting 应用程序处于错误状态。 请注意不正常评估如何提供触发聚合运行状况的详细条件。
Get-ServiceFabricClusterHealth

AggregatedHealthState   : Error
UnhealthyEvaluations    :
                          100% (1/1) applications are unhealthy. The evaluation tolerates 0% unhealthy applications.

                          Application 'fabric:/Voting' is in Error.

                          	33% (1/3) deployed applications are unhealthy. The evaluation tolerates 0% unhealthy deployed applications.

                          	Deployed application on node '_nt2vm_3' is in Error.

                          		50% (1/2) deployed service packages are unhealthy.

                          		Service package for manifest 'VotingWebPkg' and service package activation ID '8723eb73-9b83-406b-9de3-172142ba15f3' is in Error.

                          			'System.Hosting' reported Error for property 'CodePackageActivation:Code:SetupEntryPoint:131959376195593305'.
                          			There was an error during CodePackage activation.The service host terminated with exit code:1

NodeHealthStates        :
                          NodeName              : _nt2vm_3
                          AggregatedHealthState : Ok

                          NodeName              : _nt1vm_4
                          AggregatedHealthState : Ok

                          NodeName              : _nt2vm_2
                          AggregatedHealthState : Ok

                          NodeName              : _nt1vm_3
                          AggregatedHealthState : Ok

                          NodeName              : _nt2vm_1
                          AggregatedHealthState : Ok

                          NodeName              : _nt1vm_2
                          AggregatedHealthState : Ok

                          NodeName              : _nt2vm_0
                          AggregatedHealthState : Ok

                          NodeName              : _nt1vm_1
                          AggregatedHealthState : Ok

                          NodeName              : _nt1vm_0
                          AggregatedHealthState : Ok

                          NodeName              : _nt3vm_0
                          AggregatedHealthState : Ok

                          NodeName              : _nt2vm_4
                          AggregatedHealthState : Ok

ApplicationHealthStates :
                          ApplicationName       : fabric:/System
                          AggregatedHealthState : Ok

                          ApplicationName       : fabric:/Voting
                          AggregatedHealthState : Error

HealthEvents            : None
HealthStatistics        :
                          Node                  : 11 Ok, 0 Warning, 0 Error
                          Replica               : 4 Ok, 0 Warning, 0 Error
                          Partition             : 2 Ok, 0 Warning, 0 Error
                          Service               : 2 Ok, 0 Warning, 0 Error
                          DeployedServicePackage : 3 Ok, 1 Warning, 1 Error
                          DeployedApplication   : 1 Ok, 1 Warning, 1 Error
                          Application           : 0 Ok, 0 Warning, 1 Error
以下示例使用自定义应用程序策略获取群集的运行状况。 它筛选结果以只获取有错误或警告的应用程序和节点。 此示例中不会返回任何节点,因为这些节点都是正常的。 仅 fabric:/Voting 应用程序符合应用程序筛选器。 因为自定义策略指定对于 fabric:/Voting 应用程序将警告视为错误,应用程序被评估为错误,从而群集也被评估为错误。
$appHealthPolicy = New-Object -TypeName System.Fabric.Health.ApplicationHealthPolicy
$appHealthPolicy.ConsiderWarningAsError = $true
$appHealthPolicyMap = New-Object -TypeName System.Fabric.Health.ApplicationHealthPolicyMap
$appUri1 = New-Object -TypeName System.Uri -ArgumentList "fabric:/Voting"
$appHealthPolicyMap.Add($appUri1, $appHealthPolicy)
Get-ServiceFabricClusterHealth -ApplicationHealthPolicyMap $appHealthPolicyMap -ApplicationsFilter "Warning,Error" -NodesFilter "Warning,Error" -ExcludeHealthStatistics

AggregatedHealthState   : Error
UnhealthyEvaluations    :
                          100% (1/1) applications are unhealthy. The evaluation tolerates 0% unhealthy applications.

                          Application 'fabric:/Voting' is in Error.

                          	100% (5/5) deployed applications are unhealthy. The evaluation tolerates 0% unhealthy deployed applications.

                          	Deployed application on node '_nt2vm_3' is in Error.

                          		50% (1/2) deployed service packages are unhealthy.

                          		Service package for manifest 'VotingWebPkg' and service package activation ID '8723eb73-9b83-406b-9de3-172142ba15f3' is in Error.

                          			'System.Hosting' reported Error for property 'CodePackageActivation:Code:SetupEntryPoint:131959376195593305'.
                          			There was an error during CodePackage activation.The service host terminated with exit code:1

                          	Deployed application on node '_nt2vm_2' is in Error.

                          		50% (1/2) deployed service packages are unhealthy.

                          		Service package for manifest 'VotingWebPkg' and service package activation ID '2466f2f9-d5fd-410c-a6a4-5b1e00630cca' is in Error.

                          			'System.Hosting' reported Error for property 'CodePackageActivation:Code:SetupEntryPoint:131959376486201388'.
                          			There was an error during CodePackage activation.The service host terminated with exit code:1

                          	Deployed application on node '_nt2vm_4' is in Error.

                          		100% (1/1) deployed service packages are unhealthy.

                          		Service package for manifest 'VotingWebPkg' and service package activation ID '5faa5201-eede-400a-865f-07f7f886aa32' is in Error.

                          			'System.Hosting' reported Warning for property 'CodePackageActivation:Code:SetupEntryPoint:131959376207396204'. The evaluation treats
                          Warning as Error.
                          			There was an error during CodePackage activation.The service host terminated with exit code:1

                          	Deployed application on node '_nt2vm_0' is in Error.

                          		100% (1/1) deployed service packages are unhealthy.

                          		Service package for manifest 'VotingWebPkg' and service package activation ID '204f1783-f774-4f3a-b371-d9983afaf059' is in Error.

                          			'System.Hosting' reported Error for property 'CodePackageActivation:Code:SetupEntryPoint:131959375885791093'.
                          			There was an error during CodePackage activation.The service host terminated with exit code:1

                          	Deployed application on node '_nt3vm_0' is in Error.

                          		50% (1/2) deployed service packages are unhealthy.

                          		Service package for manifest 'VotingWebPkg' and service package activation ID '2533ae95-2d2a-4f8b-beef-41e13e4c0081' is in Error.

                          			'System.Hosting' reported Error for property 'CodePackageActivation:Code:SetupEntryPoint:131959376108346272'.
                          			There was an error during CodePackage activation.The service host terminated with exit code:1

NodeHealthStates        : None
ApplicationHealthStates :
                          ApplicationName       : fabric:/Voting
                          AggregatedHealthState : Error

HealthEvents            : None
获取节点运行状况
Get-ServiceFabricNodeHealth cmdlet 返回节点实体的运行状况,并包含针对该节点报告的运行状况事件。 首先使用 Connect-ServiceFabricCluster cmdlet 连接到群集。 以下示例使用默认运行状况策略获取特定节点的运行状况:
Get-ServiceFabricNodeHealth _nt1vm_3
以下示例获取群集中所有节点的运行状况:
Get-ServiceFabricNode | Get-ServiceFabricNodeHealth | select NodeName, AggregatedHealthState | ft -AutoSize
获取系统服务运行状况
获取系统服务的聚合运行状况:
Get-ServiceFabricService -ApplicationName fabric:/System | Get-ServiceFabricServiceHealth | select ServiceName, AggregatedHealthState | ft -AutoSize
后续步骤
在本教程中,你了解了如何执行以下操作:
- 查看 Service Fabric 事件
- 查询群集事件的 EventStore API
- 监视基础架构/收集性能计数器
- 查看群集运行状况报告
接下来,请转到下一个教程了解如何缩放群集。