本文介绍如何使用
Azure监视器日志提供一个日志数据平台,用于收集活动和资源日志以及其他监视数据。 在Azure监视日志中,可以使用 Log Analytics 编写和测试日志查询,并以交互方式分析日志数据。 可以可视化和查询日志结果,并配置警报来根据监视的数据采取措施。
对于站点恢复,请使用 Azure 监控日志来帮助执行以下操作:
- Monitor Site Recovery运行状况和状态。 例如,可以监视受保护计算机的复制运行状况、测试故障转移状态、Site Recovery事件、恢复点目标(RPO)以及磁盘/数据更改率。
- 为 Site Recovery设置警报。 例如,可以为机器健康状况、测试故障转移状态或 Site Recovery 作业状态配置警报。
Azure监视日志支持将 Site Recovery 用于 Azure 到 Azure 复制和 VMware 虚拟机/物理服务器到 Azure 复制。
注意事项
若要获取 VMware 和物理计算机的流失数据日志和上传速率日志,需要在进程服务器上安装Azure监视代理。 此代理可将复制计算机的日志发送到工作区。 此功能仅适用于 9.30 移动代理版本和更高版本。
必备条件
您所需要的东西如下:
- 至少有一台计算机受保护于恢复服务保管库中。
- 用于存储Site Recovery日志的 Log Analytics 工作区。 请了解如何设置工作区。
- 基本了解如何在 Log Analytics 中编写、运行和分析日志查询。 Learn more.
在开始之前查看 常见的监视问题 。
配置Site Recovery以发送日志
在保管库中,选择诊断设置>添加诊断设置。
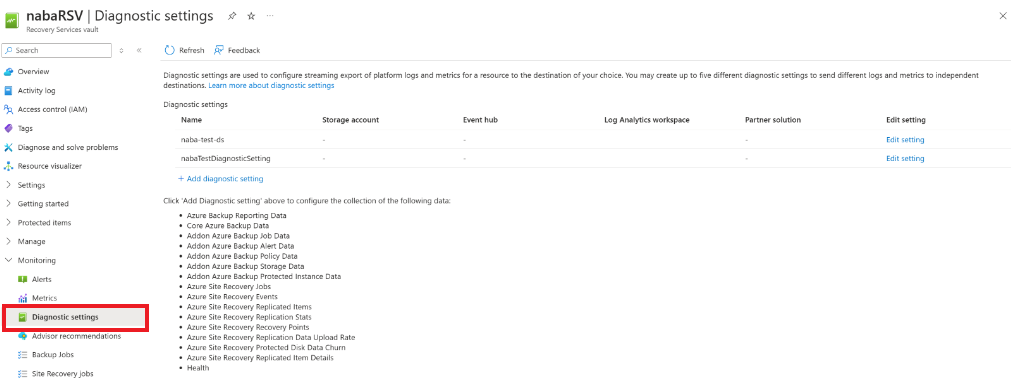
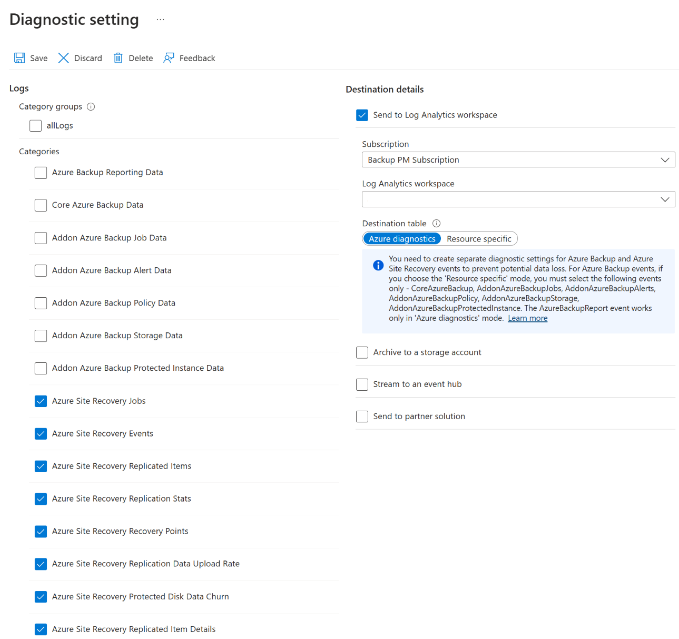
在 诊断设置中,输入名称,并选中“ 发送到 Log Analytics”框。
选择 Azure Monitor 日志服务订阅和 Log Analytics 工作区。
在切换中选择 Azure Diagnostics。
在日志列表中,选择带有 AzureSiteRecovery 前缀的所有日志。 然后选择“确定”。
Site Recovery日志开始馈送到所选工作区中的表(AzureDiagnostics)。
在进程服务器上配置Azure监视代理以发送流失和上传速率日志
可以捕获本地 VMware 和物理计算机的数据变动率信息和源数据上传速率信息。 若要启用此功能,请在进程服务器上安装Microsoft监视代理。
转到 Log Analytics 工作区并选择“高级设置”。
选择 “连接的源 ”,然后选择 “Windows 服务器”。
在进程服务器上下载 Windows 代理(64 位)。
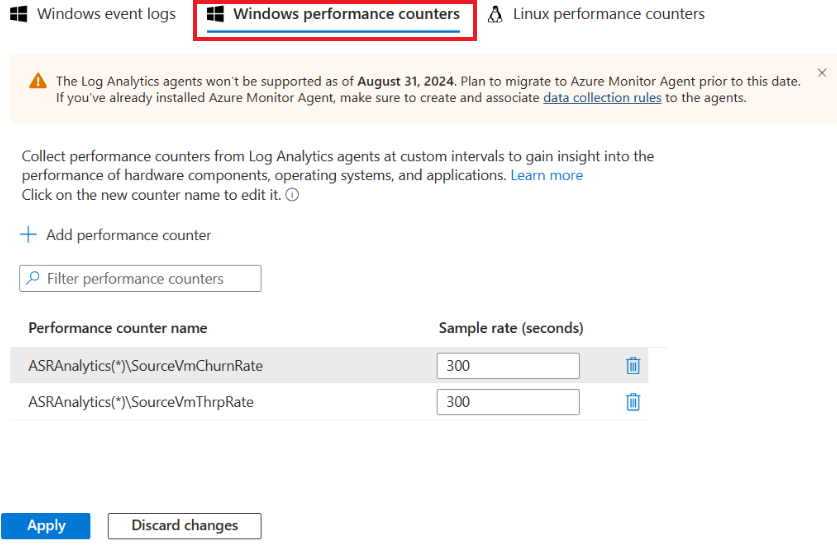
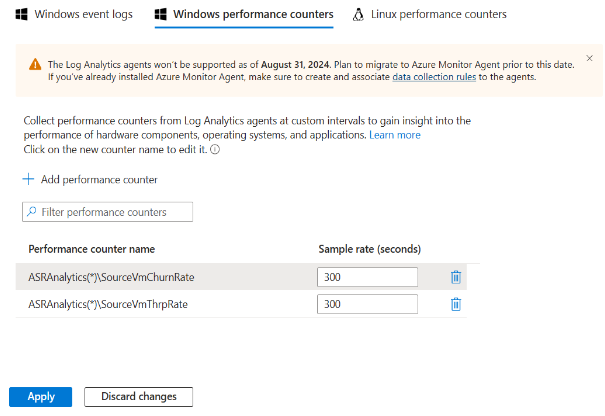
安装完成后,转到 Log Analytics 工作区并选择 “旧代理管理”。 转到“数据”页并选择“Windows 性能计数器”。
选择 '+' 以添加以下两个计数器,采样间隔为 300 秒:
- ASRAnalytics(*)\SourceVmChurnRate
- ASRAnalytics\\SourceVmThrpRate
流失率和上传速率数据开始被馈入到工作区。
当前无法搜索以下Site Recovery计数器:
- ASRAnalytics(*)\SourceVmChurnRate
- ASRAnalytics\\SourceVmThrpRate
然而,你可以通过完整粘贴名称来添加它们。
注意事项
目前,无法搜索这些计数器。 但是,可以通过复制并粘贴其全名来添加它们。
- SourceVmThrpRate 显示源上的网络吞吐量速率。
- SourceVmChurnRate 会在源虚拟机的磁盘上显示数据更改率。
查询日志 - 示例
使用用 Kusto 查询语言编写的日志查询检索日志中的数据。 本部分提供了一些可用于Site Recovery监视的常见查询示例。
注意事项
其中一些示例使用设置为 A2A 的 replicationProviderName_s。 此值用于使用 Site Recovery 检索复制到辅助 Azure 区域的 Azure 虚拟机。 在这些示例中,如果要使用 Site Recovery 检索复制到Azure的本地 VMware virtual machines 或物理服务器,可以将 A2A 替换为 InMageRcm。
查询复制运行状况
此查询为所有受保护的 Azure 虚拟机的当前复制运行状况创建饼图。 图表将健康状况分解为三种状态:“正常”、“提醒”或“严重”。
AzureDiagnostics
| where replicationProviderName_s == "A2A"
| where isnotempty(name_s) and isnotnull(name_s)
| summarize hint.strategy=partitioned arg_max(TimeGenerated, *) by name_s
| project name_s , replicationHealth_s
| summarize count() by replicationHealth_s
| render piechart
查询移动服务版本
此查询为使用Site Recovery复制的Azure virtual machines创建饼图。 图表按它们运行的移动代理版本对虚拟机进行分类。
AzureDiagnostics
| where replicationProviderName_s == "A2A"
| where isnotempty(name_s) and isnotnull(name_s)
| summarize hint.strategy=partitioned arg_max(TimeGenerated, *) by name_s
| project name_s , agentVersion_s
| summarize count() by agentVersion_s
| render piechart
查询 RPO 时间
此查询创建了一个条形图,显示通过 Site Recovery 复制的 Azure 虚拟机。 图表按恢复点目标(RPO)将虚拟机细分为:小于 15 分钟,介于 15-30 分钟之间,以及超过 30 分钟。
AzureDiagnostics
| where replicationProviderName_s == "A2A"
| where isnotempty(name_s) and isnotnull(name_s)
| extend RPO = case(rpoInSeconds_d <= 900, "<15Min",
rpoInSeconds_d <= 1800, "15-30Min", ">30Min")
| summarize hint.strategy=partitioned arg_max(TimeGenerated, *) by name_s
| project name_s , RPO
| summarize Count = count() by RPO
| render barchart
查询站点恢复作业
此查询检索过去 72 小时内触发的所有Site Recovery作业(针对所有灾难恢复方案),以及其完成状态。
AzureDiagnostics
| where Category == "AzureSiteRecoveryJobs"
| where TimeGenerated >= ago(72h)
| project JobName = OperationName , VaultName = Resource , TargetName = affectedResourceName_s, State = ResultType
查询“Site Recovery”事件
此查询将检索过去 72 小时内系统引发的所有灾难恢复方案中的站点恢复事件及其严重性。
AzureDiagnostics
| where Category == "AzureSiteRecoveryEvents"
| where TimeGenerated >= ago(72h)
| project AffectedObject=affectedResourceName_s , VaultName = Resource, Description_s = healthErrors_s , Severity = Level
查询测试故障转移状态(饼图)
此查询绘制一个饼图,用于显示使用 Site Recovery 复制的 Azure 虚拟机的测试故障转移状态。
AzureDiagnostics
| where replicationProviderName_s == "A2A"
| where isnotempty(name_s) and isnotnull(name_s)
| where isnotempty(failoverHealth_s) and isnotnull(failoverHealth_s)
| summarize hint.strategy=partitioned arg_max(TimeGenerated, *) by name_s
| project name_s , Resource, failoverHealth_s
| summarize count() by failoverHealth_s
| render piechart
查询测试故障转移状态(表格)
此查询绘制一个表格,用于显示通过 Site Recovery 复制的 Azure 虚拟机的测试故障转移状态。
AzureDiagnostics
| where replicationProviderName_s == "A2A"
| where isnotempty(name_s) and isnotnull(name_s)
| where isnotempty(failoverHealth_s) and isnotnull(failoverHealth_s)
| summarize hint.strategy=partitioned arg_max(TimeGenerated, *) by name_s
| project VirtualMachine = name_s , VaultName = Resource , TestFailoverStatus = failoverHealth_s
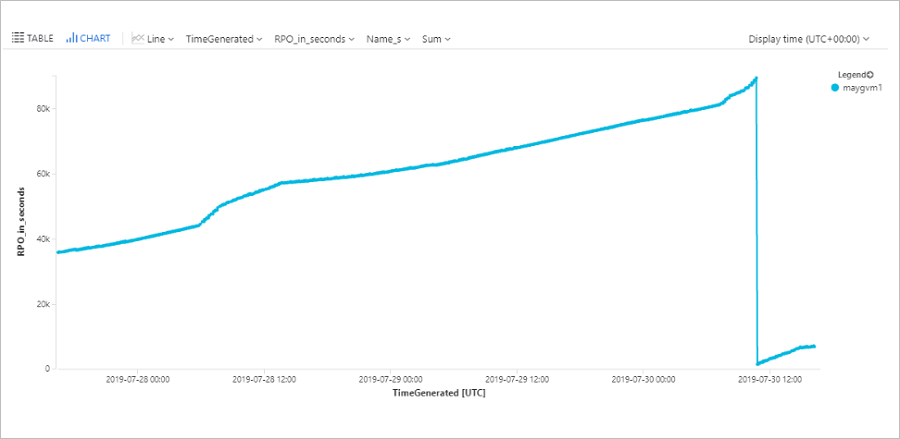
查询机器 RPO
此查询绘制一个趋势图,用于跟踪过去 72 小时内特定Azure虚拟机(ContosoVM123)的 RPO。
AzureDiagnostics
| where replicationProviderName_s == "A2A"
| where TimeGenerated > ago(72h)
| where isnotempty(name_s) and isnotnull(name_s)
| where name_s == "ContosoVM123"
| project TimeGenerated, name_s , RPO_in_seconds = rpoInSeconds_d
| render timechart
查询Azure虚拟机的数据更改率(变动率)和上传速率
此查询绘制表示数据更改率(每秒写入字节数)和数据上传速率的特定Azure虚拟机(ContosoVM123)的趋势图。
AzureDiagnostics
| where Category in ("AzureSiteRecoveryProtectedDiskDataChurn", "AzureSiteRecoveryReplicationDataUploadRate")
| extend CategoryS = case(Category contains "Churn", "DataChurn",
Category contains "Upload", "UploadRate", "none")
| extend InstanceWithType=strcat(CategoryS, "_", InstanceName_s)
| where TimeGenerated > ago(24h)
| where InstanceName_s startswith "ContosoVM123"
| project TimeGenerated , InstanceWithType , Churn_MBps = todouble(Value_s)/1048576
| render timechart
查询 VMware 或物理计算机的数据更改(变动)速率和上传速率
注意事项
请确保在进程服务器上设置监视代理以获取这些日志。 请参阅配置监视代理的步骤。
此查询为复制的项 win-9r7sfh9qlru 的特定磁盘 disk0 绘制趋势图,表示数据更改速率(每秒写入字节数)和数据上传速率。 可以在恢复服务保管库中复制的项的“磁盘”边栏选项卡上找到磁盘名称。 查询中使用的实例名称是计算机的 DNS 名称,后跟 _ 和磁盘名称,如以下示例所示。
Perf
| where ObjectName == "ASRAnalytics"
| where InstanceName contains "win-9r7sfh9qlru_disk0"
| where TimeGenerated >= ago(4h)
| project TimeGenerated ,CounterName, Churn_MBps = todouble(CounterValue)/5242880
| render timechart
进程服务器每五分钟将此数据推送到 Log Analytics 工作区。 这些数据点表示计算的 5 分钟平均值。
查询灾难恢复摘要(Azure到Azure)
此查询绘制复制到 Azure 次要区域的 Azure 虚拟机的摘要表。 它显示虚拟机名称、复制和保护状态、RPO、测试故障转移状态、移动代理版本、任何活动的复制错误以及源位置。
AzureDiagnostics
| where replicationProviderName_s == "A2A"
| where isnotempty(name_s) and isnotnull(name_s)
| summarize hint.strategy=partitioned arg_max(TimeGenerated, *) by name_s
| project VirtualMachine = name_s , Vault = Resource , ReplicationHealth = replicationHealth_s, Status = protectionState_s, RPO_in_seconds = rpoInSeconds_d, TestFailoverStatus = failoverHealth_s, AgentVersion = agentVersion_s, ReplicationError = replicationHealthErrors_s, SourceLocation = primaryFabricName_s
查询灾难恢复摘要(VMware/物理服务器)
此查询生成一个用于在Azure上复制的VMware虚拟机和物理服务器的摘要表。 其中显示计算机名称、复制和保护状态、RPO、测试故障转移状态、移动代理版本、任何活动的复制错误以及相关的进程服务器。
AzureDiagnostics
| where replicationProviderName_s == "InMageRcm"
| where isnotempty(name_s) and isnotnull(name_s)
| summarize hint.strategy=partitioned arg_max(TimeGenerated, *) by name_s
| project VirtualMachine = name_s , Vault = Resource , ReplicationHealth = replicationHealth_s, Status = protectionState_s, RPO_in_seconds = rpoInSeconds_d, TestFailoverStatus = failoverHealth_s, AgentVersion = agentVersion_s, ReplicationError = replicationHealthErrors_s, ProcessServer = processServerName_g
设置警报 - 示例
可以根据 Azure Monitor 数据设置 Site Recovery 警报。 了解更多关于如何设置日志警报。
注意事项
其中一些示例使用设置为 A2A 的 replicationProviderName_s。 此值为复制到辅助 Azure 区域的 Azure 虚拟机设置警报。 在这些示例中,如果要为复制到Azure的本地 VMware virtual machines 或物理服务器设置警报,可以将 A2A 替换为 InMageRcm。
多台计算机处于严重状态
如果超过 20 个复制的 Azure 虚拟机进入“关键”状态,请设置警报。
AzureDiagnostics
| where replicationProviderName_s == "A2A"
| where replicationHealth_s == "Critical"
| where isnotempty(name_s) and isnotnull(name_s)
| summarize hint.strategy=partitioned arg_max(TimeGenerated, *) by name_s
| summarize count()
对于警报,请将“阈值”设置为 。
一台计算机处于严重状态
如果特定的复制Azure虚拟机进入“严重”状态,请设置警报。
AzureDiagnostics
| where replicationProviderName_s == "A2A"
| where replicationHealth_s == "Critical"
| where name_s == "ContosoVM123"
| where isnotempty(name_s) and isnotnull(name_s)
| summarize hint.strategy=partitioned arg_max(TimeGenerated, *) by name_s
| summarize count()
对于警报,请将“阈值”设置为 。
多台计算机超过 RPO
如果超过 20 台 Azure 虚拟机的 RPO 超过 30 分钟,请设置警报。
AzureDiagnostics
| where replicationProviderName_s == "A2A"
| where isnotempty(name_s) and isnotnull(name_s)
| where rpoInSeconds_d > 1800
| summarize hint.strategy=partitioned arg_max(TimeGenerated, *) by name_s
| project name_s , rpoInSeconds_d
| summarize count()
对于警报,请将“阈值”设置为 。
一台计算机超过 RPO
如果单个Azure虚拟机的 RPO 超过 30 分钟,请设置警报。
AzureDiagnostics
| where replicationProviderName_s == "A2A"
| where isnotempty(name_s) and isnotnull(name_s)
| where name_s == "ContosoVM123"
| where rpoInSeconds_d > 1800
| summarize hint.strategy=partitioned arg_max(TimeGenerated, *) by name_s
| project name_s , rpoInSeconds_d
| summarize count()
对于警报,请将“阈值”设置为 。
多台计算机的测试故障转移超过 90 天
如果上次成功的测试故障转移是在超过 90 天前,并且涉及 20 台或更多虚拟机,请设置警报。
AzureDiagnostics
| where replicationProviderName_s == "A2A"
| where Category == "AzureSiteRecoveryReplicatedItems"
| where isnotempty(name_s) and isnotnull(name_s)
| where lastSuccessfulTestFailoverTime_t <= ago(90d)
| summarize hint.strategy=partitioned arg_max(TimeGenerated, *) by name_s
| summarize count()
对于警报,请将“阈值”设置为 。
一台计算机的测试故障转移超过 90 天
如果某台特定虚拟机的上次成功测试故障转移时间已超过 90 天,则设置警报。
AzureDiagnostics
| where replicationProviderName_s == "A2A"
| where Category == "AzureSiteRecoveryReplicatedItems"
| where isnotempty(name_s) and isnotnull(name_s)
| where lastSuccessfulTestFailoverTime_t <= ago(90d)
| where name_s == "ContosoVM123"
| summarize hint.strategy=partitioned arg_max(TimeGenerated, *) by name_s
| summarize count()
对于警报,请将“阈值”设置为 。
Site Recovery作业失败
如果在过去的一天内,任何站点恢复方案中的Site Recovery作业(在本例中是重新保护作业)失败,请设置警报。
AzureDiagnostics
| where Category == "AzureSiteRecoveryJobs"
| where OperationName == "Reprotect"
| where ResultType == "Failed"
| summarize count()
对于警报,将 阈值 设置为 1, 时间段 为 1,440 分钟,以检查最后一天的故障。
后续步骤
了解内置的Site Recovery监控。