Azure 自动化可将 Runbook 作业状态和作业流发送到 Log Analytics 工作区。 此过程不涉及工作区链接,完全独立,可用于执行简单调查。 可通过 Azure 门户或 PowerShell 查看单个作业的作业日志和作业流。 使用自动化帐户的 Azure Monitor 日志,你可以:
- 深入了解自动化作业的状态。
- 基于 Runbook 作业状态(例如失败或暂停)触发电子邮件或警报。
- 编写跨作业流的高级查询。
- 跨自动化帐户关联作业。
- 通过 Azure 仪表板使用自定义视图和搜索查询直观呈现 runbook 结果、runbook 作业状态以及其他相关的关键指标。
- 获取与自动化帐户、runbook 和其他资产的创建、修改和删除操作相关的审核日志。
使用 Azure Monitor 日志,你可以合并来自同一工作区中不同资源的日志,可以在工作区中使用查询对其进行分析,以快速检索、合并和分析收集的数据。 可以在 Azure 门户中使用 Log Analytics 创建和测试查询,然后直接使用这些工具分析数据,或者保存查询以便与可视化效果或警报规则配合使用。
Azure Monitor 使用 Azure 数据资源管理器使用的 Kusto 查询语言 (KQL) 的某个版本,该查询语言适用于简单的日志查询。 该语言还包括高级功能,例如聚合、联接和智能分析。 可以通过多个课程快速了解此查询语言。
Azure 自动化诊断设置
可以使用自动化诊断设置支持来转发以下平台日志和指标数据:
| 数据类型 | 说明 |
|---|---|
| 作业日志 | 自动化帐户中的 runbook 作业的状态。 |
| 作业流 | 在自动化帐户中定义的 runbook 中的作业流的状态。 |
| DSC节点状态 | DSC 节点的状态。 |
| 审计事件 | 记录客户与数据或 Azure 自动化服务的设置交互的所有资源日志。 |
| 指标 | 作业总数、更新部署计算机运行总数、更新部署运行总数。 |
在 Azure 门户中配置诊断设置
可以在 Azure 门户中通过自动化帐户资源菜单配置诊断设置。
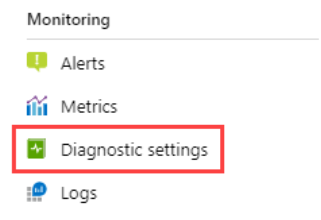
在自动化帐户菜单中的“监视”下,选择“诊断设置”。
单击“添加诊断设置”。
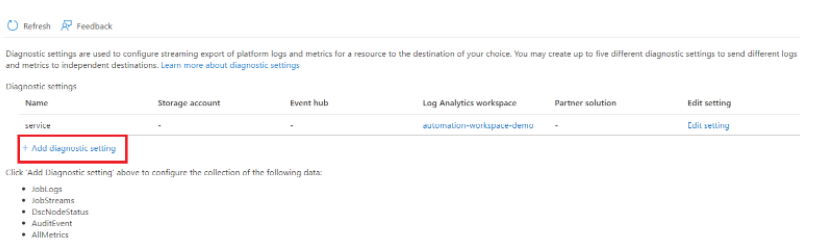
在“诊断设置名称”中输入设置名称(如果还没有)。
还可以查看所有类别的日志和指标。
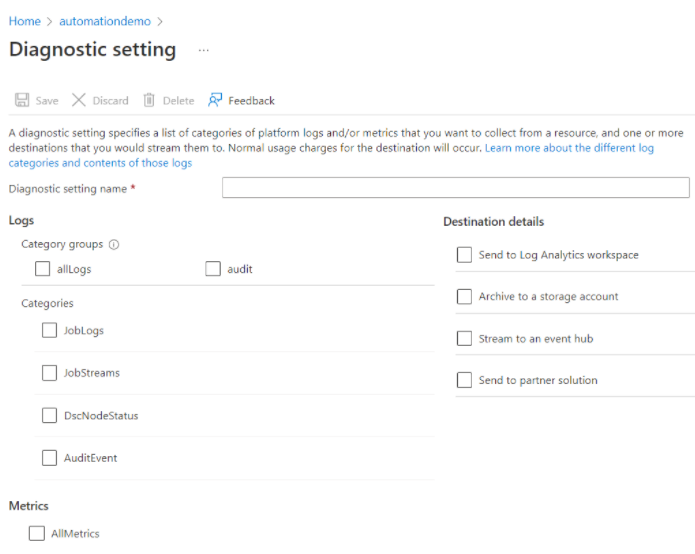
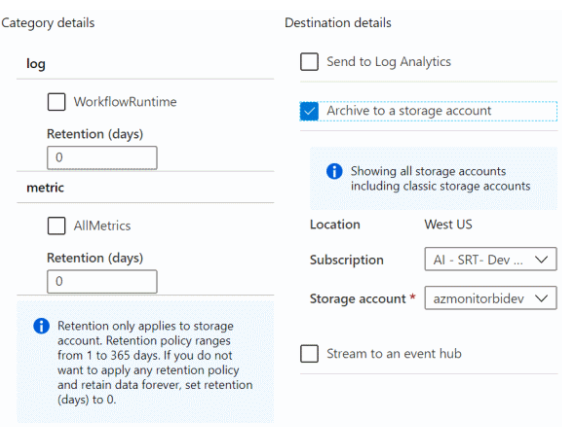
要路由的日志和指标 - 对于日志,请选择一个类别组,或选中要发送到指定目标的每个数据类别对应的各个复选框。 如果要将指标存储到 Azure Monitor 日志中,请选择“AllMetrics”。
目标详细信息:选中每个目标对应的复选框。 选中每个框时,将显示用于添加其他信息的选项。
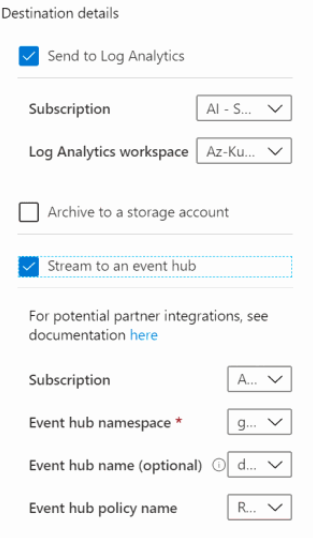
Log Analytics:输入订阅 ID 和工作区名称。 如果没有工作区,则必须在继续操作之前创建一个。
事件中心:指定以下条件:
- 订阅:与事件中心的订阅相同的订阅。
- 事件中心命名空间:创建事件中心(如果还没有)。
- 事件中心名称(可选):如果未指定名称,将为每个日志类别创建一个事件中心。 如果发送多个类别,请指定一个名称来限制创建的事件中心数。 有关详细信息,请参阅 Azure 事件中心配额和限制。
- 事件中心策略(可选):策略定义流式处理机制具有的权限。 请参阅事件中心功能。
存储:选择订阅、存储帐户和保留策略。
合作伙伴集成:必须先将合作伙伴集成安装到你的订阅中。 配置选项因合作伙伴而异。
单击“保存” 。


片刻之后,新设置会显示在此资源的设置列表中,生成新的事件数据后,日志会立即流式传输到指定的目标。 事件在发出之后,可能需要过 15 分钟才会出现在 Log Analytics 工作区中。
查询日志
若要查询生成的日志,请执行以下操作:
在自动化帐户中,选择“监视”下的“日志”。
在“所有查询”下,选择“自动化作业”。
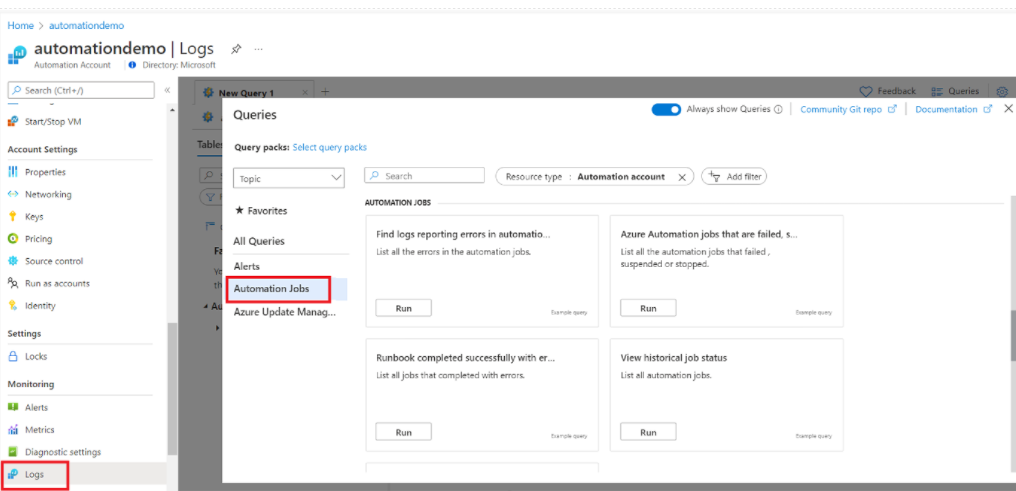
选择要执行的查询之一,然后单击“运行”。
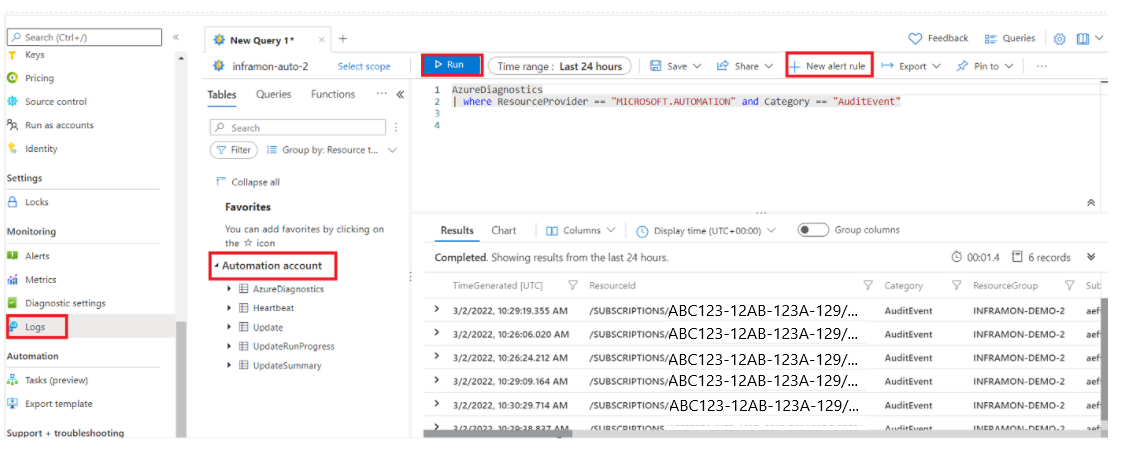
若要执行自定义查询,请关闭“查询”窗口并在新的查询窗口中粘贴你的自定义查询,然后单击“运行”。
查询的输出显示在“结果”窗格中。
单击“新建警报规则”,为此查询配置 Azure Monitor 警报。

Azure Monitor 日志记录
Azure 自动化诊断将在 Azure Monitor 日志中创建以下类型的记录,标记为 AzureDiagnostics。 在以下部分的表中,有 Azure 自动化生成的记录和日志搜索结果中显示的数据类型的示例。
作业日志
| 属性 | 说明 |
|---|---|
| TimeGenerated | 执行 Runbook 作业的日期和时间。 |
| RunbookName_s | runbook 的名称。 |
| 来电者 | 启动操作的调用方。 可能的值为电子邮件地址或计划作业的系统。 |
| Tenant_g | 标识调用方的租户的 GUID(全局唯一标识符)。 |
| JobId_g | 标识 Runbook 作业的 GUID。 |
| 结果类型 | runbook 作业的状态。 可能的值包括: - 已创建 - Started(已启动) - Stopped(已停止) - Suspended(已暂停) - Failed(失败) - 已完成 |
| 类别 | 数据类型的分类。 对于自动化,该值为 JobLogs。 |
| 操作名称 | Azure 中执行的操作的类型。 对于自动化,该值为 Job。 |
| 资源 | 自动化帐户的名称 |
| SourceSystem | Azure Monitor 日志用来收集数据的系统。 对于 Azure 诊断,值始终为 Azure。 |
| 结果描述 | runbook 作业结果状态。 可能的值包括: - 作业已启动 - 作业失败 - 作业已完成 |
| CorrelationId | runbook 作业的关联 GUID。 |
| ResourceId | runbook 的 Azure 自动化帐户资源 ID。 |
| SubscriptionId(订阅ID) | 自动化帐户的 Azure 订阅 GUID。 |
| ResourceGroup | 自动化帐户的资源组的名称。 |
| 资源提供者 | 资源提供程序的名称。 值为 MICROSOFT.AUTOMATION。 |
| 资源类型 | 资源类型。 值为 AUTOMATIONACCOUNTS。 |
作业流
| 属性 | 说明 |
|---|---|
| TimeGenerated | 执行 runbook 作业的日期和时间。 |
| RunbookName_s | Runbook 的名称。 |
| 来电者 | 启动操作的调用方。 可能的值为电子邮件地址或计划作业的系统。 |
| StreamType_s | 作业流的类型。 可能的值包括: \- 进度 - Output(输出) - Warning(警告) - Error(错误) - Debug(调试) - 详细 |
| Tenant_g | 用于为调用方标识租户的 GUID。 |
| JobId_g | 标识 Runbook 作业的 GUID。 |
| 结果类型 | Runbook 作业的状态。 可能的值包括: - 正在进行中 |
| 类别 | 数据类型的分类。 对于自动化,该值为 JobStreams。 |
| 操作名称 | Azure 中执行的操作的类型。 对于自动化,该值为 Job。 |
| 资源 | 自动化帐户的名称。 |
| SourceSystem | Azure Monitor 日志用来收集数据的系统。 对于 Azure 诊断,值始终为 Azure。 |
| 结果描述 | 包括来自 Runbook 的输出流的说明。 |
| CorrelationId | runbook 作业的关联 GUID。 |
| ResourceId | runbook 的 Azure 自动化帐户资源 ID。 |
| SubscriptionId(订阅ID) | 自动化帐户的 Azure 订阅 GUID。 |
| ResourceGroup | 自动化帐户的资源组的名称。 |
| 资源提供者 | 资源提供程序。 值为 MICROSOFT.AUTOMATION。 |
| 资源类型 | 资源类型。 值为 AUTOMATIONACCOUNTS。 |
注意
确保凭据不会发送到作业流。 服务会在诊断日志中显示作业流之前删除凭据。
审核事件
| 属性 | 说明 |
|---|---|
| TenantID | 用于为调用方标识租户的 GUID。 |
| TimeGenerated(UTC) | 执行 runbook 作业的日期和时间。 |
| 类别 | 审计事件 |
| ResourceGroup | 自动化帐户的资源组名称。 |
| 订阅 ID | 自动化帐户的 Azure 订阅 GUID。 |
| 资源提供者 | MICROSOFT.AUTOMATION |
| 资源 | 自动化帐户名称 |
| 资源类型 | 自动化账户 |
| 操作名称 | 可能的值为 Update、Create、Delete。 |
| 结果类型 | runbook 作业的状态。 可能的值为 Completed。 |
| CorrelationId | runbook 作业的关联 GUID。 |
| 结果描述 | runbook 作业结果状态。 可能的值为 Update、Create、Delete。 |
| Tenant_g | 用于为调用方标识租户的 GUID。 |
| SourceSystem | Azure Monitor 日志用来收集数据的系统。 对于 Azure 诊断,值始终为 Azure。 |
| clientInfo_IpAddress_s | {已清理} |
| clientInfo_PrincipalName_s | {已清理} |
| clientInfo_TenantId_g | 客户端的租户 ID。 |
| 客户信息_发行者_s | |
| clientInfo_ObjectId_g | 客户端的对象 ID。 |
| clientInfo_AppId_g | 客户端的 AppID。 |
| clientInfo_ClientRequestId_g | 客户端的 RequestID。 |
| targetResources_Resource_s | 帐户、作业、凭据、连接、变量、Runbook。 |
| 类型 | AzureDiagnostics |
| _资源ID | runbook 的 Azure 自动化帐户资源 ID。 |
在 Azure Monitor 日志中查看自动化日志
现在,你已开始将自动化作业流和日志发送到 Azure Monitor 日志,接下来让我们看看可在 Azure Monitor 日志中对这些日志执行哪些操作。
若要查看日志,请运行以下查询:kusto AzureDiagnostics | where ResourceProvider == "MICROSOFT.AUTOMATION"
作业日志和作业流的示例查询
查找已完成但出错的所有作业
除了发现在失败时发出警报这样的情况外,还可以发现 runbook 作业何时发生非终止错误。 在这些情况下,PowerShell 会生成一个错误流,但非终止错误不会导致作业暂停或失败。
- 在 Log Analytics 工作区中,单击“日志”。
- 在查询字段中,键入:
AzureDiagnostics | where ResourceProvider == "MICROSOFT.AUTOMATION" and Category == "JobStreams" and StreamType_s == "Error" | summarize AggregatedValue = count () by JobId_g. - 单击“搜索”。
查看作业的作业流
调试作业时,你可能还希望深入查看作业流。 以下查询会显示 GUID 为 2ebd22ea-e05e-4eb9-9d76-d73cbd4356e0 的单个作业的所有流:
AzureDiagnostics
| where ResourceProvider == "MICROSOFT.AUTOMATION" and Category == "JobStreams" and JobId_g == "2ebd22ea-e05e-4eb9-9d76-d73cbd4356e0"
| sort by TimeGenerated asc
| project ResultDescription
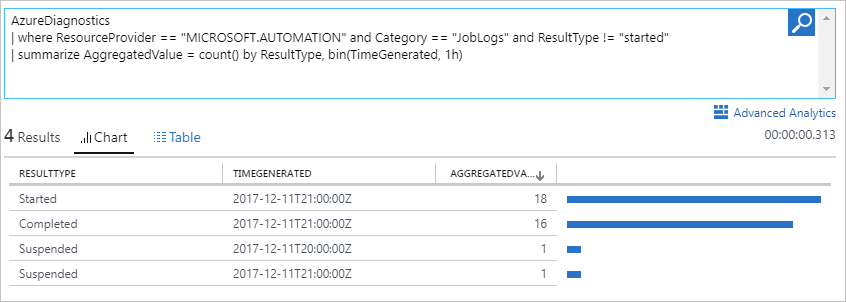
查看历史作业状态
最后,可能需要直观显示一段时间内的作业历史记录。 可以使用此查询来搜索作业在不同时间段的状态。
AzureDiagnostics
| where ResourceProvider == "MICROSOFT.AUTOMATION" and Category == "JobLogs" and ResultType != "started"
| summarize AggregatedValue = count() by ResultType, bin(TimeGenerated, 1h)
查找那些报告自动化作业中的错误的日志。
AzureDiagnostics
| where ResourceProvider == "MICROSOFT.AUTOMATION"
| where StreamType_s == "Error"
| project TimeGenerated, Category, JobId_g, OperationName, RunbookName_s, ResultDescription, _ResourceId
查找已完成的 Azure 自动化作业
AzureDiagnostics
| where ResourceProvider == "MICROSOFT.AUTOMATION" and Category == "JobLogs" and ResultType == "Completed"
| project TimeGenerated, RunbookName_s, ResultType, _ResourceId, JobId_g
查找已失败、已暂停或已停止的 Azure 自动化作业
AzureDiagnostics
| where ResourceProvider == "MICROSOFT.AUTOMATION" and Category == "JobLogs" and (ResultType == "Failed" or ResultType == "Stopped" or ResultType == "Suspended")
| project TimeGenerated, RunbookName_s, ResultType, _ResourceId, JobId_g
列出所有成功完成且有错误的 runbook 和作业
AzureDiagnostics
| where ResourceProvider == "MICROSOFT.AUTOMATION" and Category == "JobStreams" and StreamType_s == "Error"
| project TimeGenerated, RunbookName_s, StreamType_s, _ResourceId, ResultDescription, JobId_g
Runbook 作业失败或暂停时发送电子邮件
以下步骤说明如何在 Azure Monitor 中设置电子邮件警报,以便在 runbook 作业出现问题时进行通知。
若要创建警报规则,请针对应调用警报的 runbook 作业记录创建日志搜索,如查询日志所述。 单击“+新建警报规则”以配置警报规则。
在自动化帐户中,选择“监视”下的“日志”。
在查询字段中输入搜索条件,针对警报创建日志搜索查询。
AzureDiagnostics | where ResourceProvider == "MICROSOFT.AUTOMATION" and Category == "JobLogs" and (ResultType == "Failed" or ResultType == "Suspended")也可使用以下命令按 Runbook 名称进行分组:
AzureDiagnostics | where ResourceProvider == "MICROSOFT.AUTOMATION" and Category == "JobLogs" and (ResultType == "Failed" or ResultType == "Suspended") | summarize AggregatedValue = count() by RunbookName_s若要打开“创建警报规则”屏幕,请单击页面顶部的“+新建警报规则”。 有关用于配置警报的选项的详细信息,请参阅 Azure 中的日志警报
Azure 自动化诊断审核日志
现在,还可以将审核日志发送到 Azure Monitor 工作区。 这使得企业可以监视关键的自动化帐户活动,以保证安全性和合规性。 通过 Azure 诊断设置启用时,可以收集有关自动化 runbook、作业和自动化资产(如连接、凭据、变量和证书)的创建、更新和删除操作的遥测数据。 还可以根据安全监视要求中的审核日志条件配置警报。
活动日志与审核日志的差异
活动日志是 Azure 中的一种平台日志,可用于深入了解订阅级别事件。 自动化帐户的活动日志包括有关自动化资源的修改、创建或删除时间的信息。 但是,该日志不会捕获资源的名称或 ID。
自动化帐户的审核日志捕获资源(例如自动化变量、凭据、连接等)的名称和 ID 以及针对资源执行的操作的类型。Azure 自动化会清理某些详细信息,例如符合 GDPR 规范的客户端 IP 数据。
活动日志会显示客户端 IP 等详细信息,因为活动日志是平台日志,提供 Azure 资源的详细诊断和审核信息。 它们是为 ARM 中发生的活动自动生成的,将会推送到活动日志资源提供程序。 由于活动日志是 Azure 监视的一部分,因此它会显示一些可用于深入了解客户端活动的客户端数据。
审核日志的示例查询
用于查看自动化资源审核日志的查询
AzureDiagnostics
| where ResourceProvider == "MICROSOFT.AUTOMATION" and Category == "AuditEvent"
用于监视任何变量更新、创建或删除操作的查询
AzureDiagnostics
| where ResourceProvider == "MICROSOFT.AUTOMATION" and Category == "AuditEvent" and targetResources_Resource_s == "Variable"
用于监视任何 runbook 操作(例如创建、草拟或更新)的查询
AzureDiagnostics
| where ResourceProvider == "MICROSOFT.AUTOMATION" and Category == "AuditEvent" and targetResources_Resource_s contains "Runbook"
用于监视任何证书创建、更新或删除操作的查询
AzureDiagnostics
| where ResourceProvider == "MICROSOFT.AUTOMATION" and Category == "AuditEvent" and targetResources_Resource_s contains "Certificate"
用于监视任何凭据创建、更新或删除操作的查询
AzureDiagnostics
| where ResourceProvider == "MICROSOFT.AUTOMATION" and Category == "AuditEvent" and targetResources_Resource_s contains "Credential"
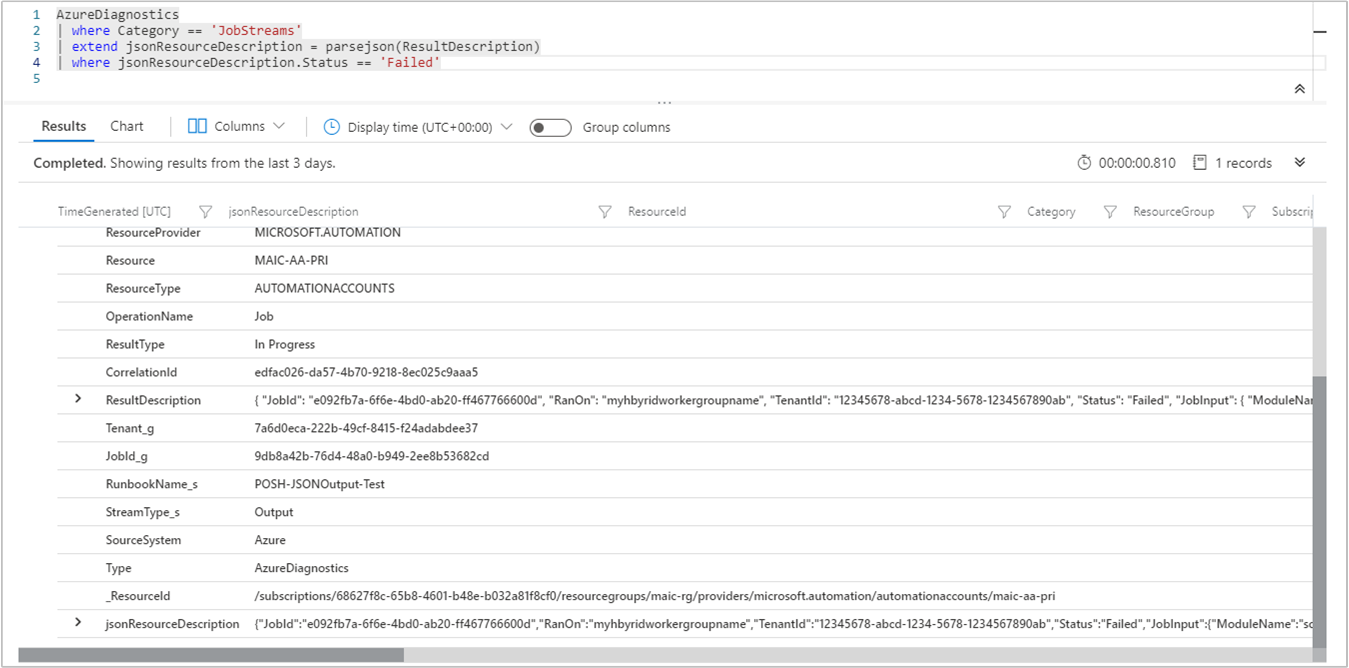
筛选已转换为 JSON 对象的作业状态输出
最近,我们更改了将自动化日志数据写入 Log Analytics 服务的 AzureDiagnostics 表的行为方式,在该表中不再将 JSON 属性分解为单独的字段。 如果 runbook 已配置为将 JSON 格式的输出流中的对象格式化为单独的列,则必须重新配置查询以将该字段解析为 JSON 对象,以便访问这些属性。 这是使用 parsejson 访问已知路径中的特定 JSON 元素来实现的。
例如,runbook 将 JSON 格式的输出流中的 ResultDescription 属性格式化为多个字段。 若要搜索在名为“Status”的字段中指定为失败状态的作业的状态,请使用此示例查询搜索状态为“Failed”的 ResultDescription:
AzureDiagnostics
| where Category == 'JobStreams'
| extend jsonResourceDescription = parse_json(ResultDescription)
| where jsonResourceDescription.Status == 'Failed'
后续步骤
- 若要了解如何使用 Azure Monitor 日志构建搜索查询和查看自动化作业日志,请参阅 Azure Monitor 日志中的日志搜索。
- 若要了解如何从 Runbook 创建和检索输出及错误消息,请参阅监视 Runbook 输出。
- 若要详细了解 Runbook 执行情况、Runbook 作业的监视方式以及其他技术详细信息,请参阅在 Azure 自动化中执行 Runbook。
- 若要详细了解 Azure Monitor 日志和数据收集源,请参阅“在 Azure Monitor 日志中收集 Azure 存储数据”概述。
- 若在排查 Log Analytics 问题时需要帮助,请参阅排查 Log Analytics 不再收集数据的原因。