Note
Access to this page requires authorization. You can try signing in or changing directories.
Access to this page requires authorization. You can try changing directories.
Note
Review the Application Insights SDK support guidance for our Classic API SDK support policy.
Caution
We recommend the Azure Monitor OpenTelemetry Distro for new applications or customers to power Azure Monitor Application Insights. The Azure Monitor OpenTelemetry Distro delivers a similar functionality and experience as the Application Insights SDK. It's possible to migrate from the Application Insights SDK using the migration guides for .NET, Node.js, and Python, but we are still working to add a few more features for backwards compatibility.
This article explains how to enable and configure Application Insights for .NET (ASP.NET, ASP.NET Core, and Worker Service) and Node.js applications. Application Insights can collect the following telemetry from your apps:
- Requests
- Dependencies
- Exceptions
- Performance counters
- Traces (Logs)
- Heartbeats
- Custom events & metrics (requires manual instrumentation)
- Page views (requires JavaScript SDK for webpages)
- Availability tests (requires manually setting up availability tests)
Supported scenarios
| Supported | ASP.NET | ASP.NET Core | Worker Service |
|---|---|---|---|
| Operating system | Windows | Windows, Linux, or macOS | Windows, Linux, or macOS |
| Hosting method | In-process (IIS or IIS Express) | In process or out of process | Console or background service (runs as a process, typically via dotnet CLI or as a Windows Service/Linux daemon) |
| Deployment method | Web Deploy, MSI, or manual file copy | Framework dependent or self-contained | Framework dependent or self-contained |
| Web server | Internet Information Services (IIS) | Internet Information Server (IIS) or Kestrel | Not applicable (no web server; designed for non-HTTP workloads such as messaging, background tasks, and console apps) |
| Hosting platform | Azure App Service (Windows), Azure Virtual Machines, or on-premises servers | The Web Apps feature of Azure App Service, Azure Virtual Machines, Docker, and Azure Kubernetes Service (AKS) | Azure Virtual Machines, Azure Kubernetes Service (AKS), containers, or any environment where .NET Core is supported |
| .NET version | .NET Framework 4.6.1 and later | All officially supported .NET versions that aren't in preview | All officially supported .NET versions that aren't in preview |
The Worker Service SDK doesn't do any telemetry collection by itself. Instead, it brings in other well-known Application Insights auto collectors like DependencyCollector, PerfCounterCollector, and ApplicationInsightsLoggingProvider. This SDK exposes extension methods on IServiceCollection to enable and configure telemetry collection.
Note
A worker service is a long-running background application that executes tasks outside of an HTTP request/response pipeline. The Application Insights SDK for Worker Service can be used in the newly introduced .NET Core Worker Service, background tasks in ASP.NET Core, and console apps like .NET Core and .NET Framework.
Add Application Insights
In this section
- Prerequisites
- Instrument your application with the Application Insights SDK
- Deploy the Application Insights Agent
Prerequisites
- An Azure subscription. If you don't have one already, create a Azure account.
- An Application Insights workspace-based resource.
- A functioning application.
Instrument your application with the Application Insights SDK
This section guides you through adding Application Insights to a template-based web app.
ASP.NET
Add the following NuGet packages and their dependencies to your project:
In some cases, the ApplicationInsights.config file is created for you automatically. If the file is already present, skip to step 4.
Create it yourself if it's missing. In the root directory of an ASP.NET application, create a new file called ApplicationInsights.config.
Copy the following XML configuration into your newly created file:
Expand to view the configuration
<?xml version="1.0" encoding="utf-8"?>
<ApplicationInsights xmlns="http://schemas.microsoft.com/ApplicationInsights/2013/Settings">
  <TelemetryInitializers>
    <Add Type="Microsoft.ApplicationInsights.DependencyCollector.HttpDependenciesParsingTelemetryInitializer, Microsoft.AI.DependencyCollector" />
    <Add Type="Microsoft.ApplicationInsights.WindowsServer.AzureRoleEnvironmentTelemetryInitializer, Microsoft.AI.WindowsServer" />
    <Add Type="Microsoft.ApplicationInsights.WindowsServer.BuildInfoConfigComponentVersionTelemetryInitializer, Microsoft.AI.WindowsServer" />
    <Add Type="Microsoft.ApplicationInsights.Web.WebTestTelemetryInitializer, Microsoft.AI.Web" />
    <Add Type="Microsoft.ApplicationInsights.Web.SyntheticUserAgentTelemetryInitializer, Microsoft.AI.Web">
      <!-- Extended list of bots:
            search|spider|crawl|Bot|Monitor|BrowserMob|BingPreview|PagePeeker|WebThumb|URL2PNG|ZooShot|GomezA|Google SketchUp|Read Later|KTXN|KHTE|Keynote|Pingdom|AlwaysOn|zao|borg|oegp|silk|Xenu|zeal|NING|htdig|lycos|slurp|teoma|voila|yahoo|Sogou|CiBra|Nutch|Java|JNLP|Daumoa|Genieo|ichiro|larbin|pompos|Scrapy|snappy|speedy|vortex|favicon|indexer|Riddler|scooter|scraper|scrubby|WhatWeb|WinHTTP|voyager|archiver|Icarus6j|mogimogi|Netvibes|altavista|charlotte|findlinks|Retreiver|TLSProber|WordPress|wsr-agent|http client|Python-urllib|AppEngine-Google|semanticdiscovery|facebookexternalhit|web/snippet|Google-HTTP-Java-Client-->
      <Filters>search|spider|crawl|Bot|Monitor|AlwaysOn</Filters>
    </Add>
    <Add Type="Microsoft.ApplicationInsights.Web.ClientIpHeaderTelemetryInitializer, Microsoft.AI.Web" />
    <Add Type="Microsoft.ApplicationInsights.Web.AzureAppServiceRoleNameFromHostNameHeaderInitializer, Microsoft.AI.Web" />
    <Add Type="Microsoft.ApplicationInsights.Web.OperationNameTelemetryInitializer, Microsoft.AI.Web" />
    <Add Type="Microsoft.ApplicationInsights.Web.OperationCorrelationTelemetryInitializer, Microsoft.AI.Web" />
    <Add Type="Microsoft.ApplicationInsights.Web.UserTelemetryInitializer, Microsoft.AI.Web" />
    <Add Type="Microsoft.ApplicationInsights.Web.AuthenticatedUserIdTelemetryInitializer, Microsoft.AI.Web" />
    <Add Type="Microsoft.ApplicationInsights.Web.AccountIdTelemetryInitializer, Microsoft.AI.Web" />
    <Add Type="Microsoft.ApplicationInsights.Web.SessionTelemetryInitializer, Microsoft.AI.Web" />
  </TelemetryInitializers>
  <TelemetryModules>
    <Add Type="Microsoft.ApplicationInsights.DependencyCollector.DependencyTrackingTelemetryModule, Microsoft.AI.DependencyCollector">
      <ExcludeComponentCorrelationHttpHeadersOnDomains>
        <!--
        Requests to the following hostnames will not be modified by adding correlation headers.
        Add entries here to exclude additional hostnames.
        NOTE: this configuration will be lost upon NuGet upgrade.
        -->
        <Add>core.chinacloudapi.cn</Add>
        <Add>core.chinacloudapi.cn</Add>
        <Add>core.cloudapi.de</Add>
        <Add>core.usgovcloudapi.net</Add>
      </ExcludeComponentCorrelationHttpHeadersOnDomains>
      <IncludeDiagnosticSourceActivities>
        <Add>Microsoft.Azure.EventHubs</Add>
        <Add>Azure.Messaging.ServiceBus</Add>
      </IncludeDiagnosticSourceActivities>
    </Add>
    <Add Type="Microsoft.ApplicationInsights.Extensibility.PerfCounterCollector.PerformanceCollectorModule, Microsoft.AI.PerfCounterCollector">
      <!--
      Use the following syntax here to collect additional performance counters:

      <Counters>
        <Add PerformanceCounter="\Process(??APP_WIN32_PROC??)\Handle Count" ReportAs="Process handle count" />
        ...
      </Counters>

      PerformanceCounter must be either \CategoryName(InstanceName)\CounterName or \CategoryName\CounterName

      NOTE: performance counters configuration will be lost upon NuGet upgrade.

      The following placeholders are supported as InstanceName:
        ??APP_WIN32_PROC?? - instance name of the application process for Win32 counters.
        ??APP_W3SVC_PROC?? - instance name of the application IIS worker process for IIS/ASP.NET counters.
        ??APP_CLR_PROC?? - instance name of the application CLR process for .NET counters.
      -->
    </Add>
    <Add Type="Microsoft.ApplicationInsights.Extensibility.PerfCounterCollector.QuickPulse.QuickPulseTelemetryModule, Microsoft.AI.PerfCounterCollector" />
    <Add Type="Microsoft.ApplicationInsights.WindowsServer.AppServicesHeartbeatTelemetryModule, Microsoft.AI.WindowsServer" />
    <Add Type="Microsoft.ApplicationInsights.WindowsServer.AzureInstanceMetadataTelemetryModule, Microsoft.AI.WindowsServer">
      <!--
      Remove individual fields collected here by adding them to the ApplicationInsighs.HeartbeatProvider
      with the following syntax:

      <Add Type="Microsoft.ApplicationInsights.Extensibility.Implementation.Tracing.DiagnosticsTelemetryModule, Microsoft.ApplicationInsights">
        <ExcludedHeartbeatProperties>
          <Add>osType</Add>
          <Add>location</Add>
          <Add>name</Add>
          <Add>offer</Add>
          <Add>platformFaultDomain</Add>
          <Add>platformUpdateDomain</Add>
          <Add>publisher</Add>
          <Add>sku</Add>
          <Add>version</Add>
          <Add>vmId</Add>
          <Add>vmSize</Add>
          <Add>subscriptionId</Add>
          <Add>resourceGroupName</Add>
          <Add>placementGroupId</Add>
          <Add>tags</Add>
          <Add>vmScaleSetName</Add>
        </ExcludedHeartbeatProperties>
      </Add>

      NOTE: exclusions will be lost upon upgrade.
      -->
    </Add>
    <Add Type="Microsoft.ApplicationInsights.WindowsServer.DeveloperModeWithDebuggerAttachedTelemetryModule, Microsoft.AI.WindowsServer" />
    <Add Type="Microsoft.ApplicationInsights.WindowsServer.UnhandledExceptionTelemetryModule, Microsoft.AI.WindowsServer" />
    <Add Type="Microsoft.ApplicationInsights.WindowsServer.UnobservedExceptionTelemetryModule, Microsoft.AI.WindowsServer">
      <!--</Add>
    <Add Type="Microsoft.ApplicationInsights.WindowsServer.FirstChanceExceptionStatisticsTelemetryModule, Microsoft.AI.WindowsServer">-->
    </Add>
    <Add Type="Microsoft.ApplicationInsights.Web.RequestTrackingTelemetryModule, Microsoft.AI.Web">
      <Handlers>
        <!--
        Add entries here to filter out additional handlers:

        NOTE: handler configuration will be lost upon NuGet upgrade.
        -->
        <Add>Microsoft.VisualStudio.Web.PageInspector.Runtime.Tracing.RequestDataHttpHandler</Add>
        <Add>System.Web.StaticFileHandler</Add>
        <Add>System.Web.Handlers.AssemblyResourceLoader</Add>
        <Add>System.Web.Optimization.BundleHandler</Add>
        <Add>System.Web.Script.Services.ScriptHandlerFactory</Add>
        <Add>System.Web.Handlers.TraceHandler</Add>
        <Add>System.Web.Services.Discovery.DiscoveryRequestHandler</Add>
        <Add>System.Web.HttpDebugHandler</Add>
      </Handlers>
    </Add>
    <Add Type="Microsoft.ApplicationInsights.Web.ExceptionTrackingTelemetryModule, Microsoft.AI.Web" />
    <Add Type="Microsoft.ApplicationInsights.Web.AspNetDiagnosticTelemetryModule, Microsoft.AI.Web" />
  </TelemetryModules>
  <ApplicationIdProvider Type="Microsoft.ApplicationInsights.Extensibility.Implementation.ApplicationId.ApplicationInsightsApplicationIdProvider, Microsoft.ApplicationInsights" />
  <TelemetrySinks>
    <Add Name="default">
      <TelemetryProcessors>
        <Add Type="Microsoft.ApplicationInsights.Extensibility.PerfCounterCollector.QuickPulse.QuickPulseTelemetryProcessor, Microsoft.AI.PerfCounterCollector" />
        <Add Type="Microsoft.ApplicationInsights.Extensibility.AutocollectedMetricsExtractor, Microsoft.ApplicationInsights" />
        <Add Type="Microsoft.ApplicationInsights.WindowsServer.TelemetryChannel.AdaptiveSamplingTelemetryProcessor, Microsoft.AI.ServerTelemetryChannel">
          <MaxTelemetryItemsPerSecond>5</MaxTelemetryItemsPerSecond>
          <ExcludedTypes>Event</ExcludedTypes>
        </Add>
        <Add Type="Microsoft.ApplicationInsights.WindowsServer.TelemetryChannel.AdaptiveSamplingTelemetryProcessor, Microsoft.AI.ServerTelemetryChannel">
          <MaxTelemetryItemsPerSecond>5</MaxTelemetryItemsPerSecond>
          <IncludedTypes>Event</IncludedTypes>
        </Add>
        <!--
          Adjust the include and exclude examples to specify the desired semicolon-delimited types. (Dependency, Event, Exception, PageView, Request, Trace)
        -->
      </TelemetryProcessors>
      <TelemetryChannel Type="Microsoft.ApplicationInsights.WindowsServer.TelemetryChannel.ServerTelemetryChannel, Microsoft.AI.ServerTelemetryChannel" />
    </Add>
  </TelemetrySinks>
  <!--
    Learn more about Application Insights configuration with ApplicationInsights.config here:
    http://go.microsoft.com/fwlink/?LinkID=513840
  -->
  <ConnectionString>Copy the connection string from your Application Insights resource</ConnectionString>
</ApplicationInsights>
Add the connection string, which can be done in two ways:
(Recommended) Set the connection string in configuration.
Before the closing
</ApplicationInsights>tag in ApplicationInsights.config, add the connection string for your Application Insights resource. You can find your connection string on the overview pane of the newly created Application Insights resource.<ConnectionString>Copy the connection string from your Application Insights resource</ConnectionString>Set the connection string in code.
Provide a connection string in your program.cs class.
var configuration = new TelemetryConfiguration
{
    ConnectionString = "Copy the connection string from your Application Insights resource"
};
At the same level of your project as the ApplicationInsights.config file, create a folder called ErrorHandler with a new C# file called AiHandleErrorAttribute.cs. The contents of the file look like this:
using System;
using System.Web.Mvc;
using Microsoft.ApplicationInsights;

namespace WebApplication10.ErrorHandler //namespace will vary based on your project name
{
    [AttributeUsage(AttributeTargets.Class | AttributeTargets.Method, Inherited = true, AllowMultiple = true)]
    public class AiHandleErrorAttribute : HandleErrorAttribute
    {
        public override void OnException(ExceptionContext filterContext)
        {
            if (filterContext != null && filterContext.HttpContext != null && filterContext.Exception != null)
            {
                //If customError is Off, then AI HTTPModule will report the exception
                if (filterContext.HttpContext.IsCustomErrorEnabled)
                {
                    var ai = new TelemetryClient();
                    ai.TrackException(filterContext.Exception);
                }
            }
            base.OnException(filterContext);
        }
    }
}
In the App_Start folder, open the FilterConfig.cs file and change it to match the sample:
using System.Web;
using System.Web.Mvc;

namespace WebApplication10 //Namespace will vary based on project name
{
    public class FilterConfig
    {
        public static void RegisterGlobalFilters(GlobalFilterCollection filters)
        {
            filters.Add(new ErrorHandler.AiHandleErrorAttribute());
        }
    }
}
If Web.config is already updated, skip this step. Otherwise, update the file as follows:
Expand to view the configuration
<?xml version="1.0" encoding="utf-8"?> <!-- For more information on how to configure your ASP.NET application, please visit https://go.microsoft.com/fwlink/?LinkId=301880 --> <configuration> <appSettings> <add key="webpages:Version" value="3.0.0.0" /> <add key="webpages:Enabled" value="false" /> <add key="ClientValidationEnabled" value="true" /> <add key="UnobtrusiveJavaScriptEnabled" value="true" /> </appSettings> <system.web> <compilation debug="true" targetFramework="4.7.2" /> <httpRuntime targetFramework="4.7.2" /> <!-- Code added for Application Insights start --> <httpModules> <add name="TelemetryCorrelationHttpModule" type="Microsoft.AspNet.TelemetryCorrelation.TelemetryCorrelationHttpModule, Microsoft.AspNet.TelemetryCorrelation" /> <add name="ApplicationInsightsWebTracking" type="Microsoft.ApplicationInsights.Web.ApplicationInsightsHttpModule, Microsoft.AI.Web" /> </httpModules> <!-- Code added for Application Insights end --> </system.web> <runtime> <assemblyBinding xmlns="urn:schemas-microsoft-com:asm.v1"> <dependentAssembly> <assemblyIdentity name="Antlr3.Runtime" publicKeyToken="eb42632606e9261f" /> <bindingRedirect oldVersion="0.0.0.0-3.5.0.2" newVersion="3.5.0.2" /> </dependentAssembly> <dependentAssembly> <assemblyIdentity name="Newtonsoft.Json" publicKeyToken="30ad4fe6b2a6aeed" /> <bindingRedirect oldVersion="0.0.0.0-12.0.0.0" newVersion="12.0.0.0" /> </dependentAssembly> <dependentAssembly> <assemblyIdentity name="System.Web.Optimization" publicKeyToken="31bf3856ad364e35" /> <bindingRedirect oldVersion="1.0.0.0-1.1.0.0" newVersion="1.1.0.0" /> </dependentAssembly> <dependentAssembly> <assemblyIdentity name="WebGrease" publicKeyToken="31bf3856ad364e35" /> <bindingRedirect oldVersion="0.0.0.0-1.6.5135.21930" newVersion="1.6.5135.21930" /> </dependentAssembly> <dependentAssembly> <assemblyIdentity name="System.Web.Helpers" publicKeyToken="31bf3856ad364e35" /> <bindingRedirect oldVersion="1.0.0.0-3.0.0.0" newVersion="3.0.0.0" /> </dependentAssembly> <dependentAssembly> <assemblyIdentity name="System.Web.WebPages" publicKeyToken="31bf3856ad364e35" /> <bindingRedirect oldVersion="1.0.0.0-3.0.0.0" newVersion="3.0.0.0" /> </dependentAssembly> <dependentAssembly> <assemblyIdentity name="System.Web.Mvc" publicKeyToken="31bf3856ad364e35" /> <bindingRedirect oldVersion="1.0.0.0-5.2.7.0" newVersion="5.2.7.0" /> </dependentAssembly> <!-- Code added for Application Insights start --> <dependentAssembly> <assemblyIdentity name="System.Memory" publicKeyToken="cc7b13ffcd2ddd51" culture="neutral" /> <bindingRedirect oldVersion="0.0.0.0-4.0.1.1" newVersion="4.0.1.1" /> </dependentAssembly> <!-- Code added for Application Insights end --> </assemblyBinding> </runtime> <system.codedom> <compilers> <compiler language="c#;cs;csharp" extension=".cs" type="Microsoft.CodeDom.Providers.DotNetCompilerPlatform.CSharpCodeProvider, Microsoft.CodeDom.Providers.DotNetCompilerPlatform, Version=2.0.1.0, Culture=neutral, PublicKeyToken=31bf3856ad364e35" warningLevel="4" compilerOptions="/langversion:default /nowarn:1659;1699;1701" /> <compiler language="vb;vbs;visualbasic;vbscript" extension=".vb" type="Microsoft.CodeDom.Providers.DotNetCompilerPlatform.VBCodeProvider, Microsoft.CodeDom.Providers.DotNetCompilerPlatform, Version=2.0.1.0, Culture=neutral, PublicKeyToken=31bf3856ad364e35" warningLevel="4" compilerOptions="/langversion:default /nowarn:41008 /define:_MYTYPE=\"Web\" /optionInfer+" /> </compilers> </system.codedom> <system.webServer> <validation validateIntegratedModeConfiguration="false" /> <!-- Code added for Application Insights start --> <modules> <remove name="TelemetryCorrelationHttpModule" /> <add name="TelemetryCorrelationHttpModule" type="Microsoft.AspNet.TelemetryCorrelation.TelemetryCorrelationHttpModule, Microsoft.AspNet.TelemetryCorrelation" preCondition="managedHandler" /> <remove name="ApplicationInsightsWebTracking" /> <add name="ApplicationInsightsWebTracking" type="Microsoft.ApplicationInsights.Web.ApplicationInsightsHttpModule, Microsoft.AI.Web" preCondition="managedHandler" /> </modules> <!-- Code added for Application Insights end --> </system.webServer> </configuration>
At this point, you successfully configured server-side application monitoring. If you run your web app, you see telemetry begin to appear in Application Insights.
ASP.NET Core
Install the Application Insights SDK NuGet package for ASP.NET Core.
We recommend that you always use the latest stable version. Find full release notes for the SDK on the open-source GitHub repo.
The following code sample shows the changes to add to your project's .csproj file:
<ItemGroup>
    <PackageReference Include="Microsoft.ApplicationInsights.AspNetCore" Version="2.21.0" />
</ItemGroup>
Add
AddApplicationInsightsTelemetry()to your program.cs class.Add
builder.Services.AddApplicationInsightsTelemetry();after theWebApplication.CreateBuilder()method, as in this example:// This method gets called by the runtime. Use this method to add services to the container. var builder = WebApplication.CreateBuilder(args); // The following line enables Application Insights telemetry collection. builder.Services.AddApplicationInsightsTelemetry(); // This code adds other services for your application. builder.Services.AddMvc(); var app = builder.Build();Add the connection string, which can be done in three ways:
(Recommended) Set the connection string in configuration.
Set the connection string in appsettings.json and make sure the configuration file is copied to the application root folder during publishing.
{
    "Logging": {
        "LogLevel": {
            "Default": "Information",
            "Microsoft.AspNetCore": "Warning"
        }
    },
    "AllowedHosts": "*",
    "ApplicationInsights": {
        "ConnectionString": "<YOUR-CONNECTION-STRING>"
    }
}
Set the connection string in the
APPLICATIONINSIGHTS_CONNECTION_STRINGenvironment variable orApplicationInsights:ConnectionStringin the JSON configuration file.For example:
SET ApplicationInsights:ConnectionString = <Copy connection string from Application Insights Resource Overview>SET APPLICATIONINSIGHTS_CONNECTION_STRING = <Copy connection string from Application Insights Resource Overview>- Typically,
APPLICATIONINSIGHTS_CONNECTION_STRINGis used in web apps. It can also be used in all places where this SDK is supported.
Note
A connection string specified in code wins over the environment variable
APPLICATIONINSIGHTS_CONNECTION_STRING, which wins over other options.Set the connection string in code.
Provide a connection string as part of the
ApplicationInsightsServiceOptionsargument toAddApplicationInsightsTelemetryin your program.cs class.
User secrets and other configuration providers
If you want to store the connection string in ASP.NET Core user secrets or retrieve it from another configuration provider, you can use the overload with a Microsoft.Extensions.Configuration.IConfiguration parameter. An example parameter is services.AddApplicationInsightsTelemetry(Configuration);.
In Microsoft.ApplicationInsights.AspNetCore version 2.15.0 and later, calling services.AddApplicationInsightsTelemetry() automatically reads the connection string from Microsoft.Extensions.Configuration.IConfiguration of the application. There's no need to explicitly provide IConfiguration.
If IConfiguration loaded configuration from multiple providers, then services.AddApplicationInsightsTelemetry prioritizes configuration from appsettings.json, irrespective of the order in which providers are added. Use the services.AddApplicationInsightsTelemetry(IConfiguration) method to read configuration from IConfiguration without this preferential treatment for appsettings.json.
Worker Service
In this section
- Use Application Insights SDK for Worker Service
- .NET Core Worker Service application
- ASP.NET Core background tasks with hosted services
- .NET Core/.NET Framework console application
Use Application Insights SDK for Worker Service
Install the Microsoft.ApplicationInsights.WorkerService package to the application.
The following snippet shows the changes that must be added to your project's
.csprojfile:<ItemGroup> <PackageReference Include="Microsoft.ApplicationInsights.WorkerService" Version="2.22.0" /> </ItemGroup>Configure the connection string in the
APPLICATIONINSIGHTS_CONNECTION_STRINGenvironment variable or in configuration (appsettings.json).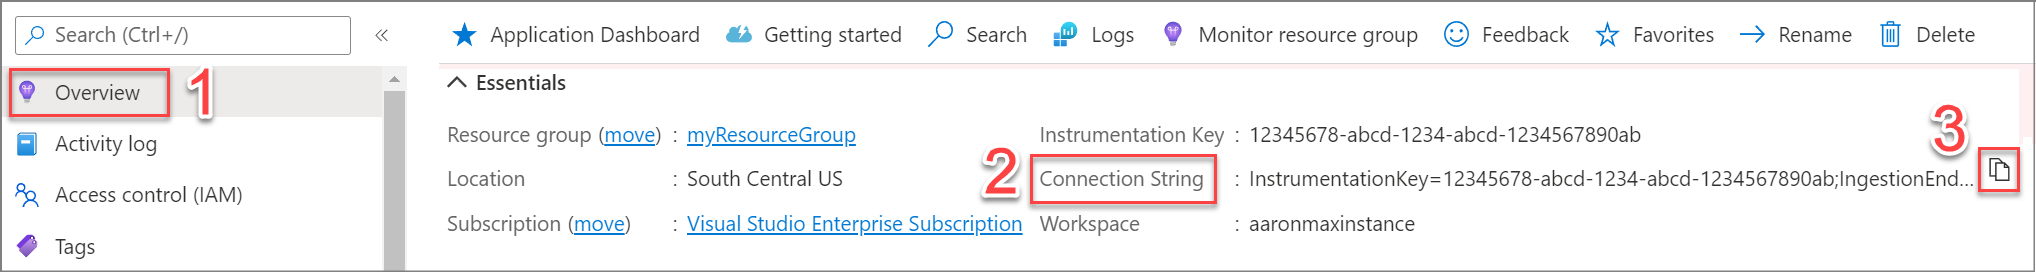
Retrieve an
ILoggerinstance orTelemetryClientinstance from the Dependency Injection (DI) container by callingserviceProvider.GetRequiredService<TelemetryClient>();or by using Constructor Injection. This step triggers setting up ofTelemetryConfigurationand autocollection modules.

Specific instructions for each type of application are described in the following sections.
.NET Core Worker Service application
The full example is shared at the NuGet website.
Create a new Worker Service project either by using a Visual Studio new project template or the command line
dotnet new worker.Add the Microsoft.ApplicationInsights.WorkerService package to the application.
Add
services.AddApplicationInsightsTelemetryWorkerService();to theCreateHostBuilder()method in yourProgram.csclass, as in this example:public static IHostBuilder CreateHostBuilder(string[] args) => Host.CreateDefaultBuilder(args) .ConfigureServices((hostContext, services) => { services.AddHostedService<Worker>(); services.AddApplicationInsightsTelemetryWorkerService(); });Modify your
Worker.csas per the following example:using Microsoft.ApplicationInsights; using Microsoft.ApplicationInsights.DataContracts; public class Worker : BackgroundService { private readonly ILogger<Worker> _logger; private TelemetryClient _telemetryClient; private static HttpClient _httpClient = new HttpClient(); public Worker(ILogger<Worker> logger, TelemetryClient tc) { _logger = logger; _telemetryClient = tc; } protected override async Task ExecuteAsync(CancellationToken stoppingToken) { while (!stoppingToken.IsCancellationRequested) { _logger.LogInformation("Worker running at: {time}", DateTimeOffset.Now); using (_telemetryClient.StartOperation<RequestTelemetry>("operation")) { _logger.LogWarning("A sample warning message. By default, logs with severity Warning or higher is captured by Application Insights"); _logger.LogInformation("Calling bing.com"); var res = await _httpClient.GetAsync("https://bing.com"); _logger.LogInformation("Calling bing completed with status:" + res.StatusCode); _telemetryClient.TrackEvent("Bing call event completed"); } await Task.Delay(1000, stoppingToken); } } }Set up the connection string.
Note
We recommend that you specify the connection string in configuration. The following code sample shows how to specify a connection string in
appsettings.json. Make sureappsettings.jsonis copied to the application root folder during publishing.{ "ApplicationInsights": { "ConnectionString" : "<YOUR-CONNECTION-STRING>" }, "Logging": { "LogLevel": { "Default": "Warning" } } }
Alternatively, specify the connection string in the APPLICATIONINSIGHTS_CONNECTION_STRING environment variable.
Typically, APPLICATIONINSIGHTS_CONNECTION_STRING specifies the connection string for applications deployed to web apps as web jobs.
Note
A connection string specified in code takes precedence over the environment variable APPLICATIONINSIGHTS_CONNECTION_STRING, which takes precedence over other options.
ASP.NET Core background tasks with hosted services
This document describes how to create background tasks in an ASP.NET Core application.
The full example is shared at this GitHub page.
Install the Microsoft.ApplicationInsights.WorkerService package to the application.
Add
services.AddApplicationInsightsTelemetryWorkerService();to theConfigureServices()method, as in this example:public static async Task Main(string[] args) { var host = new HostBuilder() .ConfigureAppConfiguration((hostContext, config) => { config.AddJsonFile("appsettings.json", optional: true); }) .ConfigureServices((hostContext, services) => { services.AddLogging(); services.AddHostedService<TimedHostedService>(); // connection string is read automatically from appsettings.json services.AddApplicationInsightsTelemetryWorkerService(); }) .UseConsoleLifetime() .Build(); using (host) { // Start the host await host.StartAsync(); // Wait for the host to shutdown await host.WaitForShutdownAsync(); } }The following code is for
TimedHostedService, where the background task logic resides:using Microsoft.ApplicationInsights; using Microsoft.ApplicationInsights.DataContracts; public class TimedHostedService : IHostedService, IDisposable { private readonly ILogger _logger; private Timer _timer; private TelemetryClient _telemetryClient; private static HttpClient httpClient = new HttpClient(); public TimedHostedService(ILogger<TimedHostedService> logger, TelemetryClient tc) { _logger = logger; this._telemetryClient = tc; } public Task StartAsync(CancellationToken cancellationToken) { _logger.LogInformation("Timed Background Service is starting."); _timer = new Timer(DoWork, null, TimeSpan.Zero, TimeSpan.FromSeconds(1)); return Task.CompletedTask; } private void DoWork(object state) { _logger.LogInformation("Worker running at: {time}", DateTimeOffset.Now); using (_telemetryClient.StartOperation<RequestTelemetry>("operation")) { _logger.LogWarning("A sample warning message. By default, logs with severity Warning or higher is captured by Application Insights"); _logger.LogInformation("Calling bing.com"); var res = httpClient.GetAsync("https://bing.com").GetAwaiter().GetResult(); _logger.LogInformation("Calling bing completed with status:" + res.StatusCode); _telemetryClient.TrackEvent("Bing call event completed"); } } }Set up the connection string. Use the same
appsettings.jsonfrom the preceding .NET Worker Service example.
.NET Core/.NET Framework console application
As mentioned in the beginning of this article, the new package can be used to enable Application Insights telemetry from even a regular console application. This package targets netstandard2.0, so it can be used for console apps in .NET Core or higher, and .NET Framework or higher.
The full example is shared at this GitHub page.
Install the Microsoft.ApplicationInsights.WorkerService package to the application.
Modify Program.cs as shown in the following example:
    using Microsoft.ApplicationInsights;
    using Microsoft.ApplicationInsights.DataContracts;
    using Microsoft.ApplicationInsights.WorkerService;
    using Microsoft.Extensions.DependencyInjection;
    using Microsoft.Extensions.Logging;
    using System;
    using System.Net.Http;
    using System.Threading.Tasks;

    namespace WorkerSDKOnConsole
    {
        class Program
        {
            static async Task Main(string[] args)
            {
                // Create the DI container.
                IServiceCollection services = new ServiceCollection();

                // Being a regular console app, there is no appsettings.json or configuration providers enabled by default.
                // Hence connection string and any changes to default logging level must be specified here.
                services.AddLogging(loggingBuilder => loggingBuilder.AddFilter<Microsoft.Extensions.Logging.ApplicationInsights.ApplicationInsightsLoggerProvider>("Category", LogLevel.Information));
                services.AddApplicationInsightsTelemetryWorkerService((ApplicationInsightsServiceOptions options) => options.ConnectionString = "<YOUR-CONNECTION-STRING>");

                // To pass a connection string
                // - aiserviceoptions must be created
                // - set connectionstring on it
                // - pass it to AddApplicationInsightsTelemetryWorkerService()

                // Build ServiceProvider.
                IServiceProvider serviceProvider = services.BuildServiceProvider();

                // Obtain logger instance from DI.
                ILogger<Program> logger = serviceProvider.GetRequiredService<ILogger<Program>>();

                // Obtain TelemetryClient instance from DI, for additional manual tracking or to flush.
                var telemetryClient = serviceProvider.GetRequiredService<TelemetryClient>();

                var httpClient = new HttpClient();

                while (true) // This app runs indefinitely. Replace with actual application termination logic.
                {
                    logger.LogInformation("Worker running at: {time}", DateTimeOffset.Now);

                    // Replace with a name which makes sense for this operation.
                    using (telemetryClient.StartOperation<RequestTelemetry>("operation"))
                    {
                        logger.LogWarning("A sample warning message. By default, logs with severity Warning or higher is captured by Application Insights");
                        logger.LogInformation("Calling bing.com");
                        var res = await httpClient.GetAsync("https://bing.com");
                        logger.LogInformation("Calling bing completed with status:" + res.StatusCode);
                        telemetryClient.TrackEvent("Bing call event completed");
                    }

                    await Task.Delay(1000);
                }

                // Explicitly call Flush() followed by sleep is required in console apps.
                // This is to ensure that even if application terminates, telemetry is sent to the back-end.
                telemetryClient.Flush();
                Task.Delay(5000).Wait();
            }
        }
    }
This console application also uses the same default TelemetryConfiguration. It can be customized in the same way as the examples in earlier sections.
Deploy the Application Insights Agent for on-premises servers
In this section
- Get started - To get started with concise code samples.
- Detailed instructions - For a deep dive on how to get started.
- API references - For PowerShell API reference.
Application Insights Agent is a PowerShell module published to the PowerShell Gallery. It replaces Status Monitor. Telemetry is sent to the Azure portal, where you can monitor your app.
For a complete list of supported autoinstrumentation scenarios, see Supported environments, languages, and resource providers.
Note
The module currently supports codeless instrumentation of ASP.NET and ASP.NET Core web apps hosted with Internet Information Server (IIS). Use an SDK to instrument Java and Node.js applications.
Note
Client-side monitoring is enabled by default for ASP.NET Core apps. If you want to disable client-side monitoring, define an environment variable in the server with the following information:
- Name:
APPINSIGHTS_JAVASCRIPT_ENABLED - Value:
false
Getting started
This section contains the quickstart commands that are expected to work for most environments. The instructions depend on PowerShell Gallery to distribute updates. These commands support the PowerShell -Proxy parameter.
For an explanation of these commands, customization instructions, and information about troubleshooting, see the detailed instructions.
If you don't have an Azure subscription, create a Trial before you begin.
Option 1: Download and install Application Insights Agent via PowerShell Gallery
Note
For prerequisites that you might need, see PowerShell Gallery Transport Layer Security (TLS) support.
Install the module (run as admin):
Set-ExecutionPolicy -ExecutionPolicy RemoteSigned -Scope Process -Force
Install-PackageProvider -Name NuGet -MinimumVersion 2.8.5.201 -Force
Set-PSRepository -Name "PSGallery" -InstallationPolicy Trusted
Install-Module -Name PowerShellGet -Force
Install Application Insights Agent (run as admin):
Set-ExecutionPolicy -ExecutionPolicy RemoteSigned -Scope Process -Force
Install-Module -Name Az.ApplicationMonitor -AllowPrerelease -AcceptLicense
Note
The
AllowPrereleaseswitch in theInstall-Modulecmdlet allows installation of the beta release.For more information, see Install-Module.
Enable monitoring:
Set-ExecutionPolicy -ExecutionPolicy RemoteSigned -Scope Process -Force
Enable-ApplicationInsightsMonitoring -ConnectionString 'InstrumentationKey=00000000-0000-0000-0000-000000000000;IngestionEndpoint=https://xxxx.applicationinsights.azure.cn/'
Option 2: Download and install the Application Insights agent manually (offline option)
Manually download the latest version of the module from PowerShell Gallery.
Unzip and install Application Insights Agent:
$pathToNupkg = "C:\Users\t\Desktop\Az.ApplicationMonitor.0.3.0-alpha.nupkg"
$pathToZip = ([io.path]::ChangeExtension($pathToNupkg, "zip"))
$pathToNupkg | rename-item -newname $pathToZip
$pathInstalledModule = "$Env:ProgramFiles\WindowsPowerShell\Modules\Az.ApplicationMonitor"
Expand-Archive -LiteralPath $pathToZip -DestinationPath $pathInstalledModule
Enable monitoring:
Enable-ApplicationInsightsMonitoring -ConnectionString 'InstrumentationKey=00000000-0000-0000-0000-000000000000;IngestionEndpoint=https://xxxx.applicationinsights.azure.cn/'
Detailed instructions
This section describes how to onboard to the PowerShell Gallery and download the ApplicationMonitor module. Included are the most common parameters that you need to get started. We also provide manual download instructions in case you don't have internet access.
Run PowerShell as Admin with an elevated execution policy
Important
PowerShell needs Administrator-level permissions to make changes to your computer.
Execution policy
- Description: By default, running PowerShell scripts is disabled. We recommend allowing RemoteSigned scripts for only the Current scope.
- Reference: About Execution Policies and Set-ExecutionPolicy.
- Command:
Set-ExecutionPolicy -ExecutionPolicy RemoteSigned -Scope Process. - Optional parameter:
-Force. Bypasses the confirmation prompt.
Example errors
Install-Module : The 'Install-Module' command was found in the module 'PowerShellGet', but the module could not be
loaded. For more information, run 'Import-Module PowerShellGet'.

Import-Module : File C:\Program Files\WindowsPowerShell\Modules\PackageManagement\1.3.1\PackageManagement.psm1 cannot
be loaded because running scripts is disabled on this system. For more information, see about_Execution_Policies at https://go.microsoft.com/fwlink/?LinkID=135170.
Prerequisites for PowerShell
Audit your instance of PowerShell by running the $PSVersionTable command.
This command produces the following output:
Name                           Value
----                           -----
PSVersion                      5.1.17763.316
PSEdition                      Desktop
PSCompatibleVersions           {1.0, 2.0, 3.0, 4.0...}
BuildVersion                   10.0.17763.316
CLRVersion                     4.0.30319.42000
WSManStackVersion              3.0
PSRemotingProtocolVersion      2.3
SerializationVersion           1.1.0.1
These instructions were written and tested on a computer running Windows 10 and the following versions.
Prerequisites for PowerShell Gallery
These steps prepare your server to download modules from PowerShell Gallery.
Note
PowerShell Gallery is supported on Windows 10, Windows Server 2016, and PowerShell 6+. For information about earlier versions, see Installing PowerShellGet.
Run PowerShell as Admin with an elevated execution policy.
Install the NuGet package provider.
- Description: You need this provider to interact with NuGet-based repositories like PowerShell Gallery.
- Reference: Install-PackageProvider.
- Command:
Install-PackageProvider -Name NuGet -MinimumVersion 2.8.5.201. - Optional parameters:
-Proxy. Specifies a proxy server for the request.-Force. Bypasses the confirmation prompt.
You receive this prompt if NuGet isn't set up:
NuGet provider is required to continue
PowerShellGet requires NuGet provider version '2.8.5.201' or newer to interact with NuGet-based repositories.
The NuGet provider must be available in 'C:\Program Files\PackageManagement\ProviderAssemblies' or
'C:\Users\t\AppData\Local\PackageManagement\ProviderAssemblies'. You can also install the NuGet provider by running
'Install-PackageProvider -Name NuGet -MinimumVersion 2.8.5.201 -Force'. Do you want PowerShellGet to install and import
the NuGet provider now?
[Y] Yes  [N] No  [S] Suspend  [?] Help (default is "Y"):
Configure PowerShell Gallery as a trusted repository.
- Description: By default, PowerShell Gallery is an untrusted repository.
- Reference: Set-PSRepository.
- Command:
Set-PSRepository -Name "PSGallery" -InstallationPolicy Trusted. - Optional parameter:
-Proxy. Specifies a proxy server for the request.
You receive this prompt if PowerShell Gallery isn't trusted:
Untrusted repository
You are installing the modules from an untrusted repository.
If you trust this repository, change its InstallationPolicy value
by running the Set-PSRepository cmdlet. Are you sure you want to
install the modules from 'PSGallery'?
[Y] Yes  [A] Yes to All  [N] No  [L] No to All  [S] Suspend  [?] Help (default is "N"):
You can confirm this change and audit all
PSRepositoriesby running theGet-PSRepositorycommand.Install the newest version of PowerShellGet.
- Description: This module contains the tooling used to get other modules from PowerShell Gallery. Version 1.0.0.1 ships with Windows 10 and Windows Server. Version 1.6.0 or higher is required. To determine which version is installed, run the
Get-Command -Module PowerShellGetcommand. - Reference: Installing PowerShellGet.
- Command:
Install-Module -Name PowerShellGet. - Optional parameters:
-Proxy. Specifies a proxy server for the request.-Force. Bypasses the "already installed" warning and installs the latest version.
You receive this error if you're not using the newest version of PowerShellGet:
Install-Module : A parameter cannot be found that matches parameter name 'AllowPrerelease'. At line:1 char:20 Install-Module abc -AllowPrerelease ~~~~~~~~~~~~~~~~ CategoryInfo : InvalidArgument: (:) [Install-Module], ParameterBindingException FullyQualifiedErrorId : NamedParameterNotFound,Install-Module- Description: This module contains the tooling used to get other modules from PowerShell Gallery. Version 1.0.0.1 ships with Windows 10 and Windows Server. Version 1.6.0 or higher is required. To determine which version is installed, run the
Restart PowerShell. You can't load the new version in the current session. New PowerShell sessions load the latest version of PowerShellGet.
Option 1: Download and install the module via PowerShell Gallery
These steps download the Az.ApplicationMonitor module from PowerShell Gallery.
- Ensure that all prerequisites for PowerShell Gallery are met.
- Run PowerShell as Admin with an elevated execution policy.
- Install the Az.ApplicationMonitor module.
- Reference: Install-Module.
- Command:
Install-Module -Name Az.ApplicationMonitor. - Optional parameters:
-Proxy. Specifies a proxy server for the request.-AllowPrerelease. Allows installation of alpha and beta releases.-AcceptLicense. Bypasses the "Accept License" prompt-Force. Bypasses the "Untrusted Repository" warning.
Option 2: Download and install the module manually (offline option)
If for any reason you can't connect to the PowerShell module, you can manually download and install the Az.ApplicationMonitor module.
Manually download the latest nupkg file
- Go to https://www.powershellgallery.com/packages/Az.ApplicationMonitor.
- Select the latest version of the file in the Version History table.
- Under Installation Options, select Manual Download.
Option 2.1: Install into a PowerShell modules directory
Install the manually downloaded PowerShell module into a PowerShell directory so it's discoverable by PowerShell sessions. For more information, see Installing a PowerShell Module.
Unzip nupkg as a zip file by using Expand-Archive (v1.0.1.0)
Description: The base version of Microsoft.PowerShell.Archive (v1.0.1.0) can't unzip nupkg files. Rename the file with the .zip extension.
Reference: Expand-Archive.
Command:
$pathToNupkg = "C:\az.applicationmonitor.0.3.0-alpha.nupkg"
$pathToZip = ([io.path]::ChangeExtension($pathToNupkg, "zip"))
$pathToNupkg | rename-item -newname $pathToZip
$pathInstalledModule = "$Env:ProgramFiles\WindowsPowerShell\Modules\az.applicationmonitor"
Expand-Archive -LiteralPath $pathToZip -DestinationPath $pathInstalledModule
Unzip nupkg by using Expand-Archive (v1.1.0.0)
Description: Use a current version of Expand-Archive to unzip nupkg files without changing the extension.
Reference: Expand-Archive and Microsoft.PowerShell.Archive.
Command:
$pathToNupkg = "C:\az.applicationmonitor.0.2.1-alpha.nupkg"
$pathInstalledModule = "$Env:ProgramFiles\WindowsPowerShell\Modules\az.applicationmonitor"
Expand-Archive -LiteralPath $pathToNupkg -DestinationPath $pathInstalledModule
Option 2.2: Unzip and import nupkg manually
Install the manually downloaded PowerShell module into a PowerShell directory so it's discoverable by PowerShell sessions. For more information, see Installing a PowerShell Module.
If you're installing the module into any other directory, manually import the module by using Import-Module.
Important
Dynamic link libraries (DLLs) install via relative paths. Store the contents of the package in your intended runtime directory and confirm that access permissions allow read but not write.
- Change the extension to ".zip" and extract the contents of the package into your intended installation directory.
- Find the file path of Az.ApplicationMonitor.psd1.
- Run PowerShell as Admin with an elevated execution policy.
- Load the module by using the
Import-Module Az.ApplicationMonitor.psd1command.
Route traffic through a proxy
When you monitor a computer on your private intranet, you need to route HTTP traffic through a proxy.
The PowerShell commands to download and install Az.ApplicationMonitor from the PowerShell Gallery support a -Proxy parameter.
Review the preceding instructions when you write your installation scripts.
The Application Insights SDK needs to send your app's telemetry to Microsoft. We recommend that you configure proxy settings for your app in your web.config file. For more information, see How do I achieve proxy passthrough?.
Enable monitoring
Use the Enable-ApplicationInsightsMonitoring command to enable monitoring.
See the API reference for a detailed description of how to use this cmdlet.
API reference
Important
- The following cmdlets require a PowerShell session with Admin permissions and an elevated execution policy. For more information, see Run PowerShell as administrator with an elevated execution policy.
- The following cmdlets require that you review and accept our license and privacy statement.
- The instrumentation engine adds more overhead and is off by default.
This section describes the following cmdlets, which are members of the Az.ApplicationMonitor PowerShell module:
Note
Expand any of the sections below for more information, including examples, parameters, and output.
Enable-InstrumentationEngine
Enables the instrumentation engine by setting some registry keys. Restart IIS for the changes to take effect.
The instrumentation engine can supplement data collected by the .NET Software Development Kits (SDKs). It collects events and messages that describe the execution of a managed process. These events and messages include dependency result codes, HTTP verbs, and SQL command text.
Enable the instrumentation engine if:
- You already enabled monitoring with the
Enablecmdlet but didn't enable the instrumentation engine. - You manually instrumented your app with the .NET SDKs and want to collect extra telemetry.
Examples
Enable-InstrumentationEngine
Parameters
| Parameter | Description |
|---|---|
| -AcceptLicense | Optional. Use this switch to accept the license and privacy statement in headless installations. |
| -Verbose | Common parameter. Use this switch to output detailed logs. |
Output
Example output from successfully enabling the instrumentation engine:
Configuring IIS Environment for instrumentation engine...
Configuring registry for instrumentation engine...
Enable-ApplicationInsightsMonitoring
Enables codeless attach monitoring of IIS apps on a target computer.
This cmdlet modifies the IIS applicationHost.config and sets some registry keys. It creates an applicationinsights.ikey.config file, which defines the instrumentation key used by each app. IIS loads the RedfieldModule on startup, which injects the Application Insights SDK into applications as the applications start. Restart IIS for your changes to take effect.
After you enable monitoring, we recommend that you use Live Metrics to quickly check if your app is sending us telemetry.
Examples
Example with a single connection string
In this example, all apps on the current computer are provided with a single connection string.
Enable-ApplicationInsightsMonitoring -ConnectionString 'InstrumentationKey=xxxxxxxx-xxxx-xxxx-xxxx-xxxxxxxxxxxx;IngestionEndpoint=https://xxxx.applicationinsights.azure.cn/'
Example with a single instrumentation key
In this example, all apps on the current computer are provided with a single instrumentation key.
Enable-ApplicationInsightsMonitoring -InstrumentationKey xxxxxxxx-xxxx-xxxx-xxxx-xxxxxxxxxxxx
Example with an instrumentation key map
In this example:
MachineFiltermatches the current computer by using the'.*'wildcard.AppFilter='WebAppExclude'provides anullinstrumentation key. The specified app isn't instrumented.AppFilter='WebAppOne'assigns the specified app a unique instrumentation key.AppFilter='WebAppTwo'assigns the specified app a unique instrumentation key.AppFilteruses the'.*'wildcard to match any web apps it doesn't already match and assigns a default instrumentation key.- Spaces are added for readability.
Enable-ApplicationInsightsMonitoring -InstrumentationKeyMap `
    ` @(@{MachineFilter='.*';AppFilter='WebAppExclude'},
        ` @{MachineFilter='.*';AppFilter='WebAppOne';InstrumentationSettings=@{InstrumentationKey='xxxxxxxx-xxxx-xxxx-xxxx-xxxxxxxxxxx1'}},
        ` @{MachineFilter='.*';AppFilter='WebAppTwo';InstrumentationSettings=@{InstrumentationKey='xxxxxxxx-xxxx-xxxx-xxxx-xxxxxxxxxxx2'}},
        ` @{MachineFilter='.*';AppFilter='.*';InstrumentationSettings=@{InstrumentationKey='xxxxxxxx-xxxx-xxxx-xxxx-xxxxxdefault'}})
- MachineFilter is a required C# regex of the computer or virtual machine (VM) name.
- '.*' matches all
- 'ComputerName' matches only computers with the exact name specified.
- AppFilter is a required C# regex of the IIS Site Name. You can get a list of sites on your server by running the command get-iissite.
- '.*' matches all
- 'SiteName' matches only the IIS Site with the exact name specified.
- InstrumentationKey is required to enable monitoring of apps that match the preceding two filters.
- Leave this value null if you want to define rules to exclude monitoring.
Parameters
| Parameter | Description |
|---|---|
| -EnableInstrumentationEngine | Optional. Use this switch to enable the instrumentation engine to collect events and messages about what's happening during the execution of a managed process. These events and messages include dependency result codes, HTTP verbs, and SQL command text. The instrumentation engine adds overhead and is off by default. |
| -AcceptLicense | Optional. Use this switch to accept the license and privacy statement in headless installations. |
| -IgnoreSharedConfig | When you have a cluster of web servers, you might be using a shared configuration. The HttpModule can't be injected into this shared configuration. This script fails with the message that extra installation steps are required. Use this switch to ignore this check and continue installing prerequisites. For more information, see known conflict-with-iis-shared-configuration |
| -Verbose | Common parameter. Use this switch to display detailed logs. |
| -WhatIf | Common parameter. Use this switch to test and validate your input parameters without actually enabling monitoring. |
Output
Example output from a successful enablement
Initiating Disable Process
Applying transformation to 'C:\Windows\System32\inetsrv\config\applicationHost.config'
'C:\Windows\System32\inetsrv\config\applicationHost.config' backed up to 'C:\Windows\System32\inetsrv\config\applicationHost.config.backup-2019-03-26_08-59-52z'
in :1,237
No element in the source document matches '/configuration/location[@path='']/system.webServer/modules/add[@name='ManagedHttpModuleHelper']'
Not executing RemoveAll (transform line 1, 546)
Transformation to 'C:\Windows\System32\inetsrv\config\applicationHost.config' was successfully applied. Operation: 'disable'
GAC Module will not be removed, since this operation might cause IIS instabilities
Configuring IIS Environment for codeless attach...
Registry: skipping non-existent 'HKEY_LOCAL_MACHINE\SYSTEM\CurrentControlSet\Services\IISADMIN[Environment]
Registry: skipping non-existent 'HKEY_LOCAL_MACHINE\SYSTEM\CurrentControlSet\Services\W3SVC[Environment]
Registry: skipping non-existent 'HKEY_LOCAL_MACHINE\SYSTEM\CurrentControlSet\Services\WAS[Environment]
Configuring IIS Environment for instrumentation engine...
Registry: skipping non-existent 'HKEY_LOCAL_MACHINE\SYSTEM\CurrentControlSet\Services\IISADMIN[Environment]
Registry: skipping non-existent 'HKEY_LOCAL_MACHINE\SYSTEM\CurrentControlSet\Services\W3SVC[Environment]
Registry: skipping non-existent 'HKEY_LOCAL_MACHINE\SYSTEM\CurrentControlSet\Services\WAS[Environment]
Configuring registry for instrumentation engine...
Successfully disabled Application Insights Agent
Installing GAC module 'C:\Program Files\WindowsPowerShell\Modules\Az.ApplicationMonitor\0.2.0\content\Runtime\Microsoft.AppInsights.IIS.ManagedHttpModuleHelper.dll'
Applying transformation to 'C:\Windows\System32\inetsrv\config\applicationHost.config'
Found GAC module Microsoft.AppInsights.IIS.ManagedHttpModuleHelper.ManagedHttpModuleHelper, Microsoft.AppInsights.IIS.ManagedHttpModuleHelper, Version=1.0.0.0, Culture=neutral, PublicKeyToken=31bf3856ad364e35
'C:\Windows\System32\inetsrv\config\applicationHost.config' backed up to 'C:\Windows\System32\inetsrv\config\applicationHost.config.backup-2019-03-26_08-59-52z_1'
Transformation to 'C:\Windows\System32\inetsrv\config\applicationHost.config' was successfully applied. Operation: 'enable'
Configuring IIS Environment for codeless attach...
Configuring IIS Environment for instrumentation engine...
Configuring registry for instrumentation engine...
Updating app pool permissions...
Successfully enabled Application Insights Agent
Disable-InstrumentationEngine
Disables the instrumentation engine by removing some registry keys. Restart IIS for the changes to take effect.
Examples
Disable-InstrumentationEngine
Parameters
| Parameter | Description |
|---|---|
| -Verbose | Common parameter. Use this switch to output detailed logs. |
Output
Example output from successfully disabling the instrumentation engine
Configuring IIS Environment for instrumentation engine...
Registry: removing 'HKEY_LOCAL_MACHINE\SYSTEM\CurrentControlSet\Services\IISADMIN[Environment]'
Registry: removing 'HKEY_LOCAL_MACHINE\SYSTEM\CurrentControlSet\Services\W3SVC[Environment]'
Registry: removing 'HKEY_LOCAL_MACHINE\SYSTEM\CurrentControlSet\Services\WAS[Environment]'
Configuring registry for instrumentation engine...
Disable-ApplicationInsightsMonitoring
Disables monitoring on the target computer. This cmdlet removes edits to the IIS applicationHost.config and remove registry keys.
Examples
Disable-ApplicationInsightsMonitoring
Parameters
| Parameter | Description |
|---|---|
| -Verbose | Common parameter. Use this switch to display detailed logs. |
Output
Example output from successfully disabling monitoring
Initiating Disable Process
Applying transformation to 'C:\Windows\System32\inetsrv\config\applicationHost.config'
'C:\Windows\System32\inetsrv\config\applicationHost.config' backed up to 'C:\Windows\System32\inetsrv\config\applicationHost.config.backup-2019-03-26_08-59-00z'
in :1,237
No element in the source document matches '/configuration/location[@path='']/system.webServer/modules/add[@name='ManagedHttpModuleHelper']'
Not executing RemoveAll (transform line 1, 546)
Transformation to 'C:\Windows\System32\inetsrv\config\applicationHost.config' was successfully applied. Operation: 'disable'
GAC Module will not be removed, since this operation might cause IIS instabilities
Configuring IIS Environment for codeless attach...
Registry: skipping non-existent 'HKEY_LOCAL_MACHINE\SYSTEM\CurrentControlSet\Services\IISADMIN[Environment]
Registry: skipping non-existent 'HKEY_LOCAL_MACHINE\SYSTEM\CurrentControlSet\Services\W3SVC[Environment]
Registry: skipping non-existent 'HKEY_LOCAL_MACHINE\SYSTEM\CurrentControlSet\Services\WAS[Environment]
Configuring IIS Environment for instrumentation engine...
Registry: skipping non-existent 'HKEY_LOCAL_MACHINE\SYSTEM\CurrentControlSet\Services\IISADMIN[Environment]
Registry: skipping non-existent 'HKEY_LOCAL_MACHINE\SYSTEM\CurrentControlSet\Services\W3SVC[Environment]
Registry: skipping non-existent 'HKEY_LOCAL_MACHINE\SYSTEM\CurrentControlSet\Services\WAS[Environment]
Configuring registry for instrumentation engine...
Successfully disabled Application Insights Agent
Get-ApplicationInsightsMonitoringConfig
Gets the config file and prints the values to the console.
Examples
Get-ApplicationInsightsMonitoringConfig
Parameters
No parameters required.
Output
Example output from reading the config file
RedfieldConfiguration:
Filters:
0)InstrumentationKey: AppFilter: WebAppExclude MachineFilter: .*
1)InstrumentationKey: xxxxxxxx-xxxx-xxxx-xxxx-xxxxxxxxxxx2 AppFilter: WebAppTwo MachineFilter: .*
2)InstrumentationKey: xxxxxxxx-xxxx-xxxx-xxxx-xxxxxdefault AppFilter: .* MachineFilter: .*
Get-ApplicationInsightsMonitoringStatus
This cmdlet provides troubleshooting information about Application Insights Agent. Use this cmdlet to investigate the monitoring status, version of the PowerShell Module, and to inspect the running process. This cmdlet reports version information and information about key files required for monitoring.
Examples
Example: Application status
Run the command Get-ApplicationInsightsMonitoringStatus to display the monitoring status of web sites.
Get-ApplicationInsightsMonitoringStatus

IIS Websites:

SiteName               : Default Web Site
ApplicationPoolName    : DefaultAppPool
SiteId                 : 1
SiteState              : Stopped

SiteName               : DemoWebApp111
ApplicationPoolName    : DemoWebApp111
SiteId                 : 2
SiteState              : Started
ProcessId              : not found

SiteName               : DemoWebApp222
ApplicationPoolName    : DemoWebApp222
SiteId                 : 3
SiteState              : Started
ProcessId              : 2024
Instrumented           : true
InstrumentationKey     : xxxxxxxx-xxxx-xxxx-xxxx-xxxxxxxxx123

SiteName               : DemoWebApp333
ApplicationPoolName    : DemoWebApp333
SiteId                 : 4
SiteState              : Started
ProcessId              : 5184
AppAlreadyInstrumented : true
In this example:
Machine Identifier is an anonymous ID used to uniquely identify your server. If you create a support request, we need this ID to find logs for your server.
Default Web Site is Stopped in IIS
IIS shows DemoWebApp111 as started, but the app doesn't receive any requests. The report shows no running process (ProcessId: not found).
DemoWebApp222 is running and is being monitored (Instrumented: true). Based on the user configuration, Instrumentation Key xxxxxxxx-xxxx-xxxx-xxxx-xxxxxxxxx123 was matched for this site.
DemoWebApp333 is manually instrumented using the Application Insights SDK. Application Insights Agent detects the SDK and doesn't monitor this site.
The presence of
AppAlreadyInstrumented : truesignifies that the Application Insights agent identified a conflicting dll loaded in the web application, assumed that the web app is manually instrumented, and the agent has backed-off and isn't instrumenting this process.Instrumented : trueindicates that the Application Insights agent successfully instrumented the web app running in the specified w3wp.exe process.
Example: PowerShell module information
Run the command Get-ApplicationInsightsMonitoringStatus -PowerShellModule to display information about the current module:
Get-ApplicationInsightsMonitoringStatus -PowerShellModule

PowerShell Module version:
0.4.0-alpha

Application Insights SDK version:
2.9.0.3872

Executing PowerShell Module Assembly:
Microsoft.ApplicationInsights.Redfield.Configurator.PowerShell, Version=2.8.14.11432, Culture=neutral, PublicKeyToken=31bf3856ad364e35

PowerShell Module Directory:
C:\Program Files\WindowsPowerShell\Modules\Az.ApplicationMonitor\0.2.2\content\PowerShell

Runtime Paths:
ParentDirectory (Exists: True)
C:\Program Files\WindowsPowerShell\Modules\Az.ApplicationMonitor\content

ConfigurationPath (Exists: True)
C:\Program Files\WindowsPowerShell\Modules\Az.ApplicationMonitor\content\applicationInsights.ikey.config

ManagedHttpModuleHelperPath (Exists: True)
C:\Program Files\WindowsPowerShell\Modules\Az.ApplicationMonitor\content\Runtime\Microsoft.AppInsights.IIS.ManagedHttpModuleHelper.dll

RedfieldIISModulePath (Exists: True)
C:\Program Files\WindowsPowerShell\Modules\Az.ApplicationMonitor\content\Runtime\Microsoft.ApplicationInsights.RedfieldIISModule.dll

InstrumentationEngine86Path (Exists: True)
C:\Program Files\WindowsPowerShell\Modules\Az.ApplicationMonitor\content\Instrumentation32\MicrosoftInstrumentationEngine_x86.dll

InstrumentationEngine64Path (Exists: True)
C:\Program Files\WindowsPowerShell\Modules\Az.ApplicationMonitor\content\Instrumentation64\MicrosoftInstrumentationEngine_x64.dll

InstrumentationEngineExtensionHost86Path (Exists: True)
C:\Program Files\WindowsPowerShell\Modules\Az.ApplicationMonitor\content\Instrumentation32\Microsoft.ApplicationInsights.ExtensionsHost_x86.dll

InstrumentationEngineExtensionHost64Path (Exists: True)
C:\Program Files\WindowsPowerShell\Modules\Az.ApplicationMonitor\content\Instrumentation64\Microsoft.ApplicationInsights.ExtensionsHost_x64.dll

InstrumentationEngineExtensionConfig86Path (Exists: True)
C:\Program Files\WindowsPowerShell\Modules\Az.ApplicationMonitor\content\Instrumentation32\Microsoft.InstrumentationEngine.Extensions.config

InstrumentationEngineExtensionConfig64Path (Exists: True)
C:\Program Files\WindowsPowerShell\Modules\Az.ApplicationMonitor\content\Instrumentation64\Microsoft.InstrumentationEngine.Extensions.config

ApplicationInsightsSdkPath (Exists: True)
C:\Program Files\WindowsPowerShell\Modules\Az.ApplicationMonitor\content\Runtime\Microsoft.ApplicationInsights.dll
Example: Runtime status
You can inspect the process on the instrumented computer to see if all DLLs are loaded. If monitoring is working, at least 12 DLLs should be loaded.
Run the command Get-ApplicationInsightsMonitoringStatus -InspectProcess:
Get-ApplicationInsightsMonitoringStatus -InspectProcess

iisreset.exe /status
Status for IIS Admin Service ( IISADMIN ) : Running
Status for Windows Process Activation Service ( WAS ) : Running
Status for Net.Msmq Listener Adapter ( NetMsmqActivator ) : Running
Status for Net.Pipe Listener Adapter ( NetPipeActivator ) : Running
Status for Net.Tcp Listener Adapter ( NetTcpActivator ) : Running
Status for World Wide Web Publishing Service ( W3SVC ) : Running

handle64.exe -accepteula -p w3wp
BF0: File  (R-D)   C:\Program Files\WindowsPowerShell\Modules\Az.ApplicationMonitor\content\Runtime\Microsoft.AI.ServerTelemetryChannel.dll
C58: File  (R-D)   C:\Program Files\WindowsPowerShell\Modules\Az.ApplicationMonitor\content\Runtime\Microsoft.AI.AzureAppServices.dll
C68: File  (R-D)   C:\Program Files\WindowsPowerShell\Modules\Az.ApplicationMonitor\content\Runtime\Microsoft.AI.DependencyCollector.dll
C78: File  (R-D)   C:\Program Files\WindowsPowerShell\Modules\Az.ApplicationMonitor\content\Runtime\Microsoft.AI.WindowsServer.dll
C98: File  (R-D)   C:\Program Files\WindowsPowerShell\Modules\Az.ApplicationMonitor\content\Runtime\Microsoft.AI.Web.dll
CBC: File  (R-D)   C:\Program Files\WindowsPowerShell\Modules\Az.ApplicationMonitor\content\Runtime\Microsoft.AI.PerfCounterCollector.dll
DB0: File  (R-D)   C:\Program Files\WindowsPowerShell\Modules\Az.ApplicationMonitor\content\Runtime\Microsoft.AI.Agent.Intercept.dll
B98: File  (R-D)   C:\Program Files\WindowsPowerShell\Modules\Az.ApplicationMonitor\content\Runtime\Microsoft.ApplicationInsights.RedfieldIISModule.dll
BB4: File  (R-D)   C:\Program Files\WindowsPowerShell\Modules\Az.ApplicationMonitor\content\Runtime\Microsoft.ApplicationInsights.RedfieldIISModule.Contracts.dll
BCC: File  (R-D)   C:\Program Files\WindowsPowerShell\Modules\Az.ApplicationMonitor\content\Runtime\Microsoft.ApplicationInsights.Redfield.Lightup.dll
BE0: File  (R-D)   C:\Program Files\WindowsPowerShell\Modules\Az.ApplicationMonitor\content\Runtime\Microsoft.ApplicationInsights.dll

listdlls64.exe -accepteula w3wp
0x0000000019ac0000  0x127000  C:\Program Files\WindowsPowerShell\Modules\Az.ApplicationMonitor\content\Instrumentation64\MicrosoftInstrumentationEngine_x64.dll
0x00000000198b0000  0x4f000   C:\Program Files\WindowsPowerShell\Modules\Az.ApplicationMonitor\content\Instrumentation64\Microsoft.ApplicationInsights.ExtensionsHost_x64.dll
0x000000000c460000  0xb2000   C:\Program Files\WindowsPowerShell\Modules\Az.ApplicationMonitor\content\Instrumentation64\Microsoft.ApplicationInsights.Extensions.Base_x64.dll
0x000000000ad60000  0x108000  C:\Windows\TEMP\2.4.0.0.Microsoft.ApplicationInsights.Extensions.Intercept_x64.dll
Parameters
By default, this cmdlet reports the monitoring status of web applications. Use this option to review if your application was successfully instrumented. You can also review which Instrumentation Key was matched to your site.
| Parameter | Description |
|---|---|
| -PowerShellModule | Optional. Use this switch to report the version numbers and paths of DLLs required for monitoring. Use this option if you need to identify the version of any DLL, including the Application Insights SDK. |
| -InspectProcess | Optional. Use this switch to report whether IIS is running. It downloads external tools to determine if the necessary DLLs are loaded into the IIS runtime. If this process fails for any reason, you can run these commands manually: * iisreset.exe /status* \[handle64.exe\](/sysinternals/downloads/handle) -p w3wp \| findstr /I "InstrumentationEngine AI. ApplicationInsights"* \[listdlls64.exe\](/sysinternals/downloads/listdlls) w3wp \| findstr /I "InstrumentationEngine AI ApplicationInsights" |
| -Force | Optional. Used only with InspectProcess. Use this switch to skip the user prompt that appears before more tools are downloaded. |
Set-ApplicationInsightsMonitoringConfig
Sets the config file without doing a full reinstallation. Restart IIS for your changes to take effect.
Important
This cmdlet requires a PowerShell session with Admin permissions.
Examples
Example with a single instrumentation key
In this example, all apps on the current computer are provided with a single instrumentation key.
Enable-ApplicationInsightsMonitoring -InstrumentationKey xxxxxxxx-xxxx-xxxx-xxxx-xxxxxxxxxxxx
Example with an instrumentation key map
In this example:
MachineFiltermatches the current computer by using the'.*'wildcard.AppFilter='WebAppExclude'provides anullinstrumentation key. The specified app isn't instrumented.AppFilter='WebAppOne'assigns the specified app a unique instrumentation key.AppFilter='WebAppTwo'assigns the specified app a unique instrumentation key.AppFilteruses the'.*'wildcard to match web apps it doesn't already match and assigns a default instrumentation key.- Spaces are added for readability.
Enable-ApplicationInsightsMonitoring -InstrumentationKeyMap `
    ` @(@{MachineFilter='.*';AppFilter='WebAppExclude'},
      ` @{MachineFilter='.*';AppFilter='WebAppOne';InstrumentationSettings=@{InstrumentationKey='xxxxxxxx-xxxx-xxxx-xxxx-xxxxxxxxxxx1'}},
      ` @{MachineFilter='.*';AppFilter='WebAppTwo';InstrumentationSettings=@{InstrumentationKey='xxxxxxxx-xxxx-xxxx-xxxx-xxxxxxxxxxx2'}},
      ` @{MachineFilter='.*';AppFilter='.*';InstrumentationSettings=@{InstrumentationKey='xxxxxxxx-xxxx-xxxx-xxxx-xxxxxdefault'}})
Parameters
| Parameter | Description |
|---|---|
| -InstrumentationKey | Required. Use this parameter to supply a single instrumentation key for use by all apps on the target computer. |
| -InstrumentationKeyMap | Required. Use this parameter to supply multiple instrumentation keys and a mapping of the instrumentation keys used by each app. |
You can create a single installation script for several computers by setting MachineFilter.
Important
Apps match rules in the order you provide them. Specify the most specific rules first and the most generic rules last.
Important
InstrumentationKeyMap is an advanced routing feature that maps Internet Information Services (IIS) apps on the same machine to Application Insights resources. The feature applies to IIS-hosted ASP.NET and ASP.NET Core apps that the Application Insights Agent autoinstruments.
How matching works
- The map defines an ordered list of rules named
filters. The first matching rule takes effect. Place specific rules first and finish with a catch-all rule. - Each rule can assign a different Application Insights resource to matching apps. Prefer connection strings in supported scenarios because instrumentation keys are legacy.
Available filters
MachineFilterormachineFilter: C# regular expression that matches the computer or virtual machine (VM) name..*matches all names.AppFilterorappFilter: C# regular expression that matches the IIS site name (HostingEnvironment.SiteName). This filter is required whenVirtualPathFilterorvirtualPathFilterisn't provided.VirtualPathFilterorvirtualPathFilter: C# regular expression that matches the IIS virtual path (HostingEnvironment.ApplicationVirtualPath). Use this filter to target a single app under a site.
Terminology mapping
- PowerShell cmdlets use
MachineFilter,AppFilter, andVirtualPathFilter. - Azure VM and Virtual Machine Scale Sets extension JSON uses
machineFilter,appFilter, andvirtualPathFilter, and sets the resource withinstrumentationSettings.
Tip
Include a final rule that matches all apps, such as .*, and apply a default resource to make the behavior explicit.
This cmdlet's map shape
- Supply
-InstrumentationKeyMapas a PowerShell array of hashtables. - For this cmdlet, set the target resource per rule with
InstrumentationSettings=@{ InstrumentationKey = '<ikey>' }. - If you want a single resource for all apps on the machine, use
-ConnectionStringor-InstrumentationKeyinstead.
Start-ApplicationInsightsMonitoringTrace
Collects Event Tracing for Windows (ETW) events that the codeless attach runtime emits. Use this cmdlet as a simpler alternative to running PerfView.
Events are printed to the console in real time and also written to an .etl file. You can open the .etl file with PerfView for deeper analysis.
This cmdlet runs until it reaches the timeout, the default is 5 minutes, or until you stop it manually with Ctrl + C.
Examples
How to collect events
Use this flow when you need to investigate why an IIS app isn't being instrumented.
The codeless attach runtime emits ETW events when IIS starts and when your app starts.
- In an administrative command prompt, run
iisreset /stopto stop IIS and all web apps. - Begin tracing by running this cmdlet.
- In an administrative command prompt, run
iisreset /startto start IIS. - Trigger startup by browsing to your app.
- After the app finishes loading, press
Ctrl + Cto stop, or allow the timeout to end the session.
What events to collect
You can choose which event sources to include:
-CollectSdkEventscollects events from the Application Insights SDK.-CollectRedfieldEventscollects events from Application Insights Agent and the Redfield runtime, which is useful for IIS and app startup diagnostics.- Collect both sets by specifying both switches.
- If you don't specify a switch, both sets are collected by default.
Parameters
| Parameter | Description |
|---|---|
| -MaxDurationInMinutes | Optional. Sets how long to collect before timing out. The default is 5 minutes. |
| -LogDirectory | Optional. Directory where the .etl file should be written. By default, the file is created under the module PowerShell directory. The full path is shown when the session starts. |
| -CollectSdkEvents | Optional. Include Application Insights SDK events. |
| -CollectRedfieldEvents | Optional. Include events from Application Insights Agent and the Redfield runtime. |
| -Verbose | Common parameter. Outputs detailed logs. |
Output
Example of application startup logs
Start-ApplicationInsightsMonitoringTrace -CollectRedfieldEvents
Starting...
Log File: C:\Program Files\WindowsPowerShell\Modules\Az.ApplicationMonitor\content\logs\20190627_144217_ApplicationInsights_ETW_Trace.etl
Tracing enabled, waiting for events.
Tracing will timeout in 5 minutes. Press CTRL+C to cancel.
2:42:31 PM EVENT: Microsoft-ApplicationInsights-IIS-ManagedHttpModuleHelper Trace Resolved variables to: MicrosoftAppInsights_ManagedHttpModulePath='C:\Program Files\WindowsPowerShell\Modules\Az.ApplicationMonitor\content\Runtime\Microsoft.ApplicationInsights.RedfieldIISModule.dll', MicrosoftAppInsights_ManagedHttpModuleType='Microsoft.ApplicationInsights.RedfieldIISModule.RedfieldIISModule'
2:42:31 PM EVENT: Microsoft-ApplicationInsights-IIS-ManagedHttpModuleHelper Trace Resolved variables to: MicrosoftDiagnosticServices_ManagedHttpModulePath2='', MicrosoftDiagnosticServices_ManagedHttpModuleType2=''
2:42:31 PM EVENT: Microsoft-ApplicationInsights-IIS-ManagedHttpModuleHelper Trace Environment variable 'MicrosoftDiagnosticServices_ManagedHttpModulePath2' or 'MicrosoftDiagnosticServices_ManagedHttpModuleType2' is null, skipping managed dll loading
Deploy the Application Insights Agent for virtual machines (VMs) and virtual machine scale sets
In this section
Enable Azure Monitor Application Insights monitoring through autoinstrumentation for Internet Information Server (IIS)-hosted ASP.NET and ASP.NET Core applications on Azure Virtual Machines and Azure Virtual Machine Scale Sets.
Deploy the Application Insights Agent with a virtual machine extension. The agent autocollects the same dependency signals as the SDK. Use PowerShell to automate large-scale deployments.
Note
- For Java applications, use the Application Insights Java 3.0 agent, which autocollects the most popular libraries, frameworks, logs, and dependencies, along with many other configurations.
- Node.js and Python applications running on Azure VMs and Azure Virtual Machine Scale Sets don't support autoinstrumentation. Use the Azure Monitor OpenTelemetry Distro instead.
- To monitor VM guests in addition to the applications hosted on them, see VM guest data.
For a complete list of supported autoinstrumentation scenarios, see Supported environments, languages, and resource providers.
Enable monitoring for virtual machines
You can use the Azure portal or PowerShell to enable monitoring for VMs.
Option 1: Azure portal
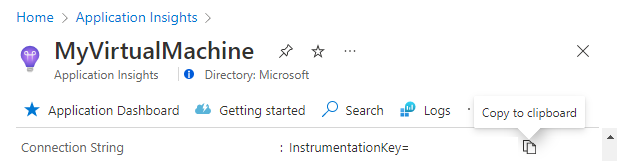
In the Azure portal, go to your Application Insights resource. Copy your connection string to the clipboard.
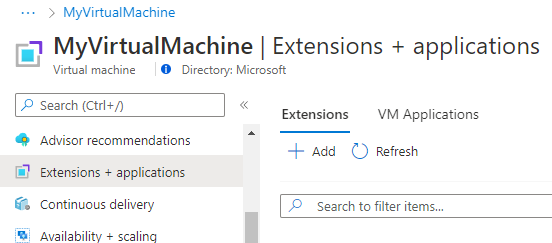
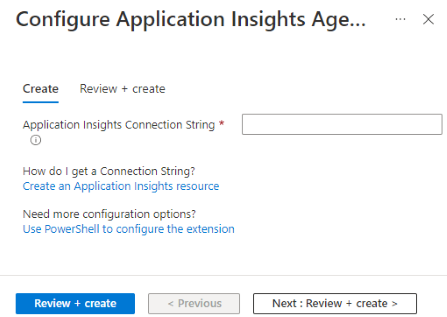
Go to your virtual machine. Under the Settings section in the menu on the left side, select Extensions + applications > Add.
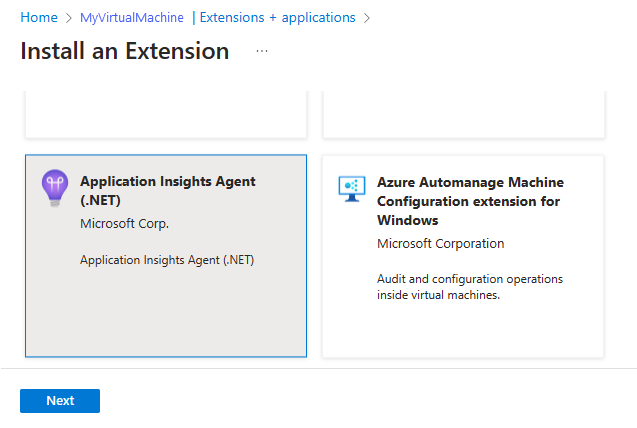
Select Application Insights Agent > Next.
Paste the connection string you copied in step 1 and select Review + create.


Option 2: PowerShell
Note
New to PowerShell? Check out the Get started guide.
Install or update the Application Insights Agent as an extension for Azure virtual machines:
# define variables to match your environment before running
$ResourceGroup = "<myVmResourceGroup>"
$VMName = "<myVmName>"
$Location = "<myVmLocation>"
$ConnectionString = "<myAppInsightsResourceConnectionString>"

$publicCfgJsonString = @"
{
    "redfieldConfiguration": {
        "instrumentationKeyMap": {
        "filters": [
            {
            "appFilter": ".*",
            "machineFilter": ".*",
            "virtualPathFilter": ".*",
            "instrumentationSettings" : {
                "connectionString": "$ConnectionString"
            }
            }
        ]
        }
    }
    }
"@

$privateCfgJsonString = '{}'

Set-AzVMExtension -ResourceGroupName $ResourceGroup -VMName $VMName -Location $Location -Name "ApplicationMonitoringWindows" -Publisher "Microsoft.Azure.Diagnostics" -Type "ApplicationMonitoringWindows" -Version "2.8" -SettingString $publicCfgJsonString -ProtectedSettingString $privateCfgJsonString
Note
For more complicated at-scale deployments, you can use a PowerShell loop to install or update the Application Insights Agent extension across multiple VMs.
Query the Application Insights Agent extension status for Azure virtual machines:
Get-AzVMExtension -ResourceGroupName "<myVmResourceGroup>" -VMName "<myVmName>" -Name ApplicationMonitoringWindows -Status
Get a list of installed extensions for Azure virtual machines:
Get-AzResource -ResourceId "/subscriptions/<mySubscriptionId>/resourceGroups/<myVmResourceGroup>/providers/Microsoft.Compute/virtualMachines/<myVmName>/extensions"
Uninstall the Application Insights Agent extension from Azure virtual machines:
Remove-AzVMExtension -ResourceGroupName "<myVmResourceGroup>" -VMName "<myVmName>" -Name "ApplicationMonitoring"
Note
Verify installation by selecting Live Metrics Stream within the Application Insights resource associated with the connection string you used to deploy the Application Insights Agent extension. If you're sending data from multiple virtual machines, select the target Azure virtual machines under Server Name. It might take up to a minute for data to begin flowing.
instrumentationKeyMap (extension settings)
Important
InstrumentationKeyMap is an advanced routing feature that maps Internet Information Services (IIS) apps on the same machine to Application Insights resources. The feature applies to IIS-hosted ASP.NET and ASP.NET Core apps that the Application Insights Agent autoinstruments.
How matching works
- The map defines an ordered list of rules named
filters. The first matching rule takes effect. Place specific rules first and finish with a catch-all rule. - Each rule can assign a different Application Insights resource to matching apps. Prefer connection strings in supported scenarios because instrumentation keys are legacy.
Available filters
MachineFilterormachineFilter: C# regular expression that matches the computer or virtual machine (VM) name..*matches all names.AppFilterorappFilter: C# regular expression that matches the IIS site name (HostingEnvironment.SiteName). This filter is required whenVirtualPathFilterorvirtualPathFilterisn't provided.VirtualPathFilterorvirtualPathFilter: C# regular expression that matches the IIS virtual path (HostingEnvironment.ApplicationVirtualPath). Use this filter to target a single app under a site.
Terminology mapping
- PowerShell cmdlets use
MachineFilter,AppFilter, andVirtualPathFilter. - Azure VM and Virtual Machine Scale Sets extension JSON uses
machineFilter,appFilter, andvirtualPathFilter, and sets the resource withinstrumentationSettings.
Tip
Include a final rule that matches all apps, such as .*, and apply a default resource to make the behavior explicit.
Where it goes for the VM and Virtual Machine Scale Sets extension
Place the map under redfieldConfiguration.instrumentationKeyMap.filters in the extension's public settings (-SettingString for VMs, -Setting for Virtual Machine Scale Sets). Property names are lower camel case. Set the target resource per rule with instrumentationSettings.connectionString.
{
  "redfieldConfiguration": {
    "instrumentationKeyMap": {
      "filters": [
        {
          "machineFilter": ".*",
          "appFilter": ".*",
          "instrumentationSettings": {
            "connectionString": "<your-APPLICATIONINSIGHTS_CONNECTION_STRING>"
          }
        }
      ]
    }
  }
}
Enable monitoring for virtual machine scale sets
You can use the Azure portal or PowerShell to enable monitoring for virtual machine scale sets.
Option 1: Azure portal
Follow the prior steps for VMs, but go to your virtual machine scale sets instead of your VM.
Option 2: PowerShell
Install or update Application Insights Agent as an extension for virtual machine scale sets:
# Set resource group, vmss name, and connection string to reflect your environment
$ResourceGroup = "<myVmResourceGroup>"
$VMSSName = "<myVmName>"
$ConnectionString = "<myAppInsightsResourceConnectionString>"
$publicCfgHashtable =
@{
  "redfieldConfiguration"= @{
    "instrumentationKeyMap"= @{
      "filters"= @(
        @{
          "appFilter"= ".*";
          "machineFilter"= ".*";
          "virtualPathFilter"= ".*";
          "instrumentationSettings" = @{
            "connectionString"= "$ConnectionString"
          }
        }
      )
    }
  }
};
$privateCfgHashtable = @{};
$vmss = Get-AzVmss -ResourceGroupName $ResourceGroup -VMScaleSetName $VMSSName
Add-AzVmssExtension -VirtualMachineScaleSet $vmss -Name "ApplicationMonitoringWindows" -Publisher "Microsoft.Azure.Diagnostics" -Type "ApplicationMonitoringWindows" -TypeHandlerVersion "2.8" -Setting $publicCfgHashtable -ProtectedSetting $privateCfgHashtable
Update-AzVmss -ResourceGroupName $vmss.ResourceGroupName -Name $vmss
# Note: Depending on your update policy, you might need to run Update-AzVmssInstance for each instance
Get a list of installed extensions for virtual machine scale sets:
Get-AzResource -ResourceId "/subscriptions/<mySubscriptionId>/resourceGroups/<myResourceGroup>/providers/Microsoft.Compute/virtualMachineScaleSets/<myVmssName>/extensions"
Uninstall the application monitoring extension from virtual machine scale sets:
# set resource group and vmss name to reflect your environment
$vmss = Get-AzVmss -ResourceGroupName "<myResourceGroup>" -VMScaleSetName "<myVmssName>"
Remove-AzVmssExtension -VirtualMachineScaleSet $vmss -Name "ApplicationMonitoringWindows"
Update-AzVmss -ResourceGroupName $vmss.ResourceGroupName -Name $vmss.Name -VirtualMachineScaleSet $vmss
# Note: Depending on your update policy, you might need to run Update-AzVmssInstance for each instance
Troubleshooting
For dedicated troubleshooting steps, see Trouble deploying the Application Insights Monitoring Agent extension for VMs and virtual machine scale sets.
Verify Application Insights receives telemetry
ASP.NET & ASP.NET Core
Run your application and make requests to it. Telemetry should now flow to Application Insights. The Application Insights SDK automatically collects incoming web requests to your application, along with the following telemetry.
Worker Service
Run your application. The workers from all the preceding examples make an HTTP call every second to bing.com and also emit few logs by using ILogger. These lines are wrapped inside the StartOperation call of TelemetryClient, which is used to create an operation. In this example, RequestTelemetry is named "operation."
Application Insights collects these ILogger logs, with a severity of Warning or above by default, and dependencies. They're correlated to RequestTelemetry with a parent-child relationship. Correlation also works across process/network boundaries. For example, if the call was made to another monitored component, it's correlated to this parent as well.
This custom operation of RequestTelemetry can be thought of as the equivalent of an incoming web request in a typical web application. It isn't necessary to use an operation, but it fits best with the Application Insights correlation data model. RequestTelemetry acts as the parent operation and every telemetry generated inside the worker iteration is treated as logically belonging to the same operation.
This approach also ensures that the telemetry generated, both automatic and manual, has the same operation_id. Because sampling is based on operation_id, the sampling algorithm either keeps or drops all telemetry from a single iteration.
Collecting telemetry data
In this section
- Live metrics
- Traces (logs)
- Distributed tracing
- Dependencies
- Exceptions
- Custom metrics
- Custom operations
- Counters
- Snapshot collection
Live metrics
Live metrics can be used to quickly verify if application monitoring with Application Insights is configured correctly. Telemetry can take a few minutes to appear in the Azure portal, but the live metrics pane shows CPU usage of the running process in near real time. It can also show other telemetry like requests, dependencies, and traces.
Note
Live metrics are enabled by default when you onboard it by using the recommended instructions for .NET applications.
Get started
Enable live metrics with Application Insights SDKs by following language-specific guidelines:
- ASP.NET: Enabled by default but can also be enabled manually using code.
- ASP.NET Core: Enabled by default but can also be enabled manually using code.
- .NET/.NET Core Console/Worker: Enabled by default.
Open the Application Insights resource for your application in the Azure portal. Select Live metrics, which is listed under Investigate in the left hand menu.
Secure the control channel by enabling Microsoft Entra authentication if you use custom filters.
Supported features
| Language | Basic metrics | Performance metrics | Custom filtering | Sample telemetry | CPU split by process |
|---|---|---|---|---|---|
| .NET Framework | Supported (LTS) | Supported (LTS) | Supported (LTS) | Supported (LTS) | Supported (LTS) |
| .NET Core (target=.NET Framework) | Supported (LTS) | Supported (LTS) | Supported (LTS) | Supported (LTS) | Supported (LTS) |
| .NET Core (target=.NET Core) | Supported (LTS) | Supported* | Supported (LTS) | Supported (LTS) | Not supported |
Basic metrics include request, dependency, and exception rate. Performance metrics (performance counters) include memory and CPU. Sample telemetry shows a stream of detailed information for failed requests and dependencies, exceptions, events, and traces.
PerfCounters support varies slightly across versions of .NET Core that don't target the .NET Framework:
- PerfCounters metrics are supported when running in Azure App Service for Windows (ASP.NET Core SDK version 2.4.1 or higher).
- PerfCounters are supported when the app is running on any Windows machine for apps that target .NET Core LTS or higher.
- PerfCounters are supported when the app is running anywhere (such as Linux, Windows, app service for Linux, or containers) in the latest versions, but only for apps that target .NET Core LTS or higher.
Enable live metrics by using code for any .NET application
ASP.NET
To manually configure live metrics:
Install the NuGet package Microsoft.ApplicationInsights.PerfCounterCollector.
The following sample console app code shows setting up live metrics:
using Microsoft.ApplicationInsights;
using Microsoft.ApplicationInsights.Extensibility;
using Microsoft.ApplicationInsights.Extensibility.PerfCounterCollector.QuickPulse;
using System;
using System.Threading.Tasks;

namespace LiveMetricsDemo
{
    class Program
    {
        static void Main(string[] args)
        {
            // Create a TelemetryConfiguration instance.
            TelemetryConfiguration config = TelemetryConfiguration.CreateDefault();
            config.ConnectionString = "<YOUR-CONNECTION-STRING>";
            QuickPulseTelemetryProcessor quickPulseProcessor = null;
            config.DefaultTelemetrySink.TelemetryProcessorChainBuilder
                .Use((next) =>
                {
                    quickPulseProcessor = new QuickPulseTelemetryProcessor(next);
                    return quickPulseProcessor;
                })
                .Build();

            var quickPulseModule = new QuickPulseTelemetryModule();

            // Secure the control channel.
            // This is optional, but recommended.
            quickPulseModule.AuthenticationApiKey = "<YOUR-API-KEY>";
            quickPulseModule.Initialize(config);
            quickPulseModule.RegisterTelemetryProcessor(quickPulseProcessor);

            // Create a TelemetryClient instance. It is important
            // to use the same TelemetryConfiguration here as the one
            // used to set up live metrics.
            TelemetryClient client = new TelemetryClient(config);

            // This sample runs indefinitely. Replace with actual application logic.
            while (true)
            {
                // Send dependency and request telemetry.
                // These will be shown in live metrics.
                // CPU/Memory Performance counter is also shown
                // automatically without any additional steps.
                client.TrackDependency("My dependency", "target", "http://sample",
                    DateTimeOffset.Now, TimeSpan.FromMilliseconds(300), true);
                client.TrackRequest("My Request", DateTimeOffset.Now,
                    TimeSpan.FromMilliseconds(230), "200", true);
                Task.Delay(1000).Wait();
            }
        }
    }
}
ASP.NET Core
To manually configure live metrics:
Install the NuGet package Microsoft.ApplicationInsights.PerfCounterCollector.
The following sample console app code shows setting up live metrics:
using Microsoft.ApplicationInsights;
using Microsoft.ApplicationInsights.Extensibility;
using Microsoft.ApplicationInsights.Extensibility.PerfCounterCollector.QuickPulse;

// Create a TelemetryConfiguration instance.
TelemetryConfiguration config = TelemetryConfiguration.CreateDefault();
config.ConnectionString = "<YOUR-CONNECTION-STRING>";
QuickPulseTelemetryProcessor quickPulseProcessor = null;
config.DefaultTelemetrySink.TelemetryProcessorChainBuilder
    .Use((next) =>
    {
        quickPulseProcessor = new QuickPulseTelemetryProcessor(next);
        return quickPulseProcessor;
    })
    .Build();

var quickPulseModule = new QuickPulseTelemetryModule();

// Secure the control channel.
// This is optional, but recommended.
quickPulseModule.AuthenticationApiKey = "<YOUR-API-KEY>";
quickPulseModule.Initialize(config);
quickPulseModule.RegisterTelemetryProcessor(quickPulseProcessor);

// Create a TelemetryClient instance. It is important
// to use the same TelemetryConfiguration here as the one
// used to set up live metrics.
TelemetryClient client = new TelemetryClient(config);

// This sample runs indefinitely. Replace with actual application logic.
while (true)
{
    // Send dependency and request telemetry.
    // These will be shown in live metrics.
    // CPU/Memory Performance counter is also shown
    // automatically without any additional steps.
    client.TrackDependency("My dependency", "target", "http://sample",
        DateTimeOffset.Now, TimeSpan.FromMilliseconds(300), true);
    client.TrackRequest("My Request", DateTimeOffset.Now,
        TimeSpan.FromMilliseconds(230), "200", true);
    Task.Delay(1000).Wait();
}
The preceding sample is for a console app, but the same code can be used in any .NET applications.
Important
If any other telemetry modules are enabled to autocollect telemetry, ensure that the same configuration used for initializing those modules is used for the live metrics module.
Note
The default configuration collects ILogger Warning logs and more severe logs. For more information, see How do I customize ILogger logs collection?.
Worker Service
Logs emitted via ILogger with the severity Warning or greater are automatically captured. To change this behavior, explicitly override the logging configuration for the provider ApplicationInsights, as shown in the following code. The following configuration allows Application Insights to capture all Information logs and more severe logs.
{
  "Logging": {
    "LogLevel": {
      "Default": "Warning"
    },
    "ApplicationInsights": {
      "LogLevel": {
        "Default": "Information"
      }
    }
  }
}
It's important to note that the following example doesn't cause the Application Insights provider to capture Information logs. It doesn't capture it because the SDK adds a default logging filter that instructs ApplicationInsights to capture only Warning logs and more severe logs. Application Insights requires an explicit override.
{
  "Logging": {
    "LogLevel": {
      "Default": "Information"
    }
  }
}
Note
Application Insights respects the log levels configured via ConfigureLogging(...) in code. If only appsettings.json is used, and ConfigureLogging isn't overridden explicitly, the default log level is Warning.
For more information, follow ILogger docs to customize which log levels are captured by Application Insights.
Traces (logs)
This section explains how to send diagnostic tracing logs from ASP.NET or ASP.NET Core applications to Application Insights, and then explore/search those logs in the portal.
You can use trace logs to identify traces associated with each user request and correlate them with other events and exception reports.
Application Insights captures logs from ASP.NET Core and other .NET apps through ILogger, and from classic ASP.NET (.NET Framework) through the classic SDK and adapters.
Note
By default, the Application Insights provider only sends logs with a severity of
Warningor higher. To includeInformationor lower-level logs, update the log level settings inappsettings.json.The
Microsoft.ApplicationInsights.WorkerServiceNuGet package, used to enable Application Insights for background services, is out of scope.To review frequently asked questions (FAQ), see Logging with .NET FAQ.
Install logging on your app
ASP.NET
Choose a logging approach to emit diagnostic logs that Application Insights can collect.
For classic ASP.NET apps that use System.Diagnostics tracing, configure an Application Insights TraceListener in configuration.
Add a listener to web.config or app.config:
<configuration>
  <system.diagnostics>
    <trace>
      <listeners>
        <add name="myAppInsightsListener"
             type="Microsoft.ApplicationInsights.TraceListener.ApplicationInsightsTraceListener, Microsoft.ApplicationInsights.TraceListener" />
      </listeners>
    </trace>
  </system.diagnostics>
</configuration>
Note
The log-capture module is a useful adapter for third-party loggers. However, if you aren't already using NLog, log4Net, or System.Diagnostics.Trace, consider calling Application Insights TrackTrace() directly.
Configure Application Insights to collect logs
Option 1: Add Application Insights to your project if you haven't done so already. When adding Application Insights in Visual Studio, there's an option to include the log collector.
Option 2: Right-click your project in Solution Explorer to Configure Application Insights. Select the Configure trace collection option.
Note
If you're missing the Application Insights menu or log collector option, refer to the dedicated troubleshooting article.
ASP.NET Core
The Application Insights SDK for ASP.NET Core already collects ILogger logs by default. If you use the SDK, you typically don't need to also call builder.Logging.AddApplicationInsights() and can disregard the following ILogger installation instructions.
If you only need log forwarding and not the full telemetry stack, you can use the Microsoft.Extensions.Logging.ApplicationInsights provider package to capture logs.
Manual installation
Use this method if your project type isn't supported by the Application Insights installer (for example, some desktop/console scenarios) or if you prefer explicit package‑level control.
In Solution Explorer, right-click your project, and select Manage NuGet Packages.
Search for Application Insights.
Select one of the following packages:
- ILogger: Microsoft.Extensions.Logging.ApplicationInsights

- System.Diagnostics: Microsoft.ApplicationInsights.TraceListener

- log4net: Microsoft.ApplicationInsights.Log4NetAppender

- NLog: Microsoft.ApplicationInsights.NLogTarget

- Microsoft.ApplicationInsights.EventSourceListener

- Microsoft.ApplicationInsights.DiagnosticSourceListener

- Microsoft.ApplicationInsights.EtwCollector

- ILogger: Microsoft.Extensions.Logging.ApplicationInsights
The NuGet package installs the necessary assemblies and modifies web.config or app.config, if applicable.
Installation Instructions:
Note
Expand any of the sections below for package-specific installation instructions.
ILogger
Install the
Microsoft.Extensions.Logging.ApplicationInsights.Add
ApplicationInsightsLoggerProvider:
using Microsoft.Extensions.Logging.ApplicationInsights;

var builder = WebApplication.CreateBuilder(args);

// Add services to the container.

builder.Services.AddControllers();
// Learn more about configuring Swagger/OpenAPI at https://aka.ms/aspnetcore/swashbuckle
builder.Services.AddEndpointsApiExplorer();
builder.Services.AddSwaggerGen();

builder.Logging.AddApplicationInsights(
        configureTelemetryConfiguration: (config) =>
            config.ConnectionString = builder.Configuration.GetConnectionString("APPLICATIONINSIGHTS_CONNECTION_STRING"),
            configureApplicationInsightsLoggerOptions: (options) => { }
    );

builder.Logging.AddFilter<ApplicationInsightsLoggerProvider>("your-category", LogLevel.Trace);

var app = builder.Build();

// Configure the HTTP request pipeline.
if (app.Environment.IsDevelopment())
{
    app.UseSwagger();
    app.UseSwaggerUI();
}

app.UseHttpsRedirection();

app.UseAuthorization();

app.MapControllers();

app.Run();
With the NuGet package installed and the provider being registered with dependency injection, the app is ready to log. With constructor injection, either ILogger or the generic-type alternative ILogger<TCategoryName> is required. When these implementations are resolved, ApplicationInsightsLoggerProvider provides them. Logged messages or exceptions are sent to Application Insights.
Consider the following example controller:
public class ValuesController : ControllerBase
{
    private readonly ILogger _logger;

    public ValuesController(ILogger<ValuesController> logger)
    {
        _logger = logger;
    }

    [HttpGet]
    public ActionResult<IEnumerable<string>> Get()
    {
        _logger.LogWarning("An example of a Warning trace..");
        _logger.LogError("An example of an Error level message");

        return new string[] { "value1", "value2" };
    }
}
For more information, see Logging in ASP.NET Core and What Application Insights telemetry type is produced from ILogger logs? Where can I see ILogger logs in Application Insights?.
Insert diagnostic log calls (System.Diagnostics.Trace / log4net / NLog)
If you use System.Diagnostics.Trace, a typical call would be:
System.Diagnostics.Trace.TraceWarning("Slow response - database01");
If you prefer log4net or NLog, use:
logger.Warn("Slow response - database01");
Use EventSource events
You can configure System.Diagnostics.Tracing.EventSource events to be sent to Application Insights as traces.
Install the
Microsoft.ApplicationInsights.EventSourceListenerNuGet package.Edit the
TelemetryModulessection of the ApplicationInsights.config file:<Add Type="Microsoft.ApplicationInsights.EventSourceListener.EventSourceTelemetryModule, Microsoft.ApplicationInsights.EventSourceListener"> <Sources> <Add Name="MyCompany" Level="Verbose" /> </Sources> </Add>
For each source, you can set the following parameters:
- Name specifies the name of the EventSource to collect.
- Level specifies the logging level to collect: Critical, Error, Informational, LogAlways, Verbose, or Warning.
- Keywords (optional) specify the integer value of keyword combinations to use.
Use DiagnosticSource events
You can configure System.Diagnostics.DiagnosticSource events to be sent to Application Insights as traces.
Install the
Microsoft.ApplicationInsights.DiagnosticSourceListenerNuGet package.Edit the
TelemetryModulessection of the ApplicationInsights.config file:<Add Type="Microsoft.ApplicationInsights.DiagnosticSourceListener.DiagnosticSourceTelemetryModule, Microsoft.ApplicationInsights.DiagnosticSourceListener"> <Sources> <Add Name="MyDiagnosticSourceName" /> </Sources> </Add>
For each diagnostic source you want to trace, add an entry with the Name attribute set to the name of your diagnostic source.
Use ETW events
You can configure Event Tracing for Windows (ETW) events to be sent to Application Insights as traces.
Install the
Microsoft.ApplicationInsights.EtwCollectorNuGet package.Edit the "TelemetryModules" section of the ApplicationInsights.config file:
Note
ETW events can only be collected if the process that hosts the SDK runs under an identity that's a member of Performance Log Users or Administrators.
    <Add Type="Microsoft.ApplicationInsights.EtwCollector.EtwCollectorTelemetryModule, Microsoft.ApplicationInsights.EtwCollector">
      <Sources>
        <Add ProviderName="MyCompanyEventSourceName" Level="Verbose" />
      </Sources>
    </Add>
For each source, you can set the following parameters:
- ProviderName is the name of the ETW provider to collect.
- ProviderGuid specifies the GUID of the ETW provider to collect. It can be used instead of
ProviderName. - Level sets the logging level to collect. It can be Critical, Error, Informational, LogAlways, Verbose, or Warning.
- Keywords (optional) set the integer value of keyword combinations to use.
Use the Trace API directly
You can call the Application Insights trace API directly. The logging adapters use this API. For example:
TelemetryConfiguration configuration = TelemetryConfiguration.CreateDefault();
var telemetryClient = new TelemetryClient(configuration);
telemetryClient.TrackTrace("Slow response - database01");
An advantage of TrackTrace is that you can put relatively long data in the message. For example, you can encode POST data there.
You can also add a severity level to your message. And, like other telemetry, you can add property values to help filter or search for different sets of traces. For example:
TelemetryConfiguration configuration = TelemetryConfiguration.CreateDefault();
var telemetryClient = new TelemetryClient(configuration);
telemetryClient.TrackTrace("Slow database response",
                            SeverityLevel.Warning,
                            new Dictionary<string, string> { { "database", "db.ID" } });
Now you can easily filter out in Search all the messages of a particular severity level that relate to a particular database.
Console application
To add Application Insights logging to console applications, first install the following NuGet packages:
The following example uses the Microsoft.Extensions.Logging.ApplicationInsights package and demonstrates the default behavior for a console application. The Microsoft.Extensions.Logging.ApplicationInsights package should be used in a console application or whenever you want a bare minimum implementation of Application Insights without the full feature set such as metrics, distributed tracing, sampling, and telemetry initializers.
using Microsoft.ApplicationInsights.Channel;
using Microsoft.ApplicationInsights.Extensibility;
using Microsoft.Extensions.DependencyInjection;
using Microsoft.Extensions.Logging;

using var channel = new InMemoryChannel();

try
{
    IServiceCollection services = new ServiceCollection();
    services.Configure<TelemetryConfiguration>(config => config.TelemetryChannel = channel);
    services.AddLogging(builder =>
    {
        // Only Application Insights is registered as a logger provider
        builder.AddApplicationInsights(
            configureTelemetryConfiguration: (config) => config.ConnectionString = "<YourConnectionString>",
            configureApplicationInsightsLoggerOptions: (options) => { }
        );
    });

    IServiceProvider serviceProvider = services.BuildServiceProvider();
    ILogger<Program> logger = serviceProvider.GetRequiredService<ILogger<Program>>();

    logger.LogInformation("Logger is working...");
}
finally
{
    // Explicitly call Flush() followed by Delay, as required in console apps.
    // This ensures that even if the application terminates, telemetry is sent to the back end.
    channel.Flush();

    await Task.Delay(TimeSpan.FromMilliseconds(1000));
}
For more information, see What Application Insights telemetry type is produced from ILogger logs? Where can I see ILogger logs in Application Insights?.
Logging scopes
Note
The following guidance applies to ILogger scenarios (ASP.NET Core and console only). It doesn't apply to classic ASP.NET.
ApplicationInsightsLoggingProvider supports log scopes, which are enabled by default.
If the scope is of type IReadOnlyCollection<KeyValuePair<string,object>>, then each key/value pair in the collection is added to the Application Insights telemetry as custom properties. In the following example, logs are captured as TraceTelemetry and have ("MyKey", "MyValue") in properties.
using (_logger.BeginScope(new Dictionary<string, object> { ["MyKey"] = "MyValue" }))
{
    _logger.LogError("An example of an Error level message");
}
If any other type is used as a scope, it gets stored under the property Scope in Application Insights telemetry. In the following example, TraceTelemetry has a property called Scope that contains the scope.
using (_logger.BeginScope("hello scope"))
{
    _logger.LogError("An example of an Error level message");
}
Find your logs
Run your app in debug mode or deploy it live.
Explore in Search
In your app's overview pane in the Application Insights portal, select Search where you can:
- Filter on log traces or on items with specific properties.
- Inspect a specific item in detail.
- Find other system log data that relates to the same user request (has the same operation ID).
- Save the configuration of a page as a favorite.
Note
If your application sends large amounts of data and you're using the Application Insights SDK for ASP.NET version 2.0.0-beta3 or later, the adaptive sampling feature might operate and send only a portion of your telemetry. Learn more about sampling.
Explore in Azure Monitor Logs
ILogger logs appear as trace telemetry (table traces in Application Insights and AppTraces in Log Analytics).
Example
In the Azure portal, go to Application Insights and run:
traces
| where severityLevel >= 2 // 2=Warning, 1=Information, 0=Verbose
| take 50
Distributed tracing
Modern cloud and microservices architectures have enabled simple, independently deployable services that reduce costs while increasing availability and throughput. However, it has made overall systems more difficult to reason about and debug. Distributed tracing solves this problem by providing a performance profiler that works like call stacks for cloud and microservices architectures.
Azure Monitor provides two experiences for consuming distributed trace data: the transaction diagnostics view for a single transaction/request and the application map view to show how systems interact.
Application Insights can monitor each component separately and detect which component is responsible for failures or performance degradation by using distributed telemetry correlation. This article explains the data model, context-propagation techniques, protocols, and implementation of correlation tactics on different languages and platforms used by Application Insights.
Enable distributed tracing via Application Insights through autoinstrumentation or SDKs
The Application Insights agents and SDKs for .NET, .NET Core, Java, Node.js, and JavaScript all support distributed tracing natively.
With the proper Application Insights SDK installed and configured, tracing information is automatically collected for popular frameworks, libraries, and technologies by SDK dependency autocollectors. The full list of supported technologies is available in the Dependency autocollection documentation.
Any technology also can be tracked manually with a call to TrackDependency on the TelemetryClient.
Data model for telemetry correlation
Application Insights defines a data model for distributed telemetry correlation. To associate telemetry with a logical operation, every telemetry item has a context field called operation_Id. Every telemetry item in the distributed trace shares this identifier. So even if you lose telemetry from a single layer, you can still associate telemetry reported by other components.
A distributed logical operation typically consists of a set of smaller operations that are requests processed by one of the components. Request telemetry defines these operations. Every request telemetry item has its own id that identifies it uniquely and globally. And all telemetry items (such as traces and exceptions) that are associated with the request should set the operation_parentId to the value of the request id.
Dependency telemetry represents every outgoing operation, such as an HTTP call to another component. It also defines its own id that's globally unique. Request telemetry, initiated by this dependency call, uses this id as its operation_parentId.
You can build a view of the distributed logical operation by using operation_Id, operation_parentId, and request.id with dependency.id. These fields also define the causality order of telemetry calls.
In a microservices environment, traces from components can go to different storage items. Every component can have its own connection string in Application Insights. To get telemetry for the logical operation, Application Insights queries data from every storage item.
When the number of storage items is large, you need a hint about where to look next. The Application Insights data model defines two fields to solve this problem: request.source and dependency.target. The first field identifies the component that initiated the dependency request. The second field identifies which component returned the response of the dependency call.
For information on querying from multiple disparate instances, see Query data across Log Analytics workspaces, applications, and resources in Azure Monitor.
Example
Let's look at an example. An application called Stock Prices shows the current market price of a stock by using an external API called Stock. The Stock Prices application has a page called Stock page that the client web browser opens by using GET /Home/Stock. The application queries the Stock API by using the HTTP call GET /api/stock/value.
You can analyze the resulting telemetry by running a query:
(requests | union dependencies | union pageViews)
| where operation_Id == "STYz"
| project timestamp, itemType, name, id, operation_ParentId, operation_Id
In the results, all telemetry items share the root operation_Id. When an Ajax call is made from the page, a new unique ID (qJSXU) is assigned to the dependency telemetry, and the ID of the pageView is used as operation_ParentId. The server request then uses the Ajax ID as operation_ParentId.
| itemType | name | ID | operation_ParentId | operation_Id |
|---|---|---|---|---|
| pageView | Stock page | STYz |
STYz |
|
| dependency | GET /Home/Stock | qJSXU |
STYz |
STYz |
| request | GET Home/Stock | KqKwlrSt9PA= |
qJSXU |
STYz |
| dependency | GET /api/stock/value | bBrf2L7mm2g= |
KqKwlrSt9PA= |
STYz |
When the call GET /api/stock/value is made to an external service, you need to know the identity of that server so you can set the dependency.target field appropriately. When the external service doesn't support monitoring, target is set to the host name of the service. An example is stock-prices-api.com. But if the service identifies itself by returning a predefined HTTP header, target contains the service identity that allows Application Insights to build a distributed trace by querying telemetry from that service.
Correlation headers using W3C TraceContext
Application Insights is transitioning to W3C Trace-Context, which defines:
traceparent: Carries the globally unique operation ID and unique identifier of the call.tracestate: Carries system-specific tracing context.
The latest version of the Application Insights SDK supports the Trace-Context protocol, but you might need to opt in to it. (Backward compatibility with the previous correlation protocol supported by the Application Insights SDK is maintained.)
The correlation HTTP protocol, also called Request-Id, is being deprecated. This protocol defines two headers:
Request-Id: Carries the globally unique ID of the call.Correlation-Context: Carries the name-value pairs collection of the distributed trace properties.
Application Insights also defines the extension for the correlation HTTP protocol. It uses Request-Context name-value pairs to propagate the collection of properties used by the immediate caller or callee. The Application Insights SDK uses this header to set the dependency.target and request.source fields.
The W3C Trace-Context and Application Insights data models map in the following way:
| Application Insights | W3C TraceContext |
|---|---|
Id of Request and Dependency |
parent-id |
Operation_Id |
trace-id |
Operation_ParentId |
parent-id of this span's parent span. This field must be empty if it's a root span. |
For more information, see Application Insights telemetry data model.
Enable W3C distributed tracing support
W3C TraceContext-based distributed tracing is enabled by default in all recent .NET Framework/.NET Core SDKs, along with backward compatibility with legacy Request-Id protocol.
Telemetry correlation
Correlation is handled by default when onboarding an app. No special actions are required.
.NET runtime supports distributed with the help of Activity and DiagnosticSource
The Application Insights .NET SDK uses DiagnosticSource and Activity to collect and correlate telemetry.
Dependencies
Automatically tracked dependencies
Application Insights SDKs for .NET and .NET Core ship with DependencyTrackingTelemetryModule, which is a telemetry module that automatically collects dependencies. The module DependencyTrackingTelemetryModule is shipped as the Microsoft.ApplicationInsights.DependencyCollector NuGet package and brought automatically when you use either the Microsoft.ApplicationInsights.Web NuGet package or the Microsoft.ApplicationInsights.AspNetCore NuGet package.
Currently, DependencyTrackingTelemetryModule tracks the following dependencies automatically:
| Dependencies | Details |
|---|---|
| HTTP/HTTPS | Local or remote HTTP/HTTPS calls. |
| WCF calls | Only tracked automatically if HTTP-based bindings are used. |
| SQL | Calls made with SqlClient. See the section Advanced SQL tracking to get full SQL query for capturing SQL queries. |
| Azure Blob Storage, Table Storage, or Queue Storage | Calls made with the Azure Storage client. |
| Azure Event Hubs client SDK | Use the latest package: https://nuget.org/packages/Azure.Messaging.EventHubs. |
| Azure Service Bus client SDK | Use the latest package: https://nuget.org/packages/Azure.Messaging.ServiceBus. |
| Azure Cosmos DB | Tracked automatically if HTTP/HTTPS is used. Tracing for operations in direct mode with TCP are captured automatically using preview package >= 3.33.0-preview. For more details, visit the documentation. |
If the dependency isn't autocollected, you can track it manually with a track dependency call.
For more information about how dependency tracking works, see Dependency tracking in Application Insights.
How does automatic dependency monitoring work?
Bytecode instrumentation is applied around selected methods using
InstrumentationEngine, enabled viaStatusMonitoror the Application Insights extension for Azure App Service.EventSourcecallbacks are used to capture telemetry from .NET libraries that emit structured events.DiagnosticSourcecallbacks are used in newer .NET and .NET Core SDKs to collect telemetry from libraries that support distributed tracing.
Set up automatic dependency tracking in console apps
To automatically track dependencies from .NET console apps, install the NuGet package Microsoft.ApplicationInsights.DependencyCollector and initialize DependencyTrackingTelemetryModule:
    DependencyTrackingTelemetryModule depModule = new DependencyTrackingTelemetryModule();
    depModule.Initialize(TelemetryConfiguration.Active);
Note
For .NET Core console apps, TelemetryConfiguration.Active is obsolete.
Manually tracking dependencies
The following examples of dependencies, which aren't automatically collected, require manual tracking:
- Azure Cosmos DB is tracked automatically only if HTTP/HTTPS](/cosmos-db/performance-tips#networking) is used. TCP mode isn't automatically captured by Application Insights for SDK versions older than
2.22.0-Beta1. - Redis
For those dependencies not automatically collected by SDK, you can track them manually by using the TrackDependency API that's used by the standard autocollection modules.
Example
If you build your code with an assembly that you didn't write yourself, you could time all the calls to it. This scenario would allow you to find out what contribution it makes to your response times.
To have this data displayed in the dependency charts in Application Insights, send it by using TrackDependency:
    var startTime = DateTime.UtcNow;
    var timer = System.Diagnostics.Stopwatch.StartNew();
    try
    {
        // making dependency call
        success = dependency.Call();
    }
    finally
    {
        timer.Stop();
        telemetryClient.TrackDependency("myDependencyType", "myDependencyCall", "myDependencyData", startTime, timer.Elapsed, success);
    }
Alternatively, TelemetryClient provides the extension methods StartOperation and StopOperation, which can be used to manually track dependencies as shown in Outgoing dependencies tracking.
Disabling the standard dependency tracking module
For more information, see telemetry modules.
Advanced SQL tracking to get full SQL query
For SQL calls, the name of the server and database is always collected and stored as the name of the collected DependencyTelemetry. Another field, called data, can contain the full SQL query text.
Note
Azure Functions requires separate settings to enable SQL text collection. For more information, see Enable SQL query collection.
ASP.NET
For ASP.NET applications, the full SQL query text is collected with the help of byte code instrumentation, which requires using the instrumentation engine or by using the Microsoft.Data.SqlClient NuGet package instead of the System.Data.SqlClient library. Platform-specific steps to enable full SQL Query collection are described in the following table.
| Platform | Steps needed to get full SQL query |
|---|---|
| Web Apps in Azure App Service | In your web app control panel, open the Application Insights pane and enable SQL Commands under .NET. |
| IIS Server (Azure Virtual Machines, on-premises, and so on) | Either use the Microsoft.Data.SqlClient NuGet package or use the Application Insights Agent PowerShell Module to install the instrumentation engine and restart IIS. |
| Azure Cloud Services | Add a startup task to install StatusMonitor. Your app should be onboarded to the ApplicationInsights SDK at build time by installing NuGet packages for ASP.NET or ASP.NET Core applications. |
| IIS Express | Use the Microsoft.Data.SqlClient NuGet package. |
| WebJobs in Azure App Service | Use the Microsoft.Data.SqlClient NuGet package. |
In addition to the preceding platform-specific steps, you must also explicitly opt in to enable SQL command collection by modifying the ApplicationInsights.config file with the following code:
<TelemetryModules>
  <Add Type="Microsoft.ApplicationInsights.DependencyCollector.DependencyTrackingTelemetryModule, Microsoft.AI.DependencyCollector">
    <EnableSqlCommandTextInstrumentation>true</EnableSqlCommandTextInstrumentation>
  </Add>
ASP.NET Core
For ASP.NET Core applications, It's required to opt in to SQL Text collection by using:
services.ConfigureTelemetryModule<DependencyTrackingTelemetryModule>((module, o) => { module. EnableSqlCommandTextInstrumentation = true; });
In the preceding cases, the proper way of validating that the instrumentation engine is correctly installed is by validating that the SDK version of collected DependencyTelemetry is rddp. Use of rdddsd or rddf indicates dependencies are collected via DiagnosticSource or EventSource callbacks, so the full SQL query isn't captured.
Exceptions
Exceptions in web applications can be reported with Application Insights. You can correlate failed requests with exceptions and other events on both the client and server so that you can quickly diagnose the causes. In this section, you learn how to set up exception reporting, report exceptions explicitly, diagnose failures, and more.
Set up exception reporting
You can set up Application Insights to report exceptions that occur in either the server or the client. Depending on the platform your application is dependent on, you need the appropriate extension or SDK.
Server-side
To have exceptions reported from your server-side application, consider the following scenarios:
- Add the Application Insights Extension for Azure web apps.
- Add the Application Monitoring Extension for Azure VMs and Azure virtual machine scale sets IIS-hosted apps.
- Add the Application Insights SDK to your app code, run Application Insights Agent for IIS web servers, or enable the Java agent for Java web apps.
Client-side
The JavaScript SDK provides the ability for client-side reporting of exceptions that occur in web browsers. To set up exception reporting on the client, see Application Insights for webpages.
Application frameworks
With some application frameworks, more configuration is required. Consider the following technologies:
Important
This section is focused on .NET Framework apps from a code example perspective. Some of the methods that work for .NET Framework are obsolete in the .NET Core SDK.
Diagnose failures and exceptions
Azure portal
Application Insights comes with a curated Application Performance Management experience to help you diagnose failures in your monitored applications.
For detailed instructions, see Investigate failures, performance, and transactions with Application Insights.
Visual Studio
Open the app solution in Visual Studio. Run the app, either on your server or on your development machine by using F5. Re-create the exception.
Open the Application Insights Search telemetry window in Visual Studio. While debugging, select the Application Insights dropdown box.
Select an exception report to show its stack trace. To open the relevant code file, select a line reference in the stack trace.
If CodeLens is enabled, you see data about the exceptions:
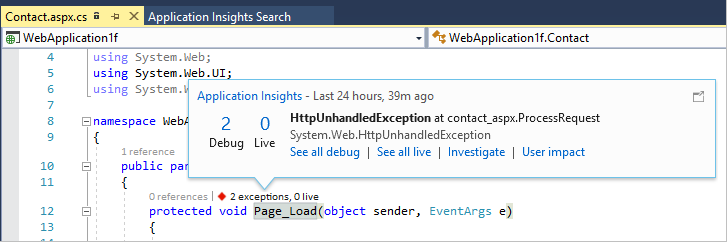

Custom tracing and log data
To get diagnostic data specific to your app, you can insert code to send your own telemetry data. Your custom telemetry or log data is displayed in diagnostic search alongside the request, page view, and other automatically collected data.
Using the TelemetryClient, you have several APIs available:
- TelemetryClient.TrackEvent is typically used for monitoring usage patterns, but the data it sends also appears under Custom Events in diagnostic search. Events are named and can carry string properties and numeric metrics on which you can filter your diagnostic searches.
- TelemetryClient.TrackTrace lets you send longer data such as POST information.
- TelemetryClient.TrackException sends exception details, such as stack traces to Application Insights.
To see these events, on the left menu, open Search. Select the dropdown menu Event types, and then choose Custom Event, Trace, or Exception.

Note
If your app generates large amounts of telemetry, the adaptive sampling module automatically reduces the volume sent to the portal by sending only a representative fraction of events. Events that are part of the same operation are selected or deselected as a group so that you can navigate between related events. For more information, see Sampling in Application Insights.
See request POST data
Request details don't include the data sent to your app in a POST call. To have this data reported:
- Add the Application Insights SDK to your app code.
- Insert code in your application to call Microsoft.ApplicationInsights.TrackTrace(). Send the POST data in the message parameter. There's a limit to the permitted size, so you should try to send only the essential data.
- When you investigate a failed request, find the associated traces.
Capture exceptions and related diagnostic data
By default, not all exceptions that cause failures in your app appear in the portal. If you use the JavaScript SDK in your webpages, you see browser exceptions. However, most server-side exceptions are intercepted by IIS, so you need to add some code to capture and report them.
You can:
- Log exceptions explicitly by inserting code in exception handlers to report the exceptions.
- Capture exceptions automatically by configuring your ASP.NET framework. The necessary additions are different for different types of framework.
Report exceptions explicitly
The simplest way to report is to insert a call to trackException() in an exception handler.
C#
var telemetry = new TelemetryClient();

try
{
    // ...
}
catch (Exception ex)
{
    var properties = new Dictionary<string, string>
    {
        ["Game"] = currentGame.Name
    };

    var measurements = new Dictionary<string, double>
    {
        ["Users"] = currentGame.Users.Count
    };

    // Send the exception telemetry:
    telemetry.TrackException(ex, properties, measurements);
}
JavaScript
try
{
    // ...
}
catch (ex)
{
    appInsights.trackException(ex, "handler loc",
    {
        Game: currentGame.Name,
        State: currentGame.State.ToString()
    });
}
The properties and measurements parameters are optional, but they're useful for filtering and adding extra information. For example, if you have an app that can run several games, you could find the exception reports related to a particular game. You can add as many items as you want to each dictionary.
Browser exceptions
Most browser exceptions are reported.
If your webpage includes script files from content delivery networks or other domains, ensure your script tag has the attribute crossorigin="anonymous" and that the server sends CORS headers. This behavior allows you to get a stack trace and detail for unhandled JavaScript exceptions from these resources.
Reuse your telemetry client
Note
We recommend that you instantiate the TelemetryClient once and reuse it throughout the life of an application.
With Dependency Injection (DI) in .NET, the appropriate .NET SDK, and correctly configuring Application Insights for DI, you can require the TelemetryClient as a constructor parameter.
public class ExampleController : ApiController
{
    private readonly TelemetryClient _telemetryClient;

    public ExampleController(TelemetryClient telemetryClient)
    {
        _telemetryClient = telemetryClient;
    }
}
In the preceding example, the TelemetryClient is injected into the ExampleController class.
Web forms
For web forms, the HTTP Module is able to collect the exceptions when there are no redirects configured with CustomErrors. However, when you have active redirects, add the following lines to the Application_Error function in Global.asax.cs.
void Application_Error(object sender, EventArgs e)
{
    if (HttpContext.Current.IsCustomErrorEnabled &&
        Server.GetLastError () != null)
    {
        _telemetryClient.TrackException(Server.GetLastError());
    }
}
In the preceding example, the _telemetryClient is a class-scoped variable of type TelemetryClient.
MVC
Starting with Application Insights Web SDK version 2.6 (beta 3 and later), Application Insights collects unhandled exceptions thrown in the MVC 5+ controllers methods automatically. If you previously added a custom handler to track such exceptions, you can remove it to prevent double tracking of exceptions.
There are several scenarios when an exception filter can't correctly handle errors when exceptions are thrown:
- From controller constructors
- From message handlers
- During routing
- During response content serialization
- During application start-up
- In background tasks
All exceptions handled by application still need to be tracked manually. Unhandled exceptions originating from controllers typically result in a 500 "Internal Server Error" response. If such response is manually constructed as a result of a handled exception, or no exception at all, it's tracked in corresponding request telemetry with ResultCode 500. However, the Application Insights SDK is unable to track a corresponding exception.
Prior versions support
If you use MVC 4 (and prior) of Application Insights Web SDK 2.5 (and prior), refer to the following examples to track exceptions.
Expand to view instructions for prior versions
If the CustomErrors configuration is Off, exceptions are available for the HTTP Module to collect. However, if it's set to RemoteOnly (default) or On, the exception is cleared and not available for Application Insights to automatically collect. You can fix that behavior by overriding the System.Web.Mvc.HandleErrorAttribute class and applying the overridden class as shown for the different MVC versions here (see the GitHub source):
using System;
using System.Web.Mvc;
using Microsoft.ApplicationInsights;

namespace MVC2App.Controllers
{
    [AttributeUsage(AttributeTargets.Class | AttributeTargets.Method, Inherited = true, AllowMultiple = true)]
    public class AiHandleErrorAttribute : HandleErrorAttribute
    {
        public override void OnException(ExceptionContext filterContext)
        {
            if (filterContext != null && filterContext.HttpContext != null && filterContext.Exception != null)
            {
                //The attribute should track exceptions only when CustomErrors setting is On
                //if CustomErrors is Off, exceptions will be caught by AI HTTP Module
                if (filterContext.HttpContext.IsCustomErrorEnabled)
                {   //Or reuse instance (recommended!). See note above.
                    var ai = new TelemetryClient();
                    ai.TrackException(filterContext.Exception);
                }
            }
            base.OnException(filterContext);
        }
    }
}
MVC 2
Replace the HandleError attribute with your new attribute in your controllers:
    namespace MVC2App.Controllers
    {
        [AiHandleError]
        public class HomeController : Controller
        {
            // Omitted for brevity
        }
    }
MVC 3
Register AiHandleErrorAttribute as a global filter in Global.asax.cs:
public class MyMvcApplication : System.Web.HttpApplication
{
    public static void RegisterGlobalFilters(GlobalFilterCollection filters)
    {
        filters.Add(new AiHandleErrorAttribute());
    }
}
MVC 4, MVC 5
Register AiHandleErrorAttribute as a global filter in FilterConfig.cs:
public class FilterConfig
{
    public static void RegisterGlobalFilters(GlobalFilterCollection filters)
    {
        // Default replaced with the override to track unhandled exceptions
        filters.Add(new AiHandleErrorAttribute());
    }
}
Web API
Starting with Application Insights Web SDK version 2.6 (beta 3 and later), Application Insights collects unhandled exceptions thrown in the controller methods automatically for Web API 2+. If you previously added a custom handler to track such exceptions, as described in the following examples, you can remove it to prevent double tracking of exceptions.
There are several cases that the exception filters can't handle. For example:
- Exceptions thrown from controller constructors.
- Exceptions thrown from message handlers.
- Exceptions thrown during routing.
- Exceptions thrown during response content serialization.
- Exception thrown during application startup.
- Exception thrown in background tasks.
All exceptions handled by application still need to be tracked manually. Unhandled exceptions originating from controllers typically result in a 500 "Internal Server Error" response. If such a response is manually constructed as a result of a handled exception, or no exception at all, it's tracked in a corresponding request telemetry with ResultCode 500. However, the Application Insights SDK can't track a corresponding exception.
Prior versions support
If you use Web API 1 (and earlier) of Application Insights Web SDK 2.5 (and earlier), refer to the following examples to track exceptions.
Expand to view instructions for prior versions
Web API 1.x
Override System.Web.Http.Filters.ExceptionFilterAttribute:
using System.Web.Http.Filters;
using Microsoft.ApplicationInsights;

namespace WebAPI.App_Start
{
    public class AiExceptionFilterAttribute : ExceptionFilterAttribute
    {
    public override void OnException(HttpActionExecutedContext actionExecutedContext)
    {
        if (actionExecutedContext != null && actionExecutedContext.Exception != null)
        {  //Or reuse instance (recommended!). See note above.
            var ai = new TelemetryClient();
            ai.TrackException(actionExecutedContext.Exception);
        }
        base.OnException(actionExecutedContext);
    }
    }
}
You could add this overridden attribute to specific controllers, or add it to the global filter configuration in the WebApiConfig class:
using System.Web.Http;
using WebApi1.x.App_Start;

namespace WebApi1.x
{
    public static class WebApiConfig
    {
        public static void Register(HttpConfiguration config)
        {
            config.Routes.MapHttpRoute(
                name: "DefaultApi",
                routeTemplate: "api/{controller}/{id}",
                defaults: new { id = RouteParameter.Optional });

            // ...
            config.EnableSystemDiagnosticsTracing();

            // Capture exceptions for Application Insights:
            config.Filters.Add(new AiExceptionFilterAttribute());
        }
    }
}
Web API 2.x
Add an implementation of IExceptionLogger:
using System.Web.Http.ExceptionHandling;
using Microsoft.ApplicationInsights;

namespace ProductsAppPureWebAPI.App_Start
{
    public class AiExceptionLogger : ExceptionLogger
    {
        public override void Log(ExceptionLoggerContext context)
        {
            if (context != null && context.Exception != null)
            {
                //or reuse instance (recommended!). see note above
                var ai = new TelemetryClient();
                ai.TrackException(context.Exception);
            }
            base.Log(context);
        }
    }
}
Add this snippet to the services in WebApiConfig:
using System.Web.Http;
using System.Web.Http.ExceptionHandling;
using ProductsAppPureWebAPI.App_Start;

namespace WebApi2WithMVC
{
    public static class WebApiConfig
    {
        public static void Register(HttpConfiguration config)
        {
            // Web API configuration and services

            // Web API routes
            config.MapHttpAttributeRoutes();

            config.Routes.MapHttpRoute(
                name: "DefaultApi",
                routeTemplate: "api/{controller}/{id}",
                defaults: new { id = RouteParameter.Optional });

            config.Services.Add(typeof(IExceptionLogger), new AiExceptionLogger());
        }
    }
}
As alternatives, you could:
- Replace the only
ExceptionHandlerinstance with a custom implementation ofIExceptionHandler. This exception handler is only called when the framework is still able to choose which response message to send, not when the connection is aborted, for instance. - Use exception filters, as described in the preceding section on Web API 1.x controllers, which aren't called in all cases.
WCF
Add a class that extends Attribute and implements IErrorHandler and IServiceBehavior.
    using System;
    using System.Collections.Generic;
    using System.Linq;
    using System.ServiceModel.Description;
    using System.ServiceModel.Dispatcher;
    using System.Web;
    using Microsoft.ApplicationInsights;

    namespace WcfService4.ErrorHandling
    {
      public class AiLogExceptionAttribute : Attribute, IErrorHandler, IServiceBehavior
      {
        public void AddBindingParameters(ServiceDescription serviceDescription,
            System.ServiceModel.ServiceHostBase serviceHostBase,
            System.Collections.ObjectModel.Collection<ServiceEndpoint> endpoints,
            System.ServiceModel.Channels.BindingParameterCollection bindingParameters)
        {
        }

        public void ApplyDispatchBehavior(ServiceDescription serviceDescription,
            System.ServiceModel.ServiceHostBase serviceHostBase)
        {
            foreach (ChannelDispatcher disp in serviceHostBase.ChannelDispatchers)
            {
                disp.ErrorHandlers.Add(this);
            }
        }

        public void Validate(ServiceDescription serviceDescription,
            System.ServiceModel.ServiceHostBase serviceHostBase)
        {
        }

        bool IErrorHandler.HandleError(Exception error)
        {//or reuse instance (recommended!). see note above
            var ai = new TelemetryClient();

            ai.TrackException(error);
            return false;
        }

        void IErrorHandler.ProvideFault(Exception error,
            System.ServiceModel.Channels.MessageVersion version,
            ref System.ServiceModel.Channels.Message fault)
        {
        }
      }
    }
Add the attribute to the service implementations:
namespace WcfService4
{
    [AiLogException]
    public class Service1 : IService1
    {
        // Omitted for brevity
    }
}
Exception performance counters
If you installed the Azure Monitor Application Insights Agent on your server, you can get a chart of the exceptions rate measured by .NET. Both handled and unhandled .NET exceptions are included.
Open a metrics explorer tab and add a new chart. Under Performance Counters, select Exception rate.
The .NET Framework calculates the rate by counting the number of exceptions in an interval and dividing by the length of the interval.
This count is different from the Exceptions count calculated by the Application Insights portal counting TrackException reports. The sampling intervals are different, and the SDK doesn't send TrackException reports for all handled and unhandled exceptions.
Custom metric collection
The Azure Monitor Application Insights .NET and .NET Core SDKs have two different methods of collecting custom metrics:
- The
TrackMetric()method, which lacks preaggregation. - The
GetMetric()method, which has preaggregation.
We recommend using aggregation, so TrackMetric() is no longer the preferred method of collecting custom metrics. This article walks you through using the GetMetric() method and some of the rationale behind how it works.
Expand to learn more about preaggregating vs. non-preaggregating API
The TrackMetric() method sends raw telemetry denoting a metric. It's inefficient to send a single telemetry item for each value. The TrackMetric() method is also inefficient in terms of performance because every TrackMetric(item) goes through the full SDK pipeline of telemetry initializers and processors.
Unlike TrackMetric(), GetMetric() handles local preaggregation for you and then only submits an aggregated summary metric at a fixed interval of one minute. If you need to closely monitor some custom metric at the second or even millisecond level, you can do so while only incurring the storage and network traffic cost of only monitoring every minute. This behavior also greatly reduces the risk of throttling occurring because the total number of telemetry items that need to be sent for an aggregated metric are greatly reduced.
In Application Insights, custom metrics collected via TrackMetric() and GetMetric() aren't subject to sampling. Sampling important metrics can lead to scenarios where alerts built around those metrics become unreliable. By never sampling your custom metrics, you can generally be confident that when your alert thresholds are breached, an alert fires. Because custom metrics aren't sampled, there are some potential concerns.
Trend tracking in a metric every second, or at an even more granular interval, can result in:
- Increased data storage costs. There's a cost associated with how much data you send to Azure Monitor. The more data you send, the greater the overall cost of monitoring.
- Increased network traffic or performance overhead. In some scenarios, this overhead could have both a monetary and application performance cost.
- Risk of ingestion throttling. Azure Monitor drops ("throttles") data points when your app sends a high rate of telemetry in a short time interval.
Throttling is a concern because it can lead to missed alerts. The condition to trigger an alert could occur locally and then be dropped at the ingestion endpoint because of too much data being sent. We don't recommend using TrackMetric() for .NET and .NET Core unless you implemented your own local aggregation logic. If you're trying to track every instance an event occurs over a given time period, you might find that TrackEvent() is a better fit. Keep in mind that unlike custom metrics, custom events are subject to sampling. You can still use TrackMetric() even without writing your own local preaggregation. But if you do so, be aware of the pitfalls.
In summary, we recommend GetMetric() because it does preaggregation, it accumulates values from all the Track() calls, and sends a summary/aggregate once every minute. The GetMetric() method can significantly reduce the cost and performance overhead by sending fewer data points while still collecting all relevant information.
Get started with GetMetric
For our examples, we're going to use a basic .NET Core 3.1 worker service application. If you want to replicate the test environment used with these examples, follow steps 1-6 under .NET Core Worker Service application. These steps add Application Insights to a basic worker service project template. The concepts apply to any general application where the SDK can be used, including web apps and console apps.
Send metrics
Replace the contents of your worker.cs file with the following code:
using System;
using System.Threading;
using System.Threading.Tasks;
using Microsoft.Extensions.Hosting;
using Microsoft.Extensions.Logging;
using Microsoft.ApplicationInsights;

namespace WorkerService3
{
    public class Worker : BackgroundService
    {
        private readonly ILogger<Worker> _logger;
        private TelemetryClient _telemetryClient;

        public Worker(ILogger<Worker> logger, TelemetryClient tc)
        {
            _logger = logger;
            _telemetryClient = tc;
        }

        protected override async Task ExecuteAsync(CancellationToken stoppingToken)
        {   // The following line demonstrates usages of GetMetric API.
            // Here "computersSold", a custom metric name, is being tracked with a value of 42 every second.
            while (!stoppingToken.IsCancellationRequested)
            {
                _telemetryClient.GetMetric("ComputersSold").TrackValue(42);

                _logger.LogInformation("Worker running at: {time}", DateTimeOffset.Now);
                await Task.Delay(1000, stoppingToken);
            }
        }
    }
}
When you run the sample code, you see the while loop repeatedly executing with no telemetry being sent in the Visual Studio output window. A single telemetry item is sent around the 60-second mark, which in our test looks like:
Application Insights Telemetry: {"name":"Microsoft.ApplicationInsights.Dev.00000000-0000-0000-0000-000000000000.Metric", "time":"2019-12-28T00:54:19.0000000Z",
"ikey":"00000000-0000-0000-0000-000000000000",
"tags":{"ai.application.ver":"1.0.0.0",
"ai.cloud.roleInstance":"Test-Computer-Name",
"ai.internal.sdkVersion":"m-agg2c:2.12.0-21496",
"ai.internal.nodeName":"Test-Computer-Name"},
"data":{"baseType":"MetricData",
"baseData":{"ver":2,"metrics":[{"name":"ComputersSold",
"kind":"Aggregation",
"value":1722,
"count":41,
"min":42,
"max":42,
"stdDev":0}],
"properties":{"_MS.AggregationIntervalMs":"42000",
"DeveloperMode":"true"}}}}
This single telemetry item represents an aggregate of 41 distinct metric measurements. Because we were sending the same value over and over again, we have a standard deviation (stDev) of 0 with identical maximum (max) and minimum (min) values. The value property represents a sum of all the individual values that were aggregated.
Note
The GetMetric method doesn't support tracking the last value (for example, gauge) or tracking histograms or distributions.
If we examine our Application Insights resource in the Logs (Analytics) experience, the individual telemetry item would look like the following screenshot.

Note
While the raw telemetry item didn't contain an explicit sum property/field once ingested, we create one for you. In this case, both the value and valueSum property represent the same thing.
You can also access your custom metric telemetry in the Metrics section of the portal as both a log-based and custom metric. The following screenshot is an example of a log-based metric.

Cache metric reference for high-throughput usage
Metric values might be observed frequently in some cases. For example, a high-throughput service that processes 500 requests per second might want to emit 20 telemetry metrics for each request. The result means tracking 10,000 values per second. In such high-throughput scenarios, users might need to help the SDK by avoiding some lookups.
For example, the preceding example performed a lookup for a handle for the metric ComputersSold and then tracked an observed value of 42. Instead, the handle might be cached for multiple track invocations:
//...

        protected override async Task ExecuteAsync(CancellationToken stoppingToken)
        {
            // This is where the cache is stored to handle faster lookup
            Metric computersSold = _telemetryClient.GetMetric("ComputersSold");
            while (!stoppingToken.IsCancellationRequested)
            {

                computersSold.TrackValue(42);

                computersSold.TrackValue(142);

                _logger.LogInformation("Worker running at: {time}", DateTimeOffset.Now);
                await Task.Delay(50, stoppingToken);
            }
        }
In addition to caching the metric handle, the preceding example also reduced Task.Delay to 50 milliseconds so that the loop would execute more frequently. The result is 772 TrackValue() invocations.
Multidimensional metrics
The examples in the previous section show zero-dimensional metrics. Metrics can also be multidimensional. We currently support up to 10 dimensions.
Here's an example of how to create a one-dimensional metric:
//...

        protected override async Task ExecuteAsync(CancellationToken stoppingToken)
        {
            // This is an example of a metric with a single dimension.
            // FormFactor is the name of the dimension.
            Metric computersSold= _telemetryClient.GetMetric("ComputersSold", "FormFactor");

            while (!stoppingToken.IsCancellationRequested)
            {
                // The number of arguments (dimension values)
                // must match the number of dimensions specified while GetMetric.
                // Laptop, Tablet, etc are values for the dimension "FormFactor"
                computersSold.TrackValue(42, "Laptop");
                computersSold.TrackValue(20, "Tablet");
                computersSold.TrackValue(126, "Desktop");


                _logger.LogInformation("Worker running at: {time}", DateTimeOffset.Now);
                await Task.Delay(50, stoppingToken);
            }
        }
Running the sample code for at least 60-seconds results in three distinct telemetry items being sent to Azure. Each item represents the aggregation of one of the three form factors. As before, you can further examine in the Logs (Analytics) view.

In the metrics explorer:

Notice that you can't split the metric by your new custom dimension or view your custom dimension with the metrics view.

By default, multidimensional metrics within the metric explorer aren't turned on in Application Insights resources.
Enable multidimensional metrics
To enable multidimensional metrics for an Application Insights resource, select Usage and estimated costs > Custom Metrics > Enable alerting on custom metric dimensions > OK. For more information, see Custom metrics dimensions and preaggregation.
After you made that change and sent new multidimensional telemetry, you can select Apply splitting.
Note
Only newly sent metrics after the feature was turned on in the portal have dimensions stored.

View your metric aggregations for each FormFactor dimension.

Use MetricIdentifier when there are more than three dimensions
Currently, 10 dimensions are supported. Using more than three dimensions requires the use of MetricIdentifier:
// Add "using Microsoft.ApplicationInsights.Metrics;" to use MetricIdentifier
// MetricIdentifier id = new MetricIdentifier("[metricNamespace]","[metricId],"[dim1]","[dim2]","[dim3]","[dim4]","[dim5]");
MetricIdentifier id = new MetricIdentifier("CustomMetricNamespace","ComputerSold", "FormFactor", "GraphicsCard", "MemorySpeed", "BatteryCapacity", "StorageCapacity");
Metric computersSold = _telemetryClient.GetMetric(id);
computersSold.TrackValue(110,"Laptop", "Nvidia", "DDR4", "39Wh", "1TB");
Custom metric configuration
If you want to alter the metric configuration, you must make alterations in the place where the metric is initialized.
Special dimension names
Metrics don't use the telemetry context of the TelemetryClient used to access them. Using special dimension names available as constants in the MetricDimensionNames class is the best workaround for this limitation.
Metric aggregates sent by the following Special Operation Request Size metric don't have Context.Operation.Name set to Special Operation. The TrackMetric() method or any other TrackXXX() method has OperationName set correctly to Special Operation.
        //...
        TelemetryClient specialClient;
        private static int GetCurrentRequestSize()
        {
            // Do stuff
            return 1100;
        }
        int requestSize = GetCurrentRequestSize()

        protected override async Task ExecuteAsync(CancellationToken stoppingToken)
        {
            while (!stoppingToken.IsCancellationRequested)
            {
                //...
                specialClient.Context.Operation.Name = "Special Operation";
                specialClient.GetMetric("Special Operation Request Size").TrackValue(requestSize);
                //...
            }

        }
In this circumstance, use the special dimension names listed in the MetricDimensionNames class to specify the TelemetryContext values.
For example, when the metric aggregate resulting from the next statement is sent to the Application Insights cloud endpoint, its Context.Operation.Name data field is set to Special Operation:
_telemetryClient.GetMetric("Request Size", MetricDimensionNames.TelemetryContext.Operation.Name).TrackValue(requestSize, "Special Operation");
The value of this special dimension is copied into TelemetryContext and isn't used as a normal dimension. If you want to also keep an operation dimension for normal metric exploration, you need to create a separate dimension for that purpose:
_telemetryClient.GetMetric("Request Size", "Operation Name", MetricDimensionNames.TelemetryContext.Operation.Name).TrackValue(requestSize, "Special Operation", "Special Operation");
Dimension and time-series capping
To prevent the telemetry subsystem from accidentally using up your resources, you can control the maximum number of data series per metric. The default limits are no more than 1,000 total data series per metric, and no more than 100 different values per dimension.
Important
Use low cardinal values for dimensions to avoid throttling.
In the context of dimension and time series capping, we use Metric.TrackValue(..) to make sure that the limits are observed. If the limits are already reached, Metric.TrackValue(..) returns False and the value isn't tracked. Otherwise, it returns True. This behavior is useful if the data for a metric originates from user input.
The MetricConfiguration constructor takes some options on how to manage different series within the respective metric and an object of a class implementing IMetricSeriesConfiguration that specifies aggregation behavior for each individual series of the metric:
var metConfig = new MetricConfiguration(seriesCountLimit: 100, valuesPerDimensionLimit:2,
                new MetricSeriesConfigurationForMeasurement(restrictToUInt32Values: false));

Metric computersSold = _telemetryClient.GetMetric("ComputersSold", "Dimension1", "Dimension2", metConfig);

// Start tracking.
computersSold.TrackValue(100, "Dim1Value1", "Dim2Value1");
computersSold.TrackValue(100, "Dim1Value1", "Dim2Value2");

// The following call gives 3rd unique value for dimension2, which is above the limit of 2.
computersSold.TrackValue(100, "Dim1Value1", "Dim2Value3");
// The above call doesn't track the metric, and returns false.
seriesCountLimitis the maximum number of data time series a metric can contain. When this limit is reached, calls toTrackValue()that would normally result in a new series returnfalse.valuesPerDimensionLimitlimits the number of distinct values per dimension in a similar manner.restrictToUInt32Valuesdetermines whether or not only non-negative integer values should be tracked.
Here's an example of how to send a message to know if cap limits are exceeded:
if (! computersSold.TrackValue(100, "Dim1Value1", "Dim2Value3"))
{
// Add "using Microsoft.ApplicationInsights.DataContract;" to use SeverityLevel.Error
_telemetryClient.TrackTrace("Metric value not tracked as value of one of the dimension exceeded the cap. Revisit the dimensions to ensure they are within the limits",
SeverityLevel.Error);
}
Custom operations tracking
Application Insights SDKs automatically track incoming HTTP requests and calls to dependent services, such as HTTP requests and SQL queries. Tracking and correlation of requests and dependencies give you visibility into the whole application's responsiveness and reliability across all microservices that combine this application.
There's a class of application patterns that can't be supported generically. Proper monitoring of such patterns requires manual code instrumentation. This section covers a few patterns that might require manual instrumentation, such as custom queue processing and running long-running background tasks.
This section provides guidance on how to track custom operations with the Application Insights SDK.
Overview
An operation is a logical piece of work run by an application. It has a name, start time, duration, result, and a context of execution like user name, properties, and result. If operation A was initiated by operation B, then operation B is set as a parent for A. An operation can have only one parent, but it can have many child operations. For more information on operations and telemetry correlation, see Application Insights telemetry correlation.
In the Application Insights .NET SDK, the operation is described by the abstract class OperationTelemetry and its descendants RequestTelemetry and DependencyTelemetry.
Incoming operations tracking
The Application Insights web SDK automatically collects HTTP requests for ASP.NET applications that run in an IIS pipeline and all ASP.NET Core applications. There are community-supported solutions for other platforms and frameworks. If the application isn't supported by any of the standard or community-supported solutions, you can instrument it manually.
Another example that requires custom tracking is the worker that receives items from the queue. For some queues, the call to add a message to this queue is tracked as a dependency. The high-level operation that describes message processing isn't automatically collected.
Let's see how such operations could be tracked.
On a high level, the task is to create RequestTelemetry and set known properties. After the operation is finished, you track the telemetry. The following example demonstrates this task.
HTTP request in Owin self-hosted app
In this example, trace context is propagated according to the HTTP Protocol for Correlation. You should expect to receive headers that are described there.
Expand to view code
public class ApplicationInsightsMiddleware : OwinMiddleware
{
    // You may create a new TelemetryConfiguration instance, reuse one you already have,
    // or fetch the instance created by Application Insights SDK.
    private readonly TelemetryConfiguration telemetryConfiguration = TelemetryConfiguration.CreateDefault();
    private readonly TelemetryClient telemetryClient = new TelemetryClient(telemetryConfiguration);

    public ApplicationInsightsMiddleware(OwinMiddleware next) : base(next) {}

    public override async Task Invoke(IOwinContext context)
    {
        // Let's create and start RequestTelemetry.
        var requestTelemetry = new RequestTelemetry
        {
            Name = $"{context.Request.Method} {context.Request.Uri.GetLeftPart(UriPartial.Path)}"
        };

        // If there is a Request-Id received from the upstream service, set the telemetry context accordingly.
        if (context.Request.Headers.ContainsKey("Request-Id"))
        {
            var requestId = context.Request.Headers.Get("Request-Id");
            // Get the operation ID from the Request-Id (if you follow the HTTP Protocol for Correlation).
            requestTelemetry.Context.Operation.Id = GetOperationId(requestId);
            requestTelemetry.Context.Operation.ParentId = requestId;
        }

        // StartOperation is a helper method that allows correlation of
        // current operations with nested operations/telemetry
        // and initializes start time and duration on telemetry items.
        var operation = telemetryClient.StartOperation(requestTelemetry);

        // Process the request.
        try
        {
            await Next.Invoke(context);
        }
        catch (Exception e)
        {
            requestTelemetry.Success = false;
            requestTelemetry.ResponseCode;
            telemetryClient.TrackException(e);
            throw;
        }
        finally
        {
            // Update status code and success as appropriate.
            if (context.Response != null)
            {
                requestTelemetry.ResponseCode = context.Response.StatusCode.ToString();
                requestTelemetry.Success = context.Response.StatusCode >= 200 && context.Response.StatusCode <= 299;
            }
            else
            {
                requestTelemetry.Success = false;
            }

            // Now it's time to stop the operation (and track telemetry).
            telemetryClient.StopOperation(operation);
        }
    }

    public static string GetOperationId(string id)
    {
        // Returns the root ID from the '|' to the first '.' if any.
        int rootEnd = id.IndexOf('.');
        if (rootEnd < 0)
            rootEnd = id.Length;

        int rootStart = id[0] == '|' ? 1 : 0;
        return id.Substring(rootStart, rootEnd - rootStart);
    }
}
The HTTP Protocol for Correlation also declares the Correlation-Context header. It's omitted here for simplicity.
Queue instrumentation
The W3C Trace Context and HTTP Protocol for Correlation pass correlation details with HTTP requests, but every queue protocol has to define how the same details are passed along the queue message. Some queue protocols, such as AMQP, allow passing more metadata. Other protocols, such as Azure Storage Queue, require the context to be encoded into the message payload.
Note
Cross-component tracing isn't supported for queues yet.
With HTTP, if your producer and consumer send telemetry to different Application Insights resources, transaction diagnostics experience and Application Map show transactions and map end-to-end. For queues, this capability isn't supported yet.
Service Bus queue
For tracing information, see Distributed tracing and correlation through Azure Service Bus messaging.
Azure Storage queue
The following example shows how to track the Azure Storage queue operations and correlate telemetry between the producer, the consumer, and Azure Storage.
The Storage queue has an HTTP API. All calls to the queue are tracked by the Application Insights Dependency Collector for HTTP requests. It's configured by default on ASP.NET and ASP.NET Core applications. With other kinds of applications, see the Console applications documentation.
You also might want to correlate the Application Insights operation ID with the Storage request ID. For information on how to set and get a Storage request client and a server request ID, see Monitor, diagnose, and troubleshoot Azure Storage.
Enqueue
Because Storage queues support the HTTP API, all operations with the queue are automatically tracked by Application Insights. In many cases, this instrumentation should be enough. To correlate traces on the consumer side with producer traces, you must pass some correlation context similarly to how we do it in the HTTP Protocol for Correlation.
This example shows how to track the Enqueue operation. You can:
- Correlate retries (if any): They all have one common parent that's the
Enqueueoperation. Otherwise, they're tracked as children of the incoming request. If there are multiple logical requests to the queue, it might be difficult to find which call resulted in retries. - Correlate Storage logs (if and when needed): They're correlated with Application Insights telemetry.
The Enqueue operation is the child of a parent operation. An example is an incoming HTTP request. The HTTP dependency call is the child of the Enqueue operation and the grandchild of the incoming request.
public async Task Enqueue(CloudQueue queue, string message)
{
    var operation = telemetryClient.StartOperation<DependencyTelemetry>("enqueue " + queue.Name);
    operation.Telemetry.Type = "Azure queue";
    operation.Telemetry.Data = "Enqueue " + queue.Name;

    // MessagePayload represents your custom message and also serializes correlation identifiers into payload.
    // For example, if you choose to pass payload serialized to JSON, it might look like
    // {'RootId' : 'some-id', 'ParentId' : '|some-id.1.2.3.', 'message' : 'your message to process'}
    var jsonPayload = JsonConvert.SerializeObject(new MessagePayload
    {
        RootId = operation.Telemetry.Context.Operation.Id,
        ParentId = operation.Telemetry.Id,
        Payload = message
    });

    CloudQueueMessage queueMessage = new CloudQueueMessage(jsonPayload);

    // Add operation.Telemetry.Id to the OperationContext to correlate Storage logs and Application Insights telemetry.
    OperationContext context = new OperationContext { ClientRequestID = operation.Telemetry.Id};

    try
    {
        await queue.AddMessageAsync(queueMessage, null, null, new QueueRequestOptions(), context);
    }
    catch (StorageException e)
    {
        operation.Telemetry.Properties.Add("AzureServiceRequestID", e.RequestInformation.ServiceRequestID);
        operation.Telemetry.Success = false;
        operation.Telemetry.ResultCode = e.RequestInformation.HttpStatusCode.ToString();
        telemetryClient.TrackException(e);
    }
    finally
    {
        // Update status code and success as appropriate.
        telemetryClient.StopOperation(operation);
    }
}
To reduce the amount of telemetry your application reports or if you don't want to track the Enqueue operation for other reasons, use the Activity API directly:
- Create (and start) a new
Activityinstead of starting the Application Insights operation. You don't need to assign any properties on it except the operation name. - Serialize
yourActivity.Idinto the message payload instead ofoperation.Telemetry.Id. You can also useActivity.Current.Id.
Dequeue
Similarly to Enqueue, an actual HTTP request to the Storage queue is automatically tracked by Application Insights. The Enqueue operation presumably happens in the parent context, such as an incoming request context. Application Insights SDKs automatically correlate such an operation, and its HTTP part, with the parent request and other telemetry reported in the same scope.
The Dequeue operation is tricky. The Application Insights SDK automatically tracks HTTP requests. But it doesn't know the correlation context until the message is parsed. It's not possible to correlate the HTTP request to get the message with the rest of the telemetry, especially when more than one message is received.
public async Task<MessagePayload> Dequeue(CloudQueue queue)
{
    var operation = telemetryClient.StartOperation<DependencyTelemetry>("dequeue " + queue.Name);
    operation.Telemetry.Type = "Azure queue";
    operation.Telemetry.Data = "Dequeue " + queue.Name;

    try
    {
        var message = await queue.GetMessageAsync();
    }
    catch (StorageException e)
    {
        operation.telemetry.Properties.Add("AzureServiceRequestID", e.RequestInformation.ServiceRequestID);
        operation.telemetry.Success = false;
        operation.telemetry.ResultCode = e.RequestInformation.HttpStatusCode.ToString();
        telemetryClient.TrackException(e);
    }
    finally
    {
        // Update status code and success as appropriate.
        telemetryClient.StopOperation(operation);
    }

    return null;
}
Process
In the following example, an incoming message is tracked in a manner similar to an incoming HTTP request:
public async Task Process(MessagePayload message)
{
    // After the message is dequeued from the queue, create RequestTelemetry to track its processing.
    RequestTelemetry requestTelemetry = new RequestTelemetry { Name = "process " + queueName };

    // It might also make sense to get the name from the message.
    requestTelemetry.Context.Operation.Id = message.RootId;
    requestTelemetry.Context.Operation.ParentId = message.ParentId;

    var operation = telemetryClient.StartOperation(requestTelemetry);

    try
    {
        await ProcessMessage();
    }
    catch (Exception e)
    {
        telemetryClient.TrackException(e);
        throw;
    }
    finally
    {
        // Update status code and success as appropriate.
        telemetryClient.StopOperation(operation);
    }
}
Similarly, other queue operations can be instrumented. A peek operation should be instrumented in a similar way as a dequeue operation. Instrumenting queue management operations isn't necessary. Application Insights tracks operations such as HTTP, and in most cases, it's enough.
When you instrument message deletion, make sure you set the operation (correlation) identifiers. Alternatively, you can use the Activity API. Then you don't need to set operation identifiers on the telemetry items because Application Insights SDK does it for you:
- Create a new
Activityafter you've got an item from the queue. - Use
Activity.SetParentId(message.ParentId)to correlate consumer and producer logs. - Start the
Activity. - Track dequeue, process, and delete operations by using
Start/StopOperationhelpers. Do it from the same asynchronous control flow (execution context). In this way, they're correlated properly. - Stop the
Activity. - Use
Start/StopOperationor callTracktelemetry manually.
Dependency types
Application Insights uses dependency type to customize UI experiences. For queues, it recognizes the following types of DependencyTelemetry that improve Transaction diagnostics experience:
Azure queuefor Azure Storage queuesAzure Event Hubsfor Azure Event HubsAzure Service Busfor Azure Service Bus
Batch processing
With some queues, you can dequeue multiple messages with one request. Processing such messages is presumably independent and belongs to the different logical operations. It's not possible to correlate the Dequeue operation to a particular message being processed.
Each message should be processed in its own asynchronous control flow. For more information, see the Outgoing dependencies tracking section.
Long-running background tasks
Some applications start long-running operations that might be caused by user requests. From the tracing/instrumentation perspective, it's not different from request or dependency instrumentation:
async Task BackgroundTask()
{
    var operation = telemetryClient.StartOperation<DependencyTelemetry>(taskName);
    operation.Telemetry.Type = "Background";
    try
    {
        int progress = 0;
        while (progress < 100)
        {
            // Process the task.
            telemetryClient.TrackTrace($"done {progress++}%");
        }
        // Update status code and success as appropriate.
    }
    catch (Exception e)
    {
        telemetryClient.TrackException(e);
        // Update status code and success as appropriate.
        throw;
    }
    finally
    {
        telemetryClient.StopOperation(operation);
    }
}
In this example, telemetryClient.StartOperation creates DependencyTelemetry and fills the correlation context. Let's say you have a parent operation that was created by incoming requests that scheduled the operation. As long as BackgroundTask starts in the same asynchronous control flow as an incoming request, it's correlated with that parent operation. BackgroundTask and all nested telemetry items are automatically correlated with the request that caused it, even after the request ends.
When the task starts from the background thread that doesn't have any operation (Activity) associated with it, BackgroundTask doesn't have any parent. However, it can have nested operations. All telemetry items reported from the task are correlated to the DependencyTelemetry created in BackgroundTask.
Outgoing dependencies tracking
You can track your own dependency kind or an operation that's not supported by Application Insights.
The Enqueue method in the Service Bus queue or the Storage queue can serve as examples for such custom tracking.
The general approach for custom dependency tracking is to:
- Call the
TelemetryClient.StartOperation(extension) method that fills theDependencyTelemetryproperties that are needed for correlation and some other properties, like start, time stamp, and duration. - Set other custom properties on the
DependencyTelemetry, such as the name and any other context you need. - Make a dependency call and wait for it.
- Stop the operation with
StopOperationwhen it's finished. - Handle exceptions.
public async Task RunMyTaskAsync()
{
    using (var operation = telemetryClient.StartOperation<DependencyTelemetry>("task 1"))
    {
        try
        {
            var myTask = await StartMyTaskAsync();
            // Update status code and success as appropriate.
        }
        catch(...)
        {
            // Update status code and success as appropriate.
        }
    }
}
Disposing an operation causes the operation to stop, so you might do it instead of calling StopOperation.
Warning
In some cases, an unhanded exception might prevent finally from being called, so operations might not be tracked.
Parallel operations processing and tracking
Calling StopOperation only stops the operation that was started. If the current running operation doesn't match the one you want to stop, StopOperation does nothing. This situation might happen if you start multiple operations in parallel in the same execution context.
var firstOperation = telemetryClient.StartOperation<DependencyTelemetry>("task 1");
var firstTask = RunMyTaskAsync();

var secondOperation = telemetryClient.StartOperation<DependencyTelemetry>("task 2");
var secondTask = RunMyTaskAsync();

await firstTask;

// FAILURE!!! This will do nothing and will not report telemetry for the first operation
// as currently secondOperation is active.
telemetryClient.StopOperation(firstOperation);

await secondTask;
Make sure you always call StartOperation and process the operation in the same async method to isolate operations running in parallel. If the operation is synchronous (or not async), wrap the process and track with Task.Run.
public void RunMyTask(string name)
{
    using (var operation = telemetryClient.StartOperation<DependencyTelemetry>(name))
    {
        Process();
        // Update status code and success as appropriate.
    }
}

public async Task RunAllTasks()
{
    var task1 = Task.Run(() => RunMyTask("task 1"));
    var task2 = Task.Run(() => RunMyTask("task 2"));

    await Task.WhenAll(task1, task2);
}
ApplicationInsights operations vs. System.Diagnostics.Activity
System.Diagnostics.Activity represents the distributed tracing context and is used by frameworks and libraries to create and propagate context inside and outside of the process and correlate telemetry items. Activity works together with System.Diagnostics.DiagnosticSource as the notification mechanism between the framework/library to notify about interesting events like incoming or outgoing requests and exceptions.
Activities are top-level features in Application Insights. Automatic dependency and request collection rely heavily on them along with DiagnosticSource events. If you created Activity in your application, it wouldn't result in Application Insights telemetry being created. Application Insights needs to receive DiagnosticSource events, and know the event names and payloads to translate Activity into telemetry.
Each Application Insights operation (request or dependency) involves Activity. When StartOperation is called, it creates Activity underneath. StartOperation is the recommended way to track request or dependency telemetries manually and ensure everything is correlated.
Counters
Application Insights supports performance counters and event counters. This guide provides an overview of both, including their purpose, configuration, and usage in .NET applications.
Performance counters are built into the Windows operating system and offer predefined metrics like CPU usage, memory consumption, and disk activity. These counters are ideal for monitoring standard performance metrics with minimal setup. They help track resource utilization or troubleshoot system-level bottlenecks in Windows-based applications but don't support custom application-specific metrics.
Event counters work across multiple platforms, including Windows, Linux, and macOS. They allow developers to define and monitor lightweight, customizable application-specific metrics, providing more flexibility than performance counters. Event counters are useful when system metrics are insufficient or when detailed telemetry is needed in cross-platform applications. They require explicit implementation and configuration, which makes setup more effort-intensive.
Performance counters
Windows provides various performance counters, such as those used to gather processor, memory, and disk usage statistics. You can also define your own performance counters.
Your application supports performance counter collection if it runs under Internet Information Server (IIS) on an on-premises host or a virtual machine with administrative access. Applications running as Azure Web Apps can't directly access performance counters, but Application Insights collects a subset of available counters.
Tip
Like other metrics, you can set an alert to warn if a counter goes outside a specified limit. To set an alert, open the Alerts pane and select Add Alert.
Prerequisites
Grant the app pool service account permission to monitor performance counters by adding it to the Performance Monitor Users group.
net localgroup "Performance Monitor Users" /add "IIS APPPOOL\NameOfYourPool"
View counters
The Metrics pane shows the default set of performance counters.
ASP.NET
Default counters for ASP.NET web applications:
- % Process\Processor Time
- % Process\Processor Time Normalized
- Memory\Available Bytes
- ASP.NET Requests/Sec
- .NET Common Language Runtime (CLR) Exceptions Thrown / sec
- ASP.NET ApplicationsRequest Execution Time
- Process\Private Bytes
- Process\IO Data Bytes/sec
- ASP.NET Applications\Requests In Application Queue
- Processor(_Total)\% Processor Time
ASP.NET Core
Default counters for ASP.NET Core web applications:
- % Process\Processor Time
- % Process\Processor Time Normalized
- Memory\Available Bytes
- Process\Private Bytes
- Process\IO Data Bytes/sec
- Processor(_Total)\% Processor Time
Note
Support for performance counters in ASP.NET Core is limited:
- SDK versions 2.4.1 and later collect performance counters if the application is running in Azure Web Apps (Windows).
- SDK versions 2.7.1 and later collect performance counters if the application is running in Windows and targets
NETSTANDARD2.0or later. - For applications that target the .NET Framework, all versions of the SDK support performance counters.
- SDK versions 2.8.0 and later support the CPU/Memory counter in Linux. No other counter is supported in Linux. To get system counters in Linux (and other non-Windows environments), use event counters.
Add counters
If the performance counter you want isn't included in the list of metrics, you can add it.
ASP.NET
Option 1: Configuration in ApplicationInsights.config
Find out what counters are available in your server by using this PowerShell command on the local server:
Get-Counter -ListSet *For more information, see
Get-Counter.Open
ApplicationInsights.config.If you added Application Insights to your app during development:
- Edit
ApplicationInsights.configin your project. - Redeploy it to your servers.
- Edit
Edit the performance collector directive:
    <Add Type="Microsoft.ApplicationInsights.Extensibility.PerfCounterCollector.PerformanceCollectorModule, Microsoft.AI.PerfCounterCollector">
      <Counters>
        <Add PerformanceCounter="\Objects\Processes"/>
        <Add PerformanceCounter="\Sales(photo)\# Items Sold" ReportAs="Photo sales"/>
      </Counters>
    </Add>
You capture both standard counters and counters you implement yourself. \Objects\Processes is an example of a standard counter that's available on all Windows systems. \Sales(photo)\# Items Sold is an example of a custom counter that might be implemented in a web service.
The format is \Category(instance)\Counter, or for categories that don't have instances, just \Category\Counter.
The ReportAs parameter is required for counter names that don't match [a-zA-Z()/-_ \.]+.
If you specify an instance, it becomes a dimension CounterInstanceName of the reported metric.
Option 2: Configuration in code
See the following section.
ASP.NET Core
Configure PerformanceCollectorModule after the WebApplication.CreateBuilder() method in Program.cs:
using Microsoft.ApplicationInsights.Extensibility.PerfCounterCollector;

var builder = WebApplication.CreateBuilder(args);

builder.Services.AddApplicationInsightsTelemetry();

// The following configures PerformanceCollectorModule.

builder.Services.ConfigureTelemetryModule<PerformanceCollectorModule>((module, o) =>
    {
        // The application process name could be "dotnet" for ASP.NET Core self-hosted applications.
        module.Counters.Add(new PerformanceCounterCollectionRequest(@"\Process([replace-with-application-process-name])\Page Faults/sec", "DotnetPageFaultsPerfSec"));
    });

var app = builder.Build();
Collect performance counters in code for ASP.NET web applications or .NET/.NET Core console applications
To collect system performance counters and send them to Application Insights, you can adapt the following snippet:
    var perfCollectorModule = new PerformanceCollectorModule();
    perfCollectorModule.Counters.Add(new PerformanceCounterCollectionRequest(
      @"\Process([replace-with-application-process-name])\Page Faults/sec", "PageFaultsPerfSec"));
    perfCollectorModule.Initialize(TelemetryConfiguration.Active);
Or you can do the same thing with custom metrics that you created:
    var perfCollectorModule = new PerformanceCollectorModule();
    perfCollectorModule.Counters.Add(new PerformanceCounterCollectionRequest(
      @"\Sales(photo)\# Items Sold", "Photo sales"));
    perfCollectorModule.Initialize(TelemetryConfiguration.Active);
Performance counters for applications running in Azure Web Apps and Windows containers on Azure App Service
Both ASP.NET and ASP.NET Core applications deployed to Azure Web Apps run in a special sandbox environment. Applications deployed to Azure App Service can utilize a Windows container or be hosted in a sandbox environment. If the application is deployed in a Windows container, all standard performance counters are available in the container image.
The sandbox environment doesn't allow direct access to system performance counters. However, a limited subset of counters is exposed as environment variables as described in Perf Counters exposed as environment variables. Only a subset of counters is available in this environment.
The Application Insights SDK for ASP.NET and ASP.NET Core detects if code is deployed to a web app or a non-Windows container. The detection determines whether it collects performance counters in a sandbox environment or utilizes the standard collection mechanism when hosted on a Windows container or virtual machine.
Log Analytics queries for performance counters
You can search and display performance counter reports in Log Analytics.
The performanceCounters schema exposes the category, counter name, and instance name of each performance counter. In the telemetry for each application, you see only the counters for that application. For example, to see what counters are available:
performanceCounters | summarize count(), avg(value) by category, instance, counter
Here, Instance refers to the performance counter instance, not the role, or server machine instance. The performance counter instance name typically segments counters, such as processor time, by the name of the process or application.
To get a chart of available memory over the recent period:
performanceCounters | where counter == "Available Bytes" | summarize avg(value), min(value) by bin(timestamp, 1h) | render timechart
Like other telemetry, performanceCounters also has a column cloud_RoleInstance that indicates the identity of the host server instance on which your app is running. For example, to compare the performance of your app on the different machines:
performanceCounters | where counter == "% Processor Time" and instance == "SendMetrics" | summarize avg(value) by cloud_RoleInstance, bin(timestamp, 1d)
Performance counters FAQ
To review frequently asked questions (FAQ), see Performance counters FAQ.
Event counters
EventCounter is .NET/.NET Core mechanism to publish and consume counters or statistics. EventCounters are supported in all OS platforms - Windows, Linux, and macOS. It can be thought of as a cross-platform equivalent for the PerformanceCounters that's only supported in Windows systems.
While users can publish any custom event counters to meet their needs, .NET publishes a set of these counters by default. This document walks through the steps required to collect and view event counters (system defined or user defined) in Azure Application Insights.
Tip
Like other metrics, you can set an alert to warn if a counter goes outside a specified limit. To set an alert, open the Alerts pane and select Add Alert.
Using Application Insights to collect EventCounters
Application Insights supports collecting EventCounters with its EventCounterCollectionModule, which is part of the newly released NuGet package Microsoft.ApplicationInsights.EventCounterCollector. EventCounterCollectionModule is automatically enabled when using either AspNetCore or WorkerService. EventCounterCollectionModule collects counters with a nonconfigurable collection frequency of 60 seconds. There are no special permissions required to collect EventCounters. For ASP.NET Core applications, you also want to add the Microsoft.ApplicationInsights.AspNetCore package.
dotnet add package Microsoft.ApplicationInsights.EventCounterCollector
dotnet add package Microsoft.ApplicationInsights.AspNetCore
Default counters collected
Starting with 2.15.0 version of either AspNetCore SDK or WorkerService SDK, no counters are collected by default. The module itself is enabled, so users can add the desired counters to collect them.
To get a list of well known counters published by the .NET Runtime, see Available Counters document.
Customizing counters to be collected
The following example shows how to add/remove counters. This customization would be done as part of your application service configuration after Application Insights telemetry collection is enabled using either AddApplicationInsightsTelemetry() or AddApplicationInsightsWorkerService(). Following is an example code from an ASP.NET Core application. For other type of applications, refer to configure telemetry modules.
using Microsoft.ApplicationInsights.Extensibility.EventCounterCollector;
using Microsoft.Extensions.DependencyInjection;

builder.Services.ConfigureTelemetryModule<EventCounterCollectionModule>(
        (module, o) =>
        {
            // Removes all default counters, if any.
            module.Counters.Clear();

            // Adds a user defined counter "MyCounter" from EventSource named "MyEventSource"
            module.Counters.Add(
                new EventCounterCollectionRequest("MyEventSource", "MyCounter"));

            // Adds the system counter "gen-0-size" from "System.Runtime"
            module.Counters.Add(
                new EventCounterCollectionRequest("System.Runtime", "gen-0-size"));
        }
    );
Disabling EventCounter collection module
EventCounterCollectionModule can be disabled by using ApplicationInsightsServiceOptions.
The following example uses the ASP.NET Core SDK.
using Microsoft.ApplicationInsights.AspNetCore.Extensions;
using Microsoft.Extensions.DependencyInjection;

var applicationInsightsServiceOptions = new ApplicationInsightsServiceOptions();
applicationInsightsServiceOptions.EnableEventCounterCollectionModule = false;
builder.Services.AddApplicationInsightsTelemetry(applicationInsightsServiceOptions);
A similar approach can be used for the Worker Service SDK as well, but the namespace must be changed as shown in the following example.
using Microsoft.ApplicationInsights.AspNetCore.Extensions;
using Microsoft.Extensions.DependencyInjection;

var applicationInsightsServiceOptions = new ApplicationInsightsServiceOptions();
applicationInsightsServiceOptions.EnableEventCounterCollectionModule = false;
builder.Services.AddApplicationInsightsTelemetry(applicationInsightsServiceOptions);
Log Analytics queries for event counters
You can search and display event counter reports in Log Analytics, in the customMetrics table.
For example, run the following query to see what counters are collected and available to query:
customMetrics | summarize avg(value) by name
To get a chart of a specific counter (for example: ThreadPool Completed Work Item Count) over the recent period, run the following query.
customMetrics
| where name contains "System.Runtime|ThreadPool Completed Work Item Count"
| where timestamp >= ago(1h)
| summarize avg(value) by cloud_RoleInstance, bin(timestamp, 1m)
| render timechart
Like other telemetry, customMetrics also has a column cloud_RoleInstance that indicates the identity of the host server instance on which your app is running. The prior query shows the counter value per instance, and can be used to compare performance of different server instances.
Event counters FAQ
To review frequently asked questions (FAQ), see Event counters FAQ.
Snapshot collection
To learn how to configure snapshot collection for ASP.NET and ASP.NET Core applications, see Enable Snapshot Debugger for .NET apps in Azure Service Fabric, Cloud Services, and Virtual Machines.
Processing and filtering telemetry
In this section
- Filter and preprocess telemetry
- Telemetry initializers
- Telemetry processor
- Sampling
- Enrich data through HTTP
Filter and preprocess telemetry
You can write code to filter, modify, or enrich your telemetry before it's sent from the SDK. The processing includes data that's sent from the standard telemetry modules, such as HTTP request collection and dependency collection.
Filtering can modify or discard telemetry before it's sent from the SDK by implementing
ITelemetryProcessor. For example, you could reduce the volume of telemetry by excluding requests from robots. Unlike sampling, You have full control over what is sent or discarded, but it affects any metrics based on aggregated logs. Depending on how you discard items, you might also lose the ability to navigate between related items.Add or Modify properties to any telemetry sent from your app by implementing an
ITelemetryInitializer. For example, you could add calculated values or version numbers by which to filter the data in the portal.Sampling reduces the volume of telemetry without affecting your statistics. It keeps together related data points so that you can navigate between them when you diagnose a problem. In the portal, the total counts are multiplied to compensate for the sampling.
Note
The SDK API is used to send custom events and metrics.
Filtering
This technique gives you direct control over what's included or excluded from the telemetry stream. Filtering can be used to drop telemetry items from being sent to Application Insights. You can use filtering with sampling, or separately.
To filter telemetry, you write a telemetry processor and register it with TelemetryConfiguration. All telemetry goes through your processor. You can choose to drop it from the stream or give it to the next processor in the chain. Telemetry from the standard modules, such as the HTTP request collector and the dependency collector, and telemetry you tracked yourself is included. For example, you can filter out telemetry about requests from robots or successful dependency calls.
Warning
Filtering the telemetry sent from the SDK by using processors can skew the statistics that you see in the portal and make it difficult to follow related items.
Instead, consider using sampling.
ITelemetryProcessor and ITelemetryInitializer
What's the difference between telemetry processors and telemetry initializers?
- There are some overlaps in what you can do with them. Both can be used to add or modify properties of telemetry, although we recommend that you use initializers for that purpose.
- Telemetry initializers always run before telemetry processors.
- Telemetry initializers may be called more than once. By convention, they don't set any property that was already set.
- Telemetry processors allow you to completely replace or discard a telemetry item.
- All registered telemetry initializers are called for every telemetry item. For telemetry processors, SDK guarantees calling the first telemetry processor. Whether the rest of the processors are called or not is decided by the preceding telemetry processors.
- Use telemetry initializers to enrich telemetry with more properties or override an existing one. Use a telemetry processor to filter out telemetry.
Add/modify properties
Use telemetry initializers to enrich telemetry with additional information or to override telemetry properties set by the standard telemetry modules.
For example, Application Insights for a web package collects telemetry about HTTP requests. By default, it flags any request with a response code >=400 as failed. If instead you want to treat 400 as a success, you can provide a telemetry initializer that sets the success property.
If you provide a telemetry initializer, it's called whenever any of the Track*() methods are called. This initializer includes Track() methods called by the standard telemetry modules. By convention, these modules don't set any property that was already set by an initializer. Telemetry initializers are called before calling telemetry processors, so any enrichments done by initializers are visible to processors.
Telemetry initializers
To enrich telemetry with additional information or to override telemetry properties set by the standard telemetry modules, use telemetry initializers.
Telemetry initializers set context properties that are sent along with every item of telemetry. You can write your own initializers to set context properties.
The standard initializers are all set either by the web or WindowsServer NuGet packages:
| Initializer | Description |
|---|---|
AccountIdTelemetryInitializer |
Sets the AccountId property. |
AuthenticatedUserIdTelemetryInitializer |
Sets the AuthenticatedUserId property as set by the JavaScript SDK. |
AzureRoleEnvironmentTelemetryInitializer |
Updates the RoleName and RoleInstance properties of the Device context for all telemetry items with information extracted from the Azure runtime environment. |
BuildInfoConfigComponentVersionTelemetryInitializer |
Updates the Version property of the Component context for all telemetry items with the value extracted from the BuildInfo.config file produced by MS Build. |
ClientIpHeaderTelemetryInitializer |
Updates the Ip property of the Location context of all telemetry items based on the X-Forwarded-For HTTP header of the request. |
DeviceTelemetryInitializer |
Updates the following properties of the Device context for all telemetry items:• Type is set to PC.• Id is set to the domain name of the computer where the web application is running.• OemName is set to the value extracted from the Win32_ComputerSystem.Manufacturer field by using WMI.• Model is set to the value extracted from the Win32_ComputerSystem.Model field by using WMI.• NetworkType is set to the value extracted from the NetworkInterface property.• Language is set to the name of the CurrentCulture property. |
DomainNameRoleInstanceTelemetryInitializer |
Updates the RoleInstance property of the Device context for all telemetry items with the domain name of the computer where the web application is running. |
OperationNameTelemetryInitializer |
Updates the Name property of RequestTelemetry and the Name property of the Operation context of all telemetry items based on the HTTP method, and the names of the ASP.NET MVC controller and action invoked to process the request. |
OperationIdTelemetryInitializer or OperationCorrelationTelemetryInitializer |
Updates the Operation.Id context property of all telemetry items tracked while handling a request with the automatically generated RequestTelemetry.Id. |
SessionTelemetryInitializer |
Updates the Id property of the Session context for all telemetry items with value extracted from the ai_session cookie generated by the ApplicationInsights JavaScript instrumentation code running in the user's browser. |
SyntheticTelemetryInitializer or SyntheticUserAgentTelemetryInitializer |
Updates the User, Session, and Operation context properties of all telemetry items tracked when handling a request from a synthetic source, such as an availability test or search engine bot. By default, metrics explorer doesn't display synthetic telemetry.The <Filters> set identifying properties of the requests. |
UserTelemetryInitializer |
Updates the Id and AcquisitionDate properties of the User context for all telemetry items with values extracted from the ai_user cookie generated by the Application Insights JavaScript instrumentation code running in the user's browser. |
WebTestTelemetryInitializer |
Sets the user ID, session ID, and synthetic source properties for HTTP requests that come from availability tests. The <Filters> set identifying properties of the requests. |
Note
For .NET applications running in Azure Service Fabric, you can include the Microsoft.ApplicationInsights.ServiceFabric NuGet package. This package includes a FabricTelemetryInitializer property, which adds Service Fabric properties to telemetry items. For more information, see the GitHub page about the properties added by this NuGet package.
Add ITelemetryInitializer
This blog describes a project to diagnose dependency issues by automatically sending regular pings to dependencies.
Define your initializer
using System;
using Microsoft.ApplicationInsights.Channel;
using Microsoft.ApplicationInsights.DataContracts;
using Microsoft.ApplicationInsights.Extensibility;

namespace MvcWebRole.Telemetry
{
  /*
   * Custom TelemetryInitializer that overrides the default SDK
   * behavior of treating response codes >= 400 as failed requests
   *
   */
    public class MyTelemetryInitializer : ITelemetryInitializer
    {
        public void Initialize(ITelemetry telemetry)
        {
            var requestTelemetry = telemetry as RequestTelemetry;
            // Is this a TrackRequest() ?
            if (requestTelemetry == null) return;
            int code;
            bool parsed = Int32.TryParse(requestTelemetry.ResponseCode, out code);
            if (!parsed) return;
            if (code >= 400 && code < 500)
            {
                // If we set the Success property, the SDK won't change it:
                requestTelemetry.Success = true;

                // Allow us to filter these requests in the portal:
                requestTelemetry.Properties["Overridden400s"] = "true";
            }
            // else leave the SDK to set the Success property
        }
    }
}
Load your initializer
ASP.NET
Option 1: Configuration in code
protected void Application_Start()
{
    // ...
    TelemetryConfiguration.Active.TelemetryInitializers.Add(new MyTelemetryInitializer());
}
Option 2: Configuration in ApplicationInsights.config
<ApplicationInsights>
    <TelemetryInitializers>
    <!-- Fully qualified type name, assembly name: -->
    <Add Type="MvcWebRole.Telemetry.MyTelemetryInitializer, MvcWebRole"/>
    ...
    </TelemetryInitializers>
</ApplicationInsights>
See more of this sample.
Note
Make sure the applicationinsights.config file is in your output directory and contains any recent changes.
ASP.NET Core
Adding an initializer by using
ApplicationInsights.configorTelemetryConfiguration.Activeisn't valid for ASP.NET Core applications.
For apps written using ASP.NET Core, adding a new telemetry initializer is done by adding it to the DependencyInjection container, as shown. Accomplish this step in the Startup.ConfigureServices method.
var builder = WebApplication.CreateBuilder(args);

builder.Services.AddSingleton<ITelemetryInitializer, MyCustomTelemetryInitializer>();

var app = builder.Build();
Note
builder.Services.AddSingleton<ITelemetryInitializer, MyCustomTelemetryInitializer>(); works for simple initializers. For others, builder.Services.AddSingleton(new MyCustomTelemetryInitializer() { fieldName = "myfieldName" }); is required.
Remove telemetry initializers
By default, telemetry initializers are present. To remove all or specific telemetry initializers, use the following sample code after calling AddApplicationInsightsTelemetry().
var builder = WebApplication.CreateBuilder(args);

builder.Services.AddApplicationInsightsTelemetry();

// Remove a specific built-in telemetry initializer
var tiToRemove = builder.Services.FirstOrDefault<ServiceDescriptor>
                    (t => t.ImplementationType == typeof(AspNetCoreEnvironmentTelemetryInitializer));
if (tiToRemove != null)
{
    builder.Services.Remove(tiToRemove);
}

// Remove all initializers
// This requires importing namespace by using Microsoft.Extensions.DependencyInjection.Extensions;
builder.Services.RemoveAll(typeof(ITelemetryInitializer));

var app = builder.Build();
Worker Service
Adding an initializer by using
ApplicationInsights.configorTelemetryConfiguration.Activeisn't valid for Worker Service SDK.
For apps written using Worker Service, adding a new telemetry initializer is done by adding it to the DependencyInjection container, as shown. Accomplish this step in the Startup.ConfigureServices method.
    using Microsoft.ApplicationInsights.Extensibility;

    public void ConfigureServices(IServiceCollection services)
    {
        services.AddSingleton<ITelemetryInitializer, MyCustomTelemetryInitializer>();
        services.AddApplicationInsightsTelemetryWorkerService();
    }
Remove telemetry initializers
Telemetry initializers are present by default. To remove all or specific telemetry initializers, use the following sample code after calling AddApplicationInsightsTelemetryWorkerService().
   public void ConfigureServices(IServiceCollection services)
   {
        services.AddApplicationInsightsTelemetryWorkerService();
        // Remove a specific built-in telemetry initializer.
        var tiToRemove = services.FirstOrDefault<ServiceDescriptor>
                            (t => t.ImplementationType == typeof(AspNetCoreEnvironmentTelemetryInitializer));
        if (tiToRemove != null)
        {
            services.Remove(tiToRemove);
        }

        // Remove all initializers.
        // This requires importing namespace by using Microsoft.Extensions.DependencyInjection.Extensions;
        services.RemoveAll(typeof(ITelemetryInitializer));
   }
Example ITelemetryInitializers
Add a custom property
The following sample initializer adds a custom property to every tracked telemetry.
public void Initialize(ITelemetry item)
{
    var itemProperties = item as ISupportProperties;
    if(itemProperties != null && !itemProperties.Properties.ContainsKey("customProp"))
    {
        itemProperties.Properties["customProp"] = "customValue";
    }
}
Add a cloud role name and cloud role instance
Step 1: Write custom TelemetryInitializer
The following sample initializer sets the cloud role name to every tracked telemetry.
using Microsoft.ApplicationInsights.Channel;
using Microsoft.ApplicationInsights.Extensibility;

namespace CustomInitializer.Telemetry
{
    public class MyTelemetryInitializer : ITelemetryInitializer
    {
        public void Initialize(ITelemetry telemetry)
        {
            if (string.IsNullOrEmpty(telemetry.Context.Cloud.RoleName))
            {
                //set custom role name here
                telemetry.Context.Cloud.RoleName = "Custom RoleName";
                telemetry.Context.Cloud.RoleInstance = "Custom RoleInstance";
            }
        }
    }
}
Step 2: Load an initializer to TelemetryConfiguration
ASP.NET
In the ApplicationInsights.config file:
    <ApplicationInsights>
      <TelemetryInitializers>
        <!-- Fully qualified type name, assembly name: -->
        <Add Type="CustomInitializer.Telemetry.MyTelemetryInitializer, CustomInitializer"/>
        ...
      </TelemetryInitializers>
    </ApplicationInsights>
An alternate method for ASP.NET Web apps is to instantiate the initializer in code. The following example shows code in the Global.aspx.cs file:
 using Microsoft.ApplicationInsights.Extensibility;
 using CustomInitializer.Telemetry;

    protected void Application_Start()
    {
        // ...
        TelemetryConfiguration.Active.TelemetryInitializers.Add(new MyTelemetryInitializer());
    }
ASP.NET Core
To add a new TelemetryInitializer instance, you add it to the Dependency Injection container. The following example shows this approach. Add this code in the ConfigureServices method of your Startup.cs class.
 using Microsoft.ApplicationInsights.Extensibility;
 using CustomInitializer.Telemetry;
 public void ConfigureServices(IServiceCollection services)
{
    services.AddSingleton<ITelemetryInitializer, MyTelemetryInitializer>();
}
Control the client IP address used for geolocation mappings
The following sample initializer sets the client IP, which is used for geolocation mapping, instead of the client socket IP address, during telemetry ingestion.
public void Initialize(ITelemetry telemetry)
{
    var request = telemetry as RequestTelemetry;
    if (request == null) return true;
    request.Context.Location.Ip = "{client ip address}"; // Could utilize System.Web.HttpContext.Current.Request.UserHostAddress;
    return true;
}
Telemetry processors
Telemetry processors can filter and modify each telemetry item before it's sent from the SDK to the portal.
Implement ITelemetryProcessor
Telemetry processors construct a chain of processing. When you instantiate a telemetry processor, you get a reference to the next processor in the chain. When a telemetry data point is passed to the process method, it does its work and then calls (or doesn't call) the next telemetry processor in the chain.
using Microsoft.ApplicationInsights.Channel;
using Microsoft.ApplicationInsights.Extensibility;
using Microsoft.ApplicationInsights.DataContracts;

public class SuccessfulDependencyFilter : ITelemetryProcessor
{
    private ITelemetryProcessor Next { get; set; }

    // next will point to the next TelemetryProcessor in the chain.
    public SuccessfulDependencyFilter(ITelemetryProcessor next)
    {
        this.Next = next;
    }

    public void Process(ITelemetry item)
    {
        // To filter out an item, return without calling the next processor.
        if (!OKtoSend(item)) { return; }

        this.Next.Process(item);
    }

    // Example: replace with your own criteria.
    private bool OKtoSend (ITelemetry item)
    {
        var dependency = item as DependencyTelemetry;
        if (dependency == null) return true;

        return dependency.Success != true;
    }
}
Add your processor
ASP.NET
Insert this snippet in ApplicationInsights.config:
<TelemetryProcessors>
    <Add Type="WebApplication9.SuccessfulDependencyFilter, WebApplication9">
    <!-- Set public property -->
    <MyParamFromConfigFile>2-beta</MyParamFromConfigFile>
    </Add>
</TelemetryProcessors>
You can pass string values from the .config file by providing public named properties in your class.
Warning
Take care to match the type name and any property names in the .config file to the class and property names in the code. If the .config file references a nonexistent type or property, the SDK may silently fail to send any telemetry.
Alternatively, you can initialize the filter in code. In a suitable initialization class, for example, AppStart in Global.asax.cs, insert your processor into the chain:
Note
The following code sample is obsolete, but is made available here for posterity. Consider getting started with OpenTelemetry or migrating to OpenTelemetry.
var builder = TelemetryConfiguration.Active.DefaultTelemetrySink.TelemetryProcessorChainBuilder;
builder.Use((next) => new SuccessfulDependencyFilter(next));

// If you have more processors:
builder.Use((next) => new AnotherProcessor(next));

builder.Build();
Telemetry clients created after this point use your processors.
Adaptive sampling telemetry processor (from 2.0.0-beta3)
This functionality is enabled by default. If your app sends considerable telemetry, this processor removes some of it.
    <TelemetryProcessors>
        <Add Type="Microsoft.ApplicationInsights.WindowsServer.TelemetryChannel.AdaptiveSamplingTelemetryProcessor, Microsoft.AI.ServerTelemetryChannel">
        <MaxTelemetryItemsPerSecond>5</MaxTelemetryItemsPerSecond>
        </Add>
    </TelemetryProcessors>
The parameter provides the target that the algorithm tries to achieve. Each instance of the SDK works independently. So, if your server is a cluster of several machines, the actual volume of telemetry is multiplied accordingly.
Learn more about sampling.
Fixed-rate sampling telemetry processor (from 2.0.0-beta1)
There's also a standard sampling telemetry processor (from 2.0.1):
    <TelemetryProcessors>
        <Add Type="Microsoft.ApplicationInsights.WindowsServer.TelemetryChannel.SamplingTelemetryProcessor, Microsoft.AI.ServerTelemetryChannel">

        <!-- Set a percentage close to 100/N where N is an integer. -->
        <!-- E.g. 50 (=100/2), 33.33 (=100/3), 25 (=100/4), 20, 1 (=100/100), 0.1 (=100/1000) -->
        <SamplingPercentage>10</SamplingPercentage>
        </Add>
    </TelemetryProcessors>
ASP.NET Core
Note
Adding a processor by using ApplicationInsights.config or TelemetryConfiguration.Active isn't valid for ASP.NET Core applications or if you're using the Microsoft.ApplicationInsights.WorkerService SDK.
For ASP.NET Core, adding a new telemetry processor is done by using the AddApplicationInsightsTelemetryProcessor extension method on IServiceCollection, as shown. This method is called in the ConfigureServices method of your Startup.cs class.
var builder = WebApplication.CreateBuilder(args);

// ...
builder.Services.AddApplicationInsightsTelemetry();
builder.Services.AddApplicationInsightsTelemetryProcessor<MyFirstCustomTelemetryProcessor>();

// If you have more processors:
builder.Services.AddApplicationInsightsTelemetryProcessor<MySecondCustomTelemetryProcessor>();

var app = builder.Build();
To register telemetry processors that need parameters in ASP.NET Core, create a custom class implementing ITelemetryProcessorFactory. Call the constructor with the desired parameters in the Create method and then use AddSingleton<ITelemetryProcessorFactory, MyTelemetryProcessorFactory>().
Worker Service
Note
Adding a processor by using ApplicationInsights.config or TelemetryConfiguration.Active isn't valid for ASP.NET Core applications or if you're using the Microsoft.ApplicationInsights.WorkerService SDK.
For Worker Service, adding a new telemetry processor is done by using the AddApplicationInsightsTelemetryProcessor extension method on IServiceCollection, as shown. This method is called in the ConfigureServices method of your Startup.cs class.
    public void ConfigureServices(IServiceCollection services)
    {
        services.AddApplicationInsightsTelemetryWorkerService();
        services.AddApplicationInsightsTelemetryProcessor<MyFirstCustomTelemetryProcessor>();
        // If you have more processors:
        services.AddApplicationInsightsTelemetryProcessor<MySecondCustomTelemetryProcessor>();
    }
Example filters
Synthetic requests
Filter out bots and web tests. Although Metrics Explorer gives you the option to filter out synthetic sources, this option reduces traffic and ingestion size by filtering them at the SDK itself.
public void Process(ITelemetry item)
{
    if (!string.IsNullOrEmpty(item.Context.Operation.SyntheticSource)) {return;}

    // Send everything else:
    this.Next.Process(item);
}
Failed authentication
Filter out requests with a "401" response.
public void Process(ITelemetry item)
{
    var request = item as RequestTelemetry;

    if (request != null &&
    request.ResponseCode.Equals("401", StringComparison.OrdinalIgnoreCase))
    {
        // To filter out an item, return without calling the next processor.
        return;
    }

    // Send everything else
    this.Next.Process(item);
}
Filter out fast remote dependency calls
If you want to diagnose only calls that are slow, filter out the fast ones.
Note
This filtering skews the statistics you see on the portal.
public void Process(ITelemetry item)
{
    var request = item as DependencyTelemetry;

    if (request != null && request.Duration.TotalMilliseconds < 100)
    {
        return;
    }
    this.Next.Process(item);
}
Sampling
To learn how to configure sampling for ASP.NET and ASP.NET Core applications, see Sampling in Application Insights.
Worker Service
The Application Insights SDK for Worker Service supports both fixed-rate sampling and adaptive sampling. Adaptive sampling is enabled by default. Sampling can be disabled by using the EnableAdaptiveSampling option in ApplicationInsightsServiceOptions.
To configure other sampling settings, you can use the following example:
using Microsoft.ApplicationInsights.AspNetCore.Extensions;
using Microsoft.ApplicationInsights.Extensibility;

var builder = WebApplication.CreateBuilder(args);

builder.Services.Configure<TelemetryConfiguration>(telemetryConfiguration =>
{
   var telemetryProcessorChainBuilder = telemetryConfiguration.DefaultTelemetrySink.TelemetryProcessorChainBuilder;

   // Using adaptive sampling
   telemetryProcessorChainBuilder.UseAdaptiveSampling(maxTelemetryItemsPerSecond: 5);

   // Alternately, the following configures adaptive sampling with 5 items per second, and also excludes DependencyTelemetry from being subject to sampling:
   // telemetryProcessorChainBuilder.UseAdaptiveSampling(maxTelemetryItemsPerSecond:5, excludedTypes: "Dependency");
});

builder.Services.AddApplicationInsightsTelemetryWorkerService(new ApplicationInsightsServiceOptions
{
   EnableAdaptiveSampling = false,
});

var app = builder.Build();
Enrich data through HTTP
ASP.NET
var requestTelemetry = HttpContext.Current?.Items["Microsoft.ApplicationInsights.RequestTelemetry"] as RequestTelemetry;

if (requestTelemetry != null)
{
    requestTelemetry.Properties["myProp"] = "someData";
}
ASP.NET Core
HttpContext.Features.Get<RequestTelemetry>().Properties["myProp"] = someData
SDK configuration
In this section
You can customize the Application Insights SDK for ASP.NET, ASP.NET Core, and Worker Service to change the default configuration.
ASP.NET
The Application Insights .NET SDK consists of many NuGet packages. The core package provides the API for sending telemetry to the Application Insights. More packages provide telemetry modules and initializers for automatically tracking telemetry from your application and its context. By adjusting the configuration file, you can enable or disable telemetry modules and initializers. You can also set parameters for some of them.
The configuration file is named ApplicationInsights.config or ApplicationInsights.xml. The name depends on the type of your application. It's automatically added to your project when you install most versions of the SDK.
By default, when you use the automated experience from the Visual Studio template projects that support Add > Application Insights Telemetry, the ApplicationInsights.config file is created in the project root folder. After compiling, it gets copied to the bin folder. It's also added to a web app by Application Insights Agent on an IIS server.
Important
The configuration file is ignored if the extension for Azure websites or the extension for Azure VMs and Azure virtual machine scale sets is used.
There isn't an equivalent file to control the SDK in a webpage.
ASP.NET Core
In ASP.NET Core applications, all configuration changes are made in the ConfigureServices() method of your Startup.cs class, unless otherwise directed.
Note
In ASP.NET Core applications, changing configuration by modifying TelemetryConfiguration.Active isn't supported.
Worker Service
The default TelemetryConfiguration used by the Worker Service SDK is similar to the automatic configuration used in an ASP.NET or ASP.NET Core application, minus the telemetry initializers used to enrich telemetry from HttpContext.
You can customize the Application Insights SDK for Worker Service to change the default configuration. Users of the Application Insights ASP.NET Core SDK might be familiar with changing configuration by using ASP.NET Core built-in dependency injection. The Worker Service SDK is also based on similar principles. Make almost all configuration changes in the ConfigureServices() section by calling appropriate methods on IServiceCollection, as detailed in the next section.
Note
When you use the Worker Service SDK, changing configuration by modifying TelemetryConfiguration.Active isn't supported and changes won't be reflected.
Telemetry channels
Telemetry channels are an integral part of the Application Insights SDKs. They manage buffering and transmission of telemetry to the Application Insights service. The .NET and .NET Core versions of the SDKs have two built-in telemetry channels: InMemoryChannel and ServerTelemetryChannel. This section describes each channel and shows how to customize channel behavior.
Note
To review frequently asked questions (FAQ), see Telemetry channels FAQ
What are telemetry channels?
Telemetry channels are responsible for buffering telemetry items and sending them to the Application Insights service, where they're stored for querying and analysis. A telemetry channel is any class that implements the Microsoft.ApplicationInsights.ITelemetryChannel interface.
The Send(ITelemetry item) method of a telemetry channel is called after all telemetry initializers and telemetry processors are called. So, any items dropped by a telemetry processor doesn't reach the channel. The Send() method doesn't ordinarily send the items to the back end instantly. Typically, it buffers them in memory and sends them in batches for efficient transmission.
Avoid calling Flush() unless it's critical to send buffered telemetry immediately. Use it only in scenarios like application shutdown, exception handling, or when using short-lived processes such as background jobs or command-line tools. In web applications or long-running services, the SDK handles telemetry sending automatically. Calling Flush() unnecessarily can cause performance problems.
Live Metrics Stream also has a custom channel that powers the live streaming of telemetry. This channel is independent of the regular telemetry channel, and this document doesn't apply to it.
Built-in telemetry channels
The Application Insights .NET and .NET Core SDKs ship with two built-in channels:
InMemoryChannel: A lightweight channel that buffers items in memory until they're sent. Items are buffered in memory and flushed once every 30 seconds, or whenever 500 items are buffered. This channel offers minimal reliability guarantees because it doesn't retry sending telemetry after a failure. This channel also doesn't keep items on disk. So any unsent items are lost permanently upon application shutdown, whether it's graceful or not. This channel implements a
Flush()method that can be used to force-flush any in-memory telemetry items synchronously. This channel is well suited for short-running applications where a synchronous flush is ideal.This channel is part of the larger Microsoft.ApplicationInsights NuGet package and is the default channel that the SDK uses when nothing else is configured.
ServerTelemetryChannel: A more advanced channel that has retry policies and the capability to store data on a local disk. This channel retries sending telemetry if transient errors occur. This channel also uses local disk storage to keep items on disk during network outages or high telemetry volumes. Because of these retry mechanisms and local disk storage, this channel is considered more reliable. We recommend it for all production scenarios. This channel is the default for ASP.NET and ASP.NET Core applications that are configured according to the official documentation. This channel is optimized for server scenarios with long-running processes. The
Flush()method that's implemented by this channel isn't synchronous.This channel is shipped as the Microsoft.ApplicationInsights.WindowsServer.TelemetryChannel NuGet package and is acquired automatically when you use either the Microsoft.ApplicationInsights.Web or Microsoft.ApplicationInsights.AspNetCore NuGet package.
Configure a telemetry channel
You configure a telemetry channel by setting it to the active telemetry configuration. For ASP.NET applications, configuration involves setting the telemetry channel instance to TelemetryConfiguration.Active or by modifying ApplicationInsights.config. For ASP.NET Core applications, configuration involves adding the channel to the dependency injection container.
The following sections show examples of configuring the StorageFolder setting for the channel in various application types. StorageFolder is just one of the configurable settings. For the full list of configuration settings, see the Configurable settings in channels section later in this article.
ASP.NET
Option 1: Configuration in code
The following code sets up a ServerTelemetryChannel instance with StorageFolder set to a custom location. Add this code at the beginning of the application, typically in the Application_Start() method in Global.aspx.cs.
using Microsoft.ApplicationInsights.Extensibility;
using Microsoft.ApplicationInsights.WindowsServer.TelemetryChannel;
protected void Application_Start()
{
    var serverTelemetryChannel = new ServerTelemetryChannel();
serverTelemetryChannel.StorageFolder = @"d:\temp\applicationinsights";
    serverTelemetryChannel.Initialize(TelemetryConfiguration.Active);
    TelemetryConfiguration.Active.TelemetryChannel = serverTelemetryChannel;
}
Option 2: Configuration in ApplicationInsights.config
The following section from ApplicationInsights.config shows the ServerTelemetryChannel channel configured with StorageFolder set to a custom location:
    <TelemetrySinks>
        <Add Name="default">
            <TelemetryProcessors>
                <!-- Telemetry processors omitted for brevity -->
            </TelemetryProcessors>
            <TelemetryChannel Type="Microsoft.ApplicationInsights.WindowsServer.TelemetryChannel.ServerTelemetryChannel, Microsoft.AI.ServerTelemetryChannel">
                <StorageFolder>d:\temp\applicationinsights</StorageFolder>
            </TelemetryChannel>
        </Add>
    </TelemetrySinks>
ASP.NET Core
Modify the ConfigureServices method of the Startup.cs class as shown here:
using Microsoft.ApplicationInsights.Channel;
using Microsoft.ApplicationInsights.WindowsServer.TelemetryChannel;

public void ConfigureServices(IServiceCollection services)
{
    // This sets up ServerTelemetryChannel with StorageFolder set to a custom location.
    services.AddSingleton(typeof(ITelemetryChannel), new ServerTelemetryChannel() {StorageFolder = @"d:\temp\applicationinsights" });

    services.AddApplicationInsightsTelemetry();
}
Important
Configuring the channel by using TelemetryConfiguration.Active isn't supported for ASP.NET Core applications.
Overriding ServerTelemetryChannel
The default telemetry channel is ServerTelemetryChannel. The following example shows how to override it.
using Microsoft.ApplicationInsights.Channel;

var builder = WebApplication.CreateBuilder(args);

// Use the following to replace the default channel with InMemoryChannel.
// This can also be applied to ServerTelemetryChannel.
builder.Services.AddSingleton(typeof(ITelemetryChannel), new InMemoryChannel() {MaxTelemetryBufferCapacity = 19898 });

builder.Services.AddApplicationInsightsTelemetry();

var app = builder.Build();
Note
If you want to flush the buffer, see Flushing data. For example, you might need to flush the buffer if you're using the SDK in an application that shuts down.
Worker Service
The default channel is ServerTelemetryChannel. You can override it as the following example shows:
using Microsoft.ApplicationInsights.Channel;

    public void ConfigureServices(IServiceCollection services)
    {
        // Use the following to replace the default channel with InMemoryChannel.
        // This can also be applied to ServerTelemetryChannel.
        services.AddSingleton(typeof(ITelemetryChannel), new InMemoryChannel() {MaxTelemetryBufferCapacity = 19898 });

        services.AddApplicationInsightsTelemetryWorkerService();
    }
Configuration in code for console applications
For console apps, the code is the same for both .NET and .NET Core:
var serverTelemetryChannel = new ServerTelemetryChannel();
serverTelemetryChannel.StorageFolder = @"d:\temp\applicationinsights";
serverTelemetryChannel.Initialize(TelemetryConfiguration.Active);
TelemetryConfiguration.Active.TelemetryChannel = serverTelemetryChannel;
Operational details of ServerTelemetryChannel
ServerTelemetryChannel stores arriving items in an in-memory buffer. The items are serialized, compressed, and stored into a Transmission instance once every 30 seconds, or when 500 items are buffered. A single Transmission instance contains up to 500 items and represents a batch of telemetry that's sent over a single HTTPS call to the Application Insights service.
By default, a maximum of 10 Transmission instances can be sent in parallel. If telemetry is arriving at faster rates, or if the network or the Application Insights back end is slow, Transmission instances are stored in memory. The default capacity of this in-memory Transmission buffer is 5 MB. When the in-memory capacity is exceeded, Transmission instances are stored on local disk up to a limit of 50 MB.
Transmission instances are stored on local disk also when there are network problems. Only those items that are stored on a local disk survive an application crash. They're sent whenever the application starts again. If network issues persist, ServerTelemetryChannel uses an exponential backoff logic ranging from 10 seconds to 1 hour before retrying to send telemetry.
Configurable settings in channels
For the full list of configurable settings for each channel, see:
- InMemoryChannel
- ServerTelemetryChannel
Here are the most commonly used settings for ServerTelemetryChannel:
MaxTransmissionBufferCapacity: The maximum amount of memory, in bytes, used by the channel to buffer transmissions in memory. When this capacity is reached, new items are stored directly to local disk. The default value is 5 MB. Setting a higher value leads to less disk usage, but remember that items in memory are lost if the application crashes.MaxTransmissionSenderCapacity: The maximum number ofTransmissioninstances that are sent to Application Insights at the same time. The default value is 10. This setting can be configured to a higher number, which we recommend when a huge volume of telemetry is generated. High volume typically occurs during load testing or when sampling is turned off.StorageFolder: The folder that's used by the channel to store items to disk as needed. In Windows, either %LOCALAPPDATA% or %TEMP% is used if no other path is specified explicitly. In environments other than Windows, by default the following locations are used (in order): %TMPDIR%, /var/tmp/ or /tmp/.
Which channel should I use?
We recommend ServerTelemetryChannel for most production scenarios that involve long-running applications. For more about flushing telemetry, read about using Flush().
When to use Flush()
The Flush() method sends any buffered telemetry immediately. However, it should only be used in specific scenarios.
Use Flush() when:
- The application is about to shut down and you want to ensure telemetry is sent before exit.
- You're in an exception handler and need to guarantee telemetry is delivered.
- You're writing a short-lived process like a background job or CLI tool that exits quickly.
Avoid using Flush() in long-running applications such as web services. The SDK automatically manages buffering and transmission. Calling Flush() unnecessarily can cause performance problems and doesn't guarantee all data is sent, especially when using ServerTelemetryChannel, which doesn't flush synchronously.
Telemetry modules
Application Insights automatically collects telemetry about specific workloads without requiring manual tracking by user.
By default, the following automatic-collection modules are enabled. You can disable or configure them to alter their default behavior.
ASP.NET
Each telemetry module collects a specific type of data and uses the core API to send the data. The modules are installed by different NuGet packages, which also add the required lines to the .config file.
| Area | Description |
|---|---|
| Request tracking | Collects request telemetry (response time, result code) for incoming web requests. Module: Microsoft.ApplicationInsights.Web.RequestTrackingTelemetryModuleNuGet: Microsoft.ApplicationInsights.Web |
| Dependency tracking | Collects telemetry about outgoing dependencies (HTTP calls, SQL calls). To work in IIS, install Application Insights Agent. You can also write custom dependency tracking using TrackDependency API. Supports autoinstrumentation with App Service and VMs and virtual machine scale sets monitoring. Module: Microsoft.ApplicationInsights.DependencyCollector.DependencyTrackingTelemetryModuleNuGet: Microsoft.ApplicationInsights.DependencyCollector |
| Performance counters | Collects Windows Performance Counters (CPU, memory, network load from IIS installs). Specify which counters (including custom ones). For more information, see Collects system performance counters. Module: Microsoft.ApplicationInsights.Extensibility.PerfCounterCollector.PerformanceCollectorModuleNuGet:Microsoft.ApplicationInsights.PerfCounterCollector |
| Event counters | Collects .NET EventCounters. Recommended for ASP.NET Core and cross‑platform in place of Windows perf counters. Module: EventCounterCollectionModule (SDK ≥ 2.8.0) |
| Live Metrics (QuickPulse) | Collects telemetry for Live Metrics pane. Module: QuickPulseTelemetryModule |
| Heartbeats (App Service) | Sends heartbeats and custom metrics for App Service environment. Module: AppServicesHeartbeatTelemetryModule |
| Heartbeats (VMs and virtual machine scale sets) | Sends heartbeats and custom metrics for Azure VM environment. Module: AzureInstanceMetadataTelemetryModule |
| Diagnostics telemetry | Reports errors in Application Insights instrumentation code (for example, missing counters, ITelemetryInitializer exceptions). Trace telemetry appears in Diagnostic Search.Module: Microsoft.ApplicationInsights.Extensibility.Implementation.Tracing.DiagnosticsTelemetryModuleNuGet: Microsoft.ApplicationInsights Note: If you only install this package, the ApplicationInsights.config file isn't automatically created. |
| Developer mode (debugger attached) | Forces TelemetryChannel to send items immediately when debugger is attached. Reduces latency but increases CPU/network overhead.Module: Microsoft.ApplicationInsights.WindowsServer.DeveloperModeWithDebuggerAttachedTelemetryModuleNuGet: Application Insights Windows Server |
| Exception tracking (Web) | Tracks unhandled exceptions in web apps. See Failures and exceptions. Module: Microsoft.ApplicationInsights.Web.ExceptionTrackingTelemetryModuleNuGet: Microsoft.ApplicationInsights.Web |
| Exception tracking (Unobserved/Unhandled) | Tracks unobserved task exceptions and unhandled exceptions for worker roles, Windows services, and console apps. Modules: • Microsoft.ApplicationInsights.WindowsServer.UnobservedExceptionTelemetryModule• Microsoft.ApplicationInsights.WindowsServer.UnhandledExceptionTelemetryModuleNuGet: Microsoft.ApplicationInsights.WindowsServer |
| EventSource tracking | Sends configured EventSource events to Application Insights as traces. Module: Microsoft.ApplicationInsights.EventSourceListener.EventSourceTelemetryModuleNuGet: Microsoft.ApplicationInsights.EventSourceListener |
| ETW collector | Sends configured ETW provider events to Application Insights as traces. Module: Microsoft.ApplicationInsights.EtwCollector.EtwCollectorTelemetryModuleNuGet: Microsoft.ApplicationInsights.EtwCollector |
| Core API (not a module) | Core API used by other telemetry components and for custom telemetry. Module: Microsoft.ApplicationInsights packageNuGet: Microsoft.ApplicationInsights Note: If you only install this package, the ApplicationInsights.config file isn't automatically created. |
ASP.NET Core
| Area | Description |
|---|---|
| Request tracking | Built-in request tracking via ASP.NET Core Application Insights integration. Module: No separate module class. NuGet: Microsoft.ApplicationInsights.AspNetCore |
| Dependency tracking | Via Dependency Collector. NuGet:Microsoft.ApplicationInsights.DependencyCollector |
| Performance counters | Windows-only! On cross‑platform, use EventCounterCollectionModule (see next row).NuGet: Microsoft.ApplicationInsights.PerfCounterCollector |
| Event counters | Collects .NET EventCounters. Recommended for ASP.NET Core and cross‑platform in place of Windows perf counters. Module: EventCounterCollectionModule (SDK 2.8.0 and higher)NuGet: Microsoft.ApplicationInsights.EventCounterCollector |
| Live Metrics (QuickPulse) | Live Metrics enabled in ASP.NET Core Application Insights integration. Module: No separate module class. NuGet: Microsoft.ApplicationInsights.AspNetCore |
| Heartbeats collector (App Service) | Sends heartbeats (as custom metrics) with details about the App Service environment. Built-in via base SDK when hosted in App Service. Module: No separate module class. NuGet: Microsoft.ApplicationInsights.AspNetCore |
| Heartbeats collector (VMs and virtual machine scale sets) | Sends heartbeats (as custom metrics) with details about the Azure VM environment. Built-in via base SDK when hosted on Azure VMs and Azure virtual machine scale sets. Module: No separate module class. NuGet: Microsoft.ApplicationInsights.AspNetCore |
| Diagnostics telemetry | Reports errors in the Application Insights instrumentation code itself (for example, can't access performance counters, ITelemetryInitializer throws an exception). Trace telemetry appears in Diagnostic Search.Module: Microsoft.ApplicationInsights.Extensibility.Implementation.Tracing.DiagnosticsTelemetryModuleNuGet: Microsoft.ApplicationInsights |
| Developer mode (debugger attached) | Same behavior available; class is part of Windows Server package. Module: Microsoft.ApplicationInsights.WindowsServer.DeveloperModeWithDebuggerAttachedTelemetryModuleNuGet: Microsoft.ApplicationInsights.WindowsServer |
| Exception tracking (Web) | Automatic exception tracking in ASP.NET Core Application Insights integration Module: No separate module class. NuGet: Microsoft.ApplicationInsights.AspNetCore |
| Exception tracking (Unobserved/Unhandled) | Similar behavior via ASP.NET Core runtime/integration; class names are Windows Server-specific. NuGet: Microsoft.ApplicationInsights.WindowsServer |
| EventSource tracking | Sends configured EventSource events to Application Insights as traces. Module: Microsoft.ApplicationInsights.EventSourceListener.EventSourceTelemetryModuleNuGet: Microsoft.ApplicationInsights.EventSourceListener |
| ETW collector | Windows-only (ETW). Sends configured ETW provider events to Application Insights as traces. Module: Microsoft.ApplicationInsights.EtwCollector.EtwCollectorTelemetryModuleNuGet: Microsoft.ApplicationInsights.EtwCollector |
| Core API (not a module) | Core API used by other telemetry components and for custom telemetry. Module: Microsoft.ApplicationInsights packageNuGet: Microsoft.ApplicationInsights |
Configure telemetry modules
ASP.NET
Use the TelemetryModules section in ApplicationInsights.config to configure, add, or remove modules. The following examples:
- Configure
DependencyTrackingTelemetryModule(enable W3C header injection). - Configure
EventCounterCollectionModule(clear defaults and add a single counter). - Disable perf‑counter collection by removing
PerformanceCollectorModule.
<ApplicationInsights>
  <TelemetryModules>

    <!-- Dependency tracking -->
    <Add Type="Microsoft.ApplicationInsights.DependencyCollector.DependencyTrackingTelemetryModule, Microsoft.AI.DependencyCollector">
      <!-- Match Core example: enable W3C header injection -->
      <EnableW3CHeadersInjection>true</EnableW3CHeadersInjection>
    </Add>

    <!-- EventCounterCollectionModule: add a single counter (if you use event counters) -->
    <Add Type="Microsoft.ApplicationInsights.Extensibility.PerfCounterCollector.EventCounterCollectionModule, Microsoft.AI.PerfCounterCollector">
      <Counters>
        <!-- Mirrors Core example: only collect 'gen-0-size' from System.Runtime -->
        <Add ProviderName="System.Runtime" CounterName="gen-0-size" />
      </Counters>
    </Add>

    <!-- PerformanceCollectorModule (classic Windows performance counters).
         To DISABLE perf-counter collection, do NOT include this module.
         If it already exists in your file, remove or comment it out.
         Example of the line you would remove:
    <Add Type="Microsoft.ApplicationInsights.Extensibility.PerfCounterCollector.PerformanceCollectorModule, Microsoft.AI.PerfCounterCollector" />
    -->

  </TelemetryModules>
</ApplicationInsights>
Note
The exact set of modules present in your ApplicationInsights.config depends on which SDK packages you installed.
ASP.NET Core
Option 1: Configure telemetry modules using ConfigureTelemetryModule
To configure any default TelemetryModule, use the extension method ConfigureTelemetryModule<T> on IServiceCollection, as shown in the following example:
using Microsoft.ApplicationInsights.DependencyCollector;
using Microsoft.ApplicationInsights.Extensibility.PerfCounterCollector;

var builder = WebApplication.CreateBuilder(args);

builder.Services.AddApplicationInsightsTelemetry();

// The following configures DependencyTrackingTelemetryModule.
// Similarly, any other default modules can be configured.
builder.Services.ConfigureTelemetryModule<DependencyTrackingTelemetryModule>((module, o) =>
        {
            module.EnableW3CHeadersInjection = true;
        });

// The following removes all default counters from EventCounterCollectionModule, and adds a single one.
builder.Services.ConfigureTelemetryModule<EventCounterCollectionModule>((module, o) =>
        {
            module.Counters.Add(new EventCounterCollectionRequest("System.Runtime", "gen-0-size"));
        });

// The following removes PerformanceCollectorModule to disable perf-counter collection.
// Similarly, any other default modules can be removed.
var performanceCounterService = builder.Services.FirstOrDefault<ServiceDescriptor>(t => t.ImplementationType == typeof(PerformanceCollectorModule));
if (performanceCounterService != null)
{
    builder.Services.Remove(performanceCounterService);
}

var app = builder.Build();
Option 2: Configure telemetry modules using ApplicationInsightsServiceOptions
In SDK versions 2.12.2 and later, you can modify a few common settings by passing ApplicationInsightsServiceOptions to AddApplicationInsightsTelemetry, as in this example:
var builder = WebApplication.CreateBuilder(args);

var aiOptions = new Microsoft.ApplicationInsights.AspNetCore.Extensions.ApplicationInsightsServiceOptions();

// Disables adaptive sampling.
aiOptions.EnableAdaptiveSampling = false;

// Disables live metrics (also known as QuickPulse).
aiOptions.EnableQuickPulseMetricStream = false;

builder.Services.AddApplicationInsightsTelemetry(aiOptions);
var app = builder.Build();
This table has the full list of ApplicationInsightsServiceOptions settings:
| Setting | Description | Default |
|---|---|---|
| EnablePerformanceCounterCollectionModule | Enable/Disable PerformanceCounterCollectionModule. |
True |
| EnableRequestTrackingTelemetryModule | Enable/Disable RequestTrackingTelemetryModule. |
True |
| EnableEventCounterCollectionModule | Enable/Disable EventCounterCollectionModule. |
True |
| EnableDependencyTrackingTelemetryModule | Enable/Disable DependencyTrackingTelemetryModule. |
True |
| EnableAppServicesHeartbeatTelemetryModule | Enable/Disable AppServicesHeartbeatTelemetryModule. |
True |
| EnableAzureInstanceMetadataTelemetryModule | Enable/Disable AzureInstanceMetadataTelemetryModule. |
True |
| EnableQuickPulseMetricStream | Enable/Disable LiveMetrics feature. | True |
| EnableAdaptiveSampling | Enable/Disable Adaptive Sampling. | True |
| EnableHeartbeat | Enable/Disable the heartbeats feature. It periodically (15-min default) sends a custom metric named HeartbeatState with information about the runtime like .NET version and Azure environment information, if applicable. |
True |
| AddAutoCollectedMetricExtractor | Enable/Disable the AutoCollectedMetrics extractor. This telemetry processor sends preaggregated metrics about requests/dependencies before sampling takes place. |
True |
| RequestCollectionOptions.TrackExceptions | Enable/Disable reporting of unhandled exception tracking by the request collection module. | False in netstandard2.0 (because exceptions are tracked with ApplicationInsightsLoggerProvider). True otherwise. |
| EnableDiagnosticsTelemetryModule | Enable/Disable DiagnosticsTelemetryModule. Disabling causes the following settings to be ignored: EnableHeartbeat, EnableAzureInstanceMetadataTelemetryModule, and EnableAppServicesHeartbeatTelemetryModule. |
True |
For the most current list, see the configurable settings in ApplicationInsightsServiceOptions.
Configuration recommendation for Microsoft.ApplicationInsights.AspNetCore SDK 2.15.0 and later
In Microsoft.ApplicationInsights.AspNetCore SDK version 2.15.0 and later, configure every setting available in ApplicationInsightsServiceOptions, including ConnectionString. Use the application's IConfiguration instance. The settings must be under the section ApplicationInsights, as shown in the following example. The following section from appsettings.json configures the connection string and disables adaptive sampling and performance counter collection.
{
    "ApplicationInsights": {
    "ConnectionString": "<YOUR-CONNECTION-STRING>",
    "EnableAdaptiveSampling": false,
    "EnablePerformanceCounterCollectionModule": false
    }
}
If builder.Services.AddApplicationInsightsTelemetry(aiOptions) for ASP.NET Core 6.0 or services.AddApplicationInsightsTelemetry(aiOptions) for ASP.NET Core 3.1 and earlier is used, it overrides the settings from Microsoft.Extensions.Configuration.IConfiguration.
Worker Service
Option 1: Configure telemetry modules using ConfigureTelemetryModule
Application Insights uses telemetry modules to automatically collect telemetry about specific workloads without requiring manual tracking.
The following autocollection modules are enabled by default. These modules are responsible for automatically collecting telemetry. You can disable or configure them to alter their default behavior.
DependencyTrackingTelemetryModulePerformanceCollectorModuleQuickPulseTelemetryModuleAppServicesHeartbeatTelemetryModule(There's currently an issue involving this telemetry module. For a temporary workaround, see GitHub Issue 1689.)AzureInstanceMetadataTelemetryModule
To configure any default telemetry module, use the extension method ConfigureTelemetryModule on IServiceCollection, as shown in the following example:
    using Microsoft.ApplicationInsights.Extensibility.PerfCounterCollector.QuickPulse;
    using Microsoft.ApplicationInsights.Extensibility.PerfCounterCollector;

    public void ConfigureServices(IServiceCollection services)
    {
        services.AddApplicationInsightsTelemetryWorkerService();

            // The following configures QuickPulseTelemetryModule.
            // Similarly, any other default modules can be configured.
            services.ConfigureTelemetryModule<QuickPulseTelemetryModule>((module, o) =>
            {
                module.AuthenticationApiKey = "<YOUR-API-KEY-HERE>";
            });

            // The following removes PerformanceCollectorModule to disable perf-counter collection.
            // Similarly, any other default modules can be removed.
            var performanceCounterService = services.FirstOrDefault<ServiceDescriptor>
                                        (t => t.ImplementationType == typeof(PerformanceCollectorModule));
            if (performanceCounterService != null)
            {
                services.Remove(performanceCounterService);
            }
    }
Option 2: Configure telemetry modules using ApplicationInsightsServiceOptions
You can modify a few common settings by passing ApplicationInsightsServiceOptions to AddApplicationInsightsTelemetryWorkerService, as in this example:
using Microsoft.ApplicationInsights.WorkerService;

public void ConfigureServices(IServiceCollection services)
{
    var aiOptions = new ApplicationInsightsServiceOptions();
    // Disables adaptive sampling.
    aiOptions.EnableAdaptiveSampling = false;

    // Disables live metrics (also known as QuickPulse).
    aiOptions.EnableQuickPulseMetricStream = false;
    services.AddApplicationInsightsTelemetryWorkerService(aiOptions);
}
The ApplicationInsightsServiceOptions in this SDK is in the namespace Microsoft.ApplicationInsights.WorkerService as opposed to Microsoft.ApplicationInsights.AspNetCore.Extensions in the ASP.NET Core SDK.
The following table lists commonly used settings in ApplicationInsightsServiceOptions.
| Setting | Description | Default |
|---|---|---|
| EnableQuickPulseMetricStream | Enable/Disable the live metrics feature. | True |
| EnableAdaptiveSampling | Enable/Disable Adaptive Sampling. | True |
| EnableHeartbeat | Enable/Disable the Heartbeats feature, which periodically (15-min default) sends a custom metric named "HeartBeatState" with information about the runtime like .NET version and Azure environment, if applicable. | True |
| AddAutoCollectedMetricExtractor | Enable/Disable the AutoCollectedMetrics extractor, which is a telemetry processor that sends preaggregated metrics about Requests/Dependencies before sampling takes place. | True |
| EnableDiagnosticsTelemetryModule | Enable/Disable DiagnosticsTelemetryModule. Disabling this setting causes the following settings to be ignored: EnableHeartbeat, EnableAzureInstanceMetadataTelemetryModule, and EnableAppServicesHeartbeatTelemetryModule. |
True |
For the most up-to-date list, see the configurable settings in ApplicationInsightsServiceOptions.
Disable telemetry
ASP.NET
There's a node in the configuration file for each module. To disable a module, delete the node or comment it out.
ASP.NET Core
If you want to disable telemetry conditionally and dynamically, you can resolve the TelemetryConfiguration instance with an ASP.NET Core dependency injection container anywhere in your code and set the DisableTelemetry flag on it.
var builder = WebApplication.CreateBuilder(args);

builder.Services.AddApplicationInsightsTelemetry();

// any custom configuration can be done here:
builder.Services.Configure<TelemetryConfiguration>(x => x.DisableTelemetry = true);

var app = builder.Build();
The preceding code sample prevents the sending of telemetry to Application Insights. It doesn't prevent any automatic collection modules from collecting telemetry. If you want to remove a particular autocollection module, see telemetry modules.
Worker Service
If you want to disable telemetry conditionally and dynamically, you can resolve the TelemetryConfiguration instance with an ASP.NET Core dependency injection container anywhere in your code and set the DisableTelemetry flag on it.
    public void ConfigureServices(IServiceCollection services)
    {
        services.AddApplicationInsightsTelemetryWorkerService();
    }

    public void Configure(IApplicationBuilder app, IHostingEnvironment env, TelemetryConfiguration configuration)
    {
        configuration.DisableTelemetry = true;
        ...
    }
Connection string
This setting determines the Application Insights resource in which your data appears. Typically, you create a separate resource, with a separate connection string, for each of your applications.
See Connection strings in Application Insights for code samples.
If you want to set the connection string dynamically, for example, to send results from your application to different resources, you can omit the connection string from the configuration file and set it in code instead.
ASP.NET
To set the connection string for all instances of TelemetryClient, including standard telemetry modules, do this step in an initialization method, such as global.aspx.cs in an ASP.NET service:
using Microsoft.ApplicationInsights.Extensibility;
using Microsoft.ApplicationInsights;

    protected void Application_Start()
    {
        TelemetryConfiguration configuration = TelemetryConfiguration.CreateDefault();
        configuration.ConnectionString = "<YOUR-CONNECTION-STRING>";
        var telemetryClient = new TelemetryClient(configuration);
If you want to send a specific set of events to a different resource, you can set the key for a specific telemetry client:
    var tc = new TelemetryClient();
    tc.Context.ConnectionString = "<YOUR-CONNECTION-STRING>";
    tc.TrackEvent("myEvent");
    // ...
To get a new connection string, create a new resource in the Application Insights portal.
ASP.NET Core
In ASP.NET Core, configure the connection string in Program.cs during application startup using the TelemetryConfiguration from the dependency injection (DI) container:
using Microsoft.ApplicationInsights.Extensibility;
using Microsoft.ApplicationInsights;

var builder = WebApplication.CreateBuilder(args);

// Add Application Insights
builder.Services.AddApplicationInsightsTelemetry();

var app = builder.Build();

// Resolve TelemetryConfiguration from DI and set the connection string
var config = app.Services.GetRequiredService<TelemetryConfiguration>();
config.ConnectionString = "<YOUR-CONNECTION-STRING>";

app.Run();
If you want to send a specific set of events to a different resource, you can create a new TelemetryClient instance and set its connection string explicitly:
using Microsoft.ApplicationInsights;

var tc = new TelemetryClient();
tc.Context.ConnectionString = "<YOUR-CONNECTION-STRING>";
tc.TrackEvent("myEvent");
// ...
ApplicationId Provider
Note
For ASP.NET, this provider is available starting in SDK v2.6.0*.
The purpose of this provider is to look up an application ID based on a connection string. The application ID is included in RequestTelemetry and DependencyTelemetry and is used to determine correlation in the portal.
This functionality is available by setting TelemetryConfiguration.ApplicationIdProvider.
Interface: IApplicationIdProvider
public interface IApplicationIdProvider
{
    bool TryGetApplicationId(string connectionString, out string applicationId);
}
We provide two implementations in the Microsoft.ApplicationInsights SDK: ApplicationInsightsApplicationIdProvider and DictionaryApplicationIdProvider.
ApplicationInsightsApplicationIdProvider
This wrapper is for our Profile API. It throttles requests and cache results. This provider is automatically included when you install either Microsoft.ApplicationInsights.DependencyCollector or Microsoft.ApplicationInsights.Web.
The class exposes an optional property called ProfileQueryEndpoint. By default, it's set to https://dc.services.visualstudio.com/api/profiles/{0}/appId.
If you need to configure a proxy, we recommend proxying the base address and ensuring the path includes /api/profiles/{0}/appId. At runtime, {0} is replaced with the connection string for each request.
ASP.NET
Example configuration via ApplicationInsights.config
<ApplicationInsights>
    ...
    <ApplicationIdProvider Type="Microsoft.ApplicationInsights.Extensibility.Implementation.ApplicationId.ApplicationInsightsApplicationIdProvider, Microsoft.ApplicationInsights">
        <ProfileQueryEndpoint>https://dc.services.visualstudio.com/api/profiles/{0}/appId</ProfileQueryEndpoint>
    </ApplicationIdProvider>
    ...
</ApplicationInsights>
Example configuration via code
TelemetryConfiguration.Active.ApplicationIdProvider = new ApplicationInsightsApplicationIdProvider();
ASP.NET Core
Note
In ASP.NET Core, there's no ApplicationInsights.config file. Configuration is done through dependency injection (DI) in Program.cs or Startup.cs.
You can override the default provider or customize its ProfileQueryEndpoint.
using Microsoft.ApplicationInsights.Extensibility.Implementation.ApplicationId;

var builder = WebApplication.CreateBuilder(args);

// Add Application Insights
builder.Services.AddApplicationInsightsTelemetry();

// Replace default provider with custom configuration
builder.Services.AddSingleton<IApplicationIdProvider>(sp =>
    new ApplicationInsightsApplicationIdProvider
    {
        ProfileQueryEndpoint = "https://custom-proxy/api/profiles/{0}/appId"
    });

var app = builder.Build();
app.Run();
DictionaryApplicationIdProvider
This static provider relies on your configured connection string/application ID pairs.
This class has the Defined property, which is a Dictionary<string,string> of connection string/application ID pairs.
This class has the optional property Next, which can be used to configure another provider to use when a connection string is requested that doesn't exist in your configuration.
ASP.NET
Example configuration via ApplicationInsights.config
<ApplicationInsights>
    ...
    <ApplicationIdProvider Type="Microsoft.ApplicationInsights.Extensibility.Implementation.ApplicationId.DictionaryApplicationIdProvider, Microsoft.ApplicationInsights">
        <Defined>
            <Type key="ConnectionString_1" value="ApplicationId_1"/>
            <Type key="ConnectionString_2" value="ApplicationId_2"/>
        </Defined>
        <Next Type="Microsoft.ApplicationInsights.Extensibility.Implementation.ApplicationId.ApplicationInsightsApplicationIdProvider, Microsoft.ApplicationInsights" />
    </ApplicationIdProvider>
    ...
</ApplicationInsights>
Example configuration via code
TelemetryConfiguration.Active.ApplicationIdProvider = new DictionaryApplicationIdProvider{
 Defined = new Dictionary<string, string>
    {
        {"ConnectionString_1", "ApplicationId_1"},
        {"ConnectionString_2", "ApplicationId_2"}
    }
};
ASP.NET Core
using Microsoft.ApplicationInsights.Extensibility.Implementation.ApplicationId;

var builder = WebApplication.CreateBuilder(args);

builder.Services.AddApplicationInsightsTelemetry();

// Register DictionaryApplicationIdProvider
builder.Services.AddSingleton<IApplicationIdProvider>(sp =>
    new DictionaryApplicationIdProvider
    {
        Defined = new Dictionary<string, string>
        {
            { "ConnectionString_1", "ApplicationId_1" },
            { "ConnectionString_2", "ApplicationId_2" }
        },
        Next = new ApplicationInsightsApplicationIdProvider() // optional fallback
    });

var app = builder.Build();
app.Run();
Add client-side monitoring
The previous sections provided guidance on methods to automatically and manually configure server-side monitoring. To add client-side monitoring, use the client-side JavaScript SDK. You can monitor any web page's client-side transactions by adding a JavaScript (Web) SDK Loader Script before the closing </head> tag of the page's HTML.
Although it's possible to manually add the JavaScript (Web) SDK Loader Script to the header of each HTML page, we recommend that you instead add the JavaScript (Web) SDK Loader Script to a primary page. That action injects the JavaScript (Web) SDK Loader Script into all pages of a site.
ASP.NET
For the template-based ASP.NET MVC app from this article, the file that you need to edit is _Layout.cshtml. You can find it under Views > Shared. To add client-side monitoring, open _Layout.cshtml and follow the JavaScript (Web) SDK Loader Script-based setup instructions from the article about client-side JavaScript SDK configuration.
ASP.NET Core
If your application has client-side components, follow the next steps to start collecting usage telemetry using JavaScript (Web) SDK Loader Script injection by configuration.
In _ViewImports.cshtml, add injection:
@inject Microsoft.ApplicationInsights.AspNetCore.JavaScriptSnippet JavaScriptSnippetIn _Layout.cshtml, insert
HtmlHelperat the end of the<head>section but before any other script. If you want to report any custom JavaScript telemetry from the page, inject it after this snippet:@Html.Raw(JavaScriptSnippet.FullScript) </head>
As an alternative to using FullScript, ScriptBody is available starting in Application Insights SDK for ASP.NET Core version 2.14. Use ScriptBody if you need to control the <script> tag to set a Content Security Policy:
<script> // apply custom changes to this script tag.
    @Html.Raw(JavaScriptSnippet.ScriptBody)
</script>
The .cshtml file names referenced earlier are from a default MVC application template. Ultimately, if you want to properly enable client-side monitoring for your application, the JavaScript (Web) SDK Loader Script must appear in the <head> section of each page of your application that you want to monitor. Add the JavaScript (Web) SDK Loader Script to _Layout.cshtml in an application template to enable client-side monitoring.
If your project doesn't include _Layout.cshtml, you can still add client-side monitoring by adding the JavaScript (Web) SDK Loader Script to an equivalent file that controls the <head> of all pages within your app. Alternatively, you can add the JavaScript (Web) SDK Loader Script to multiple pages, but we don't recommend it.
Note
JavaScript injection provides a default configuration experience. If you require configuration beyond setting the connection string, you're required to remove autoinjection as described and manually add the JavaScript SDK.
Core API for custom events and metrics
Insert a few lines of code in your application to find out what users are doing with it, or to help diagnose issues. You can send telemetry from device and desktop apps, web clients, and web servers. Use the Application Insights core telemetry API to send custom events and metrics and your own versions of standard telemetry. This API is the same API that the standard Application Insights data collectors use.
API summary
The core API is uniform across all platforms, apart from a few variations like GetMetric (.NET only).
| Method | Used for |
|---|---|
TrackPageView |
Pages, screens, panes, or forms. |
TrackEvent |
User actions and other events. Used to track user behavior or to monitor performance. |
GetMetric |
Zero and multidimensional metrics, centrally configured aggregation, C# only. |
TrackMetric |
Performance measurements such as queue lengths not related to specific events. |
TrackException |
Logging exceptions for diagnosis. Trace where they occur in relation to other events and examine stack traces. |
TrackRequest |
Logging the frequency and duration of server requests for performance analysis. |
TrackTrace |
Resource Diagnostic log messages. You can also capture third-party logs. |
TrackDependency |
Logging the duration and frequency of calls to external components that your app depends on. |
You can attach properties and metrics to most of these telemetry calls.
Prerequisites
If you don't have a reference on Application Insights SDK yet:
Add the Application Insights SDK to your project.
In your device or web server code, include:
Get a TelemetryClient instance
Get an instance of TelemetryClient:
Note
If you use Azure Functions v2+ or Azure WebJobs v3+, see Monitor Azure Functions.
Note
For ASP.NET Core and Non-HTTP/Worker for .NET/.NET Core apps, get an instance of TelemetryClient from the dependency injection container as explained in their respective documentation.
private TelemetryClient telemetry = new TelemetryClient();
If you see a message that tells you this method is obsolete, see microsoft/ApplicationInsights-dotnet#1152 for more information.
Incoming HTTP requests are automatically captured. You might want to create more instances of TelemetryClient for other modules of your app. For example, you might have one TelemetryClient instance in your middleware class to report business logic events. You can set properties such as UserId and DeviceId to identify the machine. This information is attached to all events that the instance sends.
TelemetryClient.Context.User.Id = "...";
TelemetryClient.Context.Device.Id = "...";
Note
TelemetryClient is thread safe.
TrackEvent
In Application Insights, a custom event is a data point that you can display in Metrics Explorer as an aggregated count and in Search as individual occurrences. (It isn't related to MVC or other framework "events.")
Insert TrackEvent calls in your code to count various events. For example, you might want to track how often users choose a particular feature. Or you might want to know how often they achieve certain goals or make specific types of mistakes.
For example, in a game app, send an event whenever a user wins the game:
Custom events in Log Analytics
The telemetry is available in the customEvents table on the Application Insights Logs tab or usage experience. Events might come from trackEvent(..) or the Click Analytics Autocollection plug-in.
If sampling is in operation, the itemCount property shows a value greater than 1. For example, itemCount==10 means that of 10 calls to trackEvent(), the sampling process transmitted only one of them. To get a correct count of custom events, use code such as customEvents | summarize sum(itemCount).
Note
itemCount has a minimum value of one; the record itself represents an entry.
GetMetric
To learn how to effectively use the GetMetric() call to capture locally preaggregated metrics for .NET and .NET Core applications, see Custom metric collection in .NET and .NET Core.
TrackMetric
Note
Microsoft.ApplicationInsights.TelemetryClient.TrackMetric isn't the preferred method for sending metrics. Metrics should always be preaggregated across a time period before being sent. Use one of the GetMetric(..) overloads to get a metric object for accessing SDK preaggregation capabilities.
If you're implementing your own preaggregation logic, you can use the TrackMetric() method to send the resulting aggregates. If your application requires sending a separate telemetry item on every occasion without aggregation across time, you likely have a use case for event telemetry. See TelemetryClient.TrackEvent(Microsoft.ApplicationInsights.DataContracts.EventTelemetry).
Application Insights can chart metrics that aren't attached to particular events. For example, you could monitor a queue length at regular intervals. With metrics, the individual measurements are of less interest than the variations and trends, and so statistical charts are useful.
To send metrics to Application Insights, you can use the TrackMetric(..) API. There are two ways to send a metric:
Single value. Every time you perform a measurement in your application, you send the corresponding value to Application Insights.
For example, assume you have a metric that describes the number of items in a container. During a particular time period, you first put three items into the container and then you remove two items. Accordingly, you would call
TrackMetrictwice. First, you would pass the value3and then pass the value-2. Application Insights stores both values for you.Aggregation. When you work with metrics, every single measurement is rarely of interest. Instead, a summary of what happened during a particular time period is important. Such a summary is called aggregation.
In the preceding example, the aggregate metric sum for that time period is
1and the count of the metric values is2. When you use the aggregation approach, you invokeTrackMetriconly once per time period and send the aggregate values. We recommend this approach because it can significantly reduce the cost and performance overhead by sending fewer data points to Application Insights, while still collecting all relevant information.
Single value examples
To send a single metric value:
var sample = new MetricTelemetry();
sample.Name = "queueLength";
sample.Sum = 42.3;
telemetryClient.TrackMetric(sample);
Custom metrics in Log Analytics
The telemetry is available in the customMetrics table in Application Insights Analytics. Each row represents a call to trackMetric(..) in your app.
valueSum: The sum of the measurements. To get the mean value, divide byvalueCount.valueCount: The number of measurements that were aggregated into thistrackMetric(..)call.
Note
valueCount has a minimum value of one; the record itself represents an entry.
Page views
In a device or webpage app, page view telemetry is sent by default when each screen or page is loaded. But you can change the default to track page views at more or different times. For example, in an app that displays tabs or panes, you might want to track a page whenever the user opens a new pane.
User and session data is sent as properties along with page views, so the user and session charts come alive when there's page view telemetry.
Custom page views
Page telemetry in Log Analytics
In Log Analytics, two tables show data from browser operations:
pageViews: Contains data about the URL and page title.browserTimings: Contains data about client performance like the time taken to process the incoming data.
To find how long the browser takes to process different pages:
browserTimings
| summarize avg(networkDuration), avg(processingDuration), avg(totalDuration) by name
To discover the popularity of different browsers:
pageViews
| summarize count() by client_Browser
To associate page views to AJAX calls, join with dependencies:
pageViews
| join (dependencies) on operation_Id
TrackRequest
The server SDK uses TrackRequest to log HTTP requests.
You can also call it yourself if you want to simulate requests in a context where you don't have the web service module running.
The recommended way to send request telemetry is where the request acts as an operation context.
Operation context
You can correlate telemetry items together by associating them with operation context. The standard request-tracking module does it for exceptions and other events that are sent while an HTTP request is being processed. In Search and Analytics, you can easily find any events associated with the request by using its operation ID.
When you track telemetry manually, the easiest way to ensure telemetry correlation is by using this pattern:
// Establish an operation context and associated telemetry item:
using (var operation = telemetryClient.StartOperation<RequestTelemetry>("operationName"))
{
    // Telemetry sent in here uses the same operation ID.
    ...
    telemetryClient.TrackTrace(...); // or other Track* calls
    ...

    // Set properties of containing telemetry item--for example:
    operation.Telemetry.ResponseCode = "200";

    // Optional: explicitly send telemetry item:
    telemetryClient.StopOperation(operation);

} // When operation is disposed, telemetry item is sent.
For more information on correlation, see Telemetry correlation in Application Insights.
Along with setting an operation context, StartOperation creates a telemetry item of the type that you specify. It sends the telemetry item when you dispose of the operation or if you explicitly call StopOperation. If you use RequestTelemetry as the telemetry type, its duration is set to the timed interval between start and stop.
Telemetry items reported within a scope of operation become children of such an operation. Operation contexts could be nested.
In Search, the operation context is used to create the Related Items list.

For more information on custom operations tracking, see Track custom operations with Application Insights .NET SDK.
Requests in Log Analytics
In Application Insights Analytics, requests show up in the requests table.
If sampling is in operation, the itemCount property shows a value greater than 1. For example, itemCount==10 means that of 10 calls to trackRequest(), the sampling process transmitted only one of them. To get a correct count of requests and average duration segmented by request names, use code such as:
requests
| summarize count = sum(itemCount), avgduration = avg(duration) by name
TrackException
Send exceptions to Application Insights:
- To count them, as an indication of the frequency of a problem.
- To examine individual occurrences.
The reports include the stack traces.
The SDKs catch many exceptions automatically, so you don't always have to call TrackException explicitly.
Exceptions in Log Analytics
In Application Insights Analytics, exceptions show up in the exceptions table.
If sampling is in operation, the itemCount property shows a value greater than 1. For example, itemCount==10 means that of 10 calls to trackException(), the sampling process transmitted only one of them. To get a correct count of exceptions segmented by type of exception, use code such as:
exceptions
| summarize sum(itemCount) by type
Most of the important stack information is already extracted into separate variables, but you can pull apart the details structure to get more. Because this structure is dynamic, you should cast the result to the type you expect. For example:
exceptions
| extend method2 = tostring(details[0].parsedStack[1].method)
To associate exceptions with their related requests, use a join:
exceptions
| join (requests) on operation_Id
TrackTrace
Use TrackTrace to help diagnose problems by sending a "breadcrumb trail" to Application Insights. You can send chunks of diagnostic data and inspect them in Search.
In .NET Log adapters, use this API to send third-party logs to the portal.
telemetry.TrackTrace(message, SeverityLevel.Warning, properties);
Log a diagnostic event such as entering or leaving a method.
| Parameter | Description |
|---|---|
message |
Diagnostic data. Can be much longer than a name. |
properties |
Map of string to string. More data is used to filter exceptions in the portal. Defaults to empty. |
severityLevel |
Supported values: SeverityLevel.ts. |
You can search on message content, but unlike property values, you can't filter on it.
The size limit on message is much higher than the limit on properties. An advantage of TrackTrace is that you can put relatively long data in the message. For example, you can encode POST data there.
You can also add a severity level to your message. And, like other telemetry, you can add property values to help you filter or search for different sets of traces. For example:
var telemetry = new Microsoft.ApplicationInsights.TelemetryClient();
telemetry.TrackTrace("Slow database response",
                SeverityLevel.Warning,
                new Dictionary<string,string> { {"database", db.ID} });
In Search, you can then easily filter out all the messages of a particular severity level that relate to a particular database.
Traces in Log Analytics
In Application Insights Analytics, calls to TrackTrace show up in the traces table.
If sampling is in operation, the itemCount property shows a value greater than 1. For example, itemCount==10 means that of 10 calls to trackTrace(), the sampling process transmitted only one of them. To get a correct count of trace calls, use code such as traces | summarize sum(itemCount).
TrackDependency
Use the TrackDependency call to track the response times and success rates of calls to an external piece of code. The results appear in the dependency charts in the portal. The following code snippet must be added wherever a dependency call is made.
Note
For .NET and .NET Core, you can alternatively use the TelemetryClient.StartOperation (extension) method that fills the DependencyTelemetry properties that are needed for correlation and some other properties like the start time and duration, so you don't need to create a custom timer as with the following examples. For more information, see the section on outgoing dependency tracking in Track custom operations with Application Insights .NET SDK.
var success = false;
var startTime = DateTime.UtcNow;
var timer = System.Diagnostics.Stopwatch.StartNew();
try
{
    success = dependency.Call();
}
catch(Exception ex)
{
    success = false;
    telemetry.TrackException(ex);
    throw new Exception("Operation went wrong", ex);
}
finally
{
    timer.Stop();
    telemetry.TrackDependency("DependencyType", "myDependency", "myCall", startTime, timer.Elapsed, success);
}
Remember that the server SDKs include a dependency module that discovers and tracks certain dependency calls automatically, for example, to databases and REST APIs. You have to install an agent on your server to make the module work.
You use this call if you want to track calls that the automated tracking doesn't catch.
To turn off the standard dependency-tracking module in C#, edit ApplicationInsights.config and delete the reference to DependencyCollector.DependencyTrackingTelemetryModule.
Dependencies in Log Analytics
In Application Insights Analytics, trackDependency calls show up in the dependencies table.
If sampling is in operation, the itemCount property shows a value greater than 1. For example, itemCount==10 means that of 10 calls to trackDependency(), the sampling process transmitted only one of them. To get a correct count of dependencies segmented by target component, use code such as:
dependencies
| summarize sum(itemCount) by target
To associate dependencies with their related requests, use a join:
dependencies
| join (requests) on operation_Id
Flushing data
Normally, the SDK sends data at fixed intervals, typically 30 seconds, or whenever the buffer is full, which is typically 500 items. In some cases, you might want to flush the buffer. An example is if you're using the SDK in an application that shuts down.
When you use Flush(), we recommend this pattern:
telemetry.Flush();
// Allow some time for flushing before shutdown.
System.Threading.Thread.Sleep(5000);
When you use FlushAsync(), we recommend this pattern:
await telemetryClient.FlushAsync()
// No need to sleep
We recommend always flushing as part of the application shutdown to guarantee that telemetry isn't lost.
Note
Review Autoflush configuration: Enabling autoflush in your web.config file can lead to performance degradation in .NET applications instrumented with Application Insights. With autoflush enabled, every invocation of System.Diagnostics.Trace.Trace* methods results in individual telemetry items being sent as separate distinct web requests to the ingestion service. This can potentially cause network and storage exhaustion on your web servers. For enhanced performance, it's recommended to disable autoflush and also, utilize the ServerTelemetryChannel, designed for a more effective telemetry data transmission.
The function is asynchronous for the server telemetry channel.
Authenticated users
In a web app, users are identified by cookies by default. A user might be counted more than once if they access your app from a different machine or browser, or if they delete cookies.
If users sign in to your app, you can get a more accurate count by setting the authenticated user ID in the browser code. It isn't necessary to use the user's actual sign-in name. It only has to be an ID that's unique to that user. It must not include spaces or any of the characters ,;=|.
The user ID is also set in a session cookie and sent to the server. If the server SDK is installed, the authenticated user ID is sent as part of the context properties of both client and server telemetry. You can then filter and search on it.
If your app groups users into accounts, you can also pass an identifier for the account. The same character restrictions apply.
In Metrics Explorer, you can create a chart that counts Users, Authenticated, and User accounts.
You can also search for client data points with specific user names and accounts.
Note
The EnableAuthenticationTrackingJavaScript property in the ApplicationInsightsServiceOptions class in the .NET Core SDK simplifies the JavaScript configuration needed to inject the user name as the Auth ID for each trace sent by the Application Insights JavaScript SDK.
When this property is set to true, the user name from the user in the ASP.NET Core is printed along with client-side telemetry. For this reason, adding appInsights.setAuthenticatedUserContext manually isn't required anymore because it's already injected by the SDK for ASP.NET Core. The Auth ID is also sent to the server where the SDK in .NET Core identifies and uses it for any server-side telemetry, as described in the JavaScript API reference.
For JavaScript applications that don't work in the same way as ASP.NET Core MVC, such as SPA web apps, you still need to add appInsights.setAuthenticatedUserContext manually.
Filter, search, and segment your data by using properties
You can attach properties and measurements to your events, metrics, page views, exceptions, and other telemetry data.
Properties are string values that you can use to filter your telemetry in the usage reports. For example, if your app provides several games, you can attach the name of the game to each event so that you can see which games are more popular.
There's a limit of 8,192 on the string length. If you want to send large chunks of data, use the message parameter of TrackTrace.
Metrics are numeric values that can be presented graphically. For example, you might want to see if there's a gradual increase in the scores that your gamers achieve. The graphs can be segmented by the properties that are sent with the event so that you can get separate or stacked graphs for different games.
Metric values should be greater than or equal to 0 to display correctly.
There are some limits on the number of properties, property values, and metrics that you can use.
// Set up some properties and metrics:
var properties = new Dictionary <string, string>
    {{"game", currentGame.Name}, {"difficulty", currentGame.Difficulty}};
var metrics = new Dictionary <string, double>
    {{"Score", currentGame.Score}, {"Opponents", currentGame.OpponentCount}};

// Send the event:
telemetry.TrackEvent("WinGame", properties, metrics);
Important
Make sure you don't log personally identifiable information in properties.
Alternative way to set properties and metrics
If it's more convenient, you can collect the parameters of an event in a separate object:
var event = new EventTelemetry();

event.Name = "WinGame";
event.Metrics["processingTime"] = stopwatch.Elapsed.TotalMilliseconds;
event.Properties["game"] = currentGame.Name;
event.Properties["difficulty"] = currentGame.Difficulty;
event.Metrics["Score"] = currentGame.Score;
event.Metrics["Opponents"] = currentGame.Opponents.Length;

telemetry.TrackEvent(event);
Warning
Don't reuse the same telemetry item instance (event in this example) to call Track*() multiple times. This practice might cause telemetry to be sent with incorrect configuration.
Custom measurements and properties in Log Analytics
In Log Analytics, custom metrics and properties show in the customMeasurements and customDimensions attributes of each telemetry record.
For example, if you add a property named "game" to your request telemetry, this query counts the occurrences of different values of "game" and shows the average of the custom metric "score":
requests
| summarize sum(itemCount), avg(todouble(customMeasurements.score)) by tostring(customDimensions.game)
Notice that:
- When you extract a value from the
customDimensionsorcustomMeasurementsJSON, it has dynamic type, so you must cast ittostringortodouble. - To take account of the possibility of sampling, use
sum(itemCount)notcount().
Timing events
Sometimes you want to chart how long it takes to perform an action. For example, you might want to know how long users take to consider choices in a game. To obtain this information, use the measurement parameter.
var stopwatch = System.Diagnostics.Stopwatch.StartNew();

// ... perform the timed action ...

stopwatch.Stop();

var metrics = new Dictionary <string, double>
    {{"processingTime", stopwatch.Elapsed.TotalMilliseconds}};

// Set up some properties:
var properties = new Dictionary <string, string>
    {{"signalSource", currentSignalSource.Name}};

// Send the event:
telemetry.TrackEvent("SignalProcessed", properties, metrics);
Default properties for custom telemetry
If you want to set default property values for some of the custom events that you write, set them in a TelemetryClient instance. They're attached to every telemetry item that's sent from that client.
using Microsoft.ApplicationInsights.DataContracts;

var gameTelemetry = new TelemetryClient();
gameTelemetry.Context.GlobalProperties["Game"] = currentGame.Name;
// Now all telemetry is automatically sent with the context property:
gameTelemetry.TrackEvent("WinGame");
Individual telemetry calls can override the default values in their property dictionaries.
To add properties to all telemetry, including the data from standard collection modules, implement ITelemetryInitializer.
Disable telemetry
To dynamically stop and start the collection and transmission of telemetry:
using  Microsoft.ApplicationInsights.Extensibility;

TelemetryConfiguration.Active.DisableTelemetry = true;
Developer mode
During debugging, it's useful to have your telemetry expedited through the pipeline so that you can see results immediately. You also get other messages that help you trace any problems with the telemetry. Switch it off in production because it might slow down your app.
Set the instrumentation key for selected custom telemetry
var telemetry = new TelemetryClient();
telemetry.InstrumentationKey = "---my key---";
// ...
Dynamic connection string
To avoid mixing up telemetry from development, test, and production environments, you can create separate Application Insights resources and change their keys, depending on the environment.
Instead of getting the instrumentation key from the configuration file, you can set it in your code. Set the key in an initialization method, such as global.aspx.cs in an ASP.NET service:
protected void Application_Start()
{
Microsoft.ApplicationInsights.Extensibility.
TelemetryConfiguration.Active.InstrumentationKey =
// - for example -
WebConfigurationManager.Settings["ikey"];
...
}
TelemetryContext
TelemetryClient has a Context property, which contains values that are sent along with all telemetry data. They're normally set by the standard telemetry modules, but you can also set them yourself. For example:
telemetry.Context.Operation.Name = "MyOperationName";
If you set any of these values yourself, consider removing the relevant line from ApplicationInsights.config so that your values and the standard values don't get confused.
- Component: The app and its version.
- Device: Data about the device where the app is running. In web apps, it's the server or client device that the telemetry is sent from.
- InstrumentationKey: The Application Insights resource in Azure where the telemetry appears. It's usually picked up from ApplicationInsights.config.
- Location: The geographic location of the device.
- Operation: In web apps, the current HTTP request. In other app types, you can set this value to group events together.
- ID: A generated value that correlates different events so that when you inspect any event in Diagnostic Search, you can find related items.
- Name: An identifier, usually the URL of the HTTP request.
- SyntheticSource: If not null or empty, a string that indicates that the source of the request has been identified as a robot or web test. By default, it's excluded from calculations in Metrics Explorer.
- Session: The user's session. The ID is set to a generated value, which is changed when the user hasn't been active for a while.
- User: User information.
Limits
There are some limits on the number of metrics and events per application, that is, per connection string. Limits depend on the pricing plan that you choose.
| Resource | Default limit | Maximum limit | Notes |
|---|---|---|---|
| Total data per day | 100 GB | Contact support. | You can set a cap to reduce data. If you need more data, you can increase the limit in the portal, up to 1,000 GB. For capacities greater than 1,000 GB, send email to AIDataCap@microsoft.com. |
| Throttling | 32,000 events/second | Contact support. | The limit is measured over a minute. |
| Data retention logs | 30 to 730 days | 730 days | This resource is for Logs. |
| Data retention metrics | 90 days | 90 days | This resource is for Metrics Explorer. |
| Availability multistep test detailed results retention | 90 days | 90 days | This resource provides detailed results of each step. |
| Maximum telemetry item size | 64 KB | 64 KB | |
| Maximum telemetry items per batch | 64,000 | 64,000 | |
| Property and metric name length | 150 | 150 | See type schemas. |
| Property value string length | 8,192 | 8,192 | See type schemas. |
| Trace and exception message length | 32,768 | 32,768 | See type schemas. |
| Availability tests count per Application Insights resource | 100 | 100 | |
| Availability tests count per resource group | 800 | 800 | See Azure Resource Manager |
| Availability tests maximum redirects per test | 10 | 10 | |
| Availability tests minimum test frequency | 300 seconds | Custom test frequencies or frequencies less than 5 minutes require custom TrackAvailability implementations. | |
| .NET Profiler and Snapshot Debugger data retention | Two weeks | Contact support. Maximum retention limit is six months. | |
| .NET Profiler data sent per day | No limit | No limit. | |
| Snapshot Debugger data sent per day | 30 snapshots per day per monitored app | No limit. | The number of snapshots collected per application can be modified through configuration. |
For more information about pricing and quotas, see Application Insights billing.
To avoid hitting the data rate limit, use sampling.
To determine how long data is kept, see Data retention and privacy.
Sample applications
.NET Core console application: Use this sample if you're using a console application written in either .NET Core (2.0 or higher) or .NET Framework (4.7.2 or higher).
ASP.NET Core background tasks with HostedServices: Use this sample if you're in ASP.NET Core and creating background tasks in accordance with official guidance.
.NET Core Worker Service: Use this sample if you have a .NET Worker Service application in accordance with official guidance.
Troubleshooting
See the dedicated troubleshooting articles for .NET and Node.js.
Test connectivity between your application host and the ingestion service
Application Insights SDKs and agents send telemetry to get ingested as REST calls to our ingestion endpoints. You can test connectivity from your web server or application host machine to the ingestion service endpoints by using raw REST clients from PowerShell or curl commands. See Troubleshoot missing application telemetry in Azure Monitor Application Insights.
Open-source SDK
Read and contribute to the code for .NET and Node.js.
Release Notes
Service Updates also summarize major Application Insights improvements.
Next steps
- Validate you're running a supported version of the Application Insights SDK.
- See the data model for Application Insights types and data model.
- Check the System.Diagnostics.Activity User Guide to see how we correlate telemetry.
- To review frequently asked questions (FAQ), see: