Note
Access to this page requires authorization. You can try signing in or changing directories.
Access to this page requires authorization. You can try changing directories.
APPLIES TO:  Azure Data Factory
Azure Synapse Analytics
Azure Data Factory
Azure Synapse Analytics
This article outlines how to troubleshoot copy activity performance issue in Azure Data Factory.
After you run a copy activity, you can collect the run result and performance statistics in copy activity monitoring view. The following image shows an example.
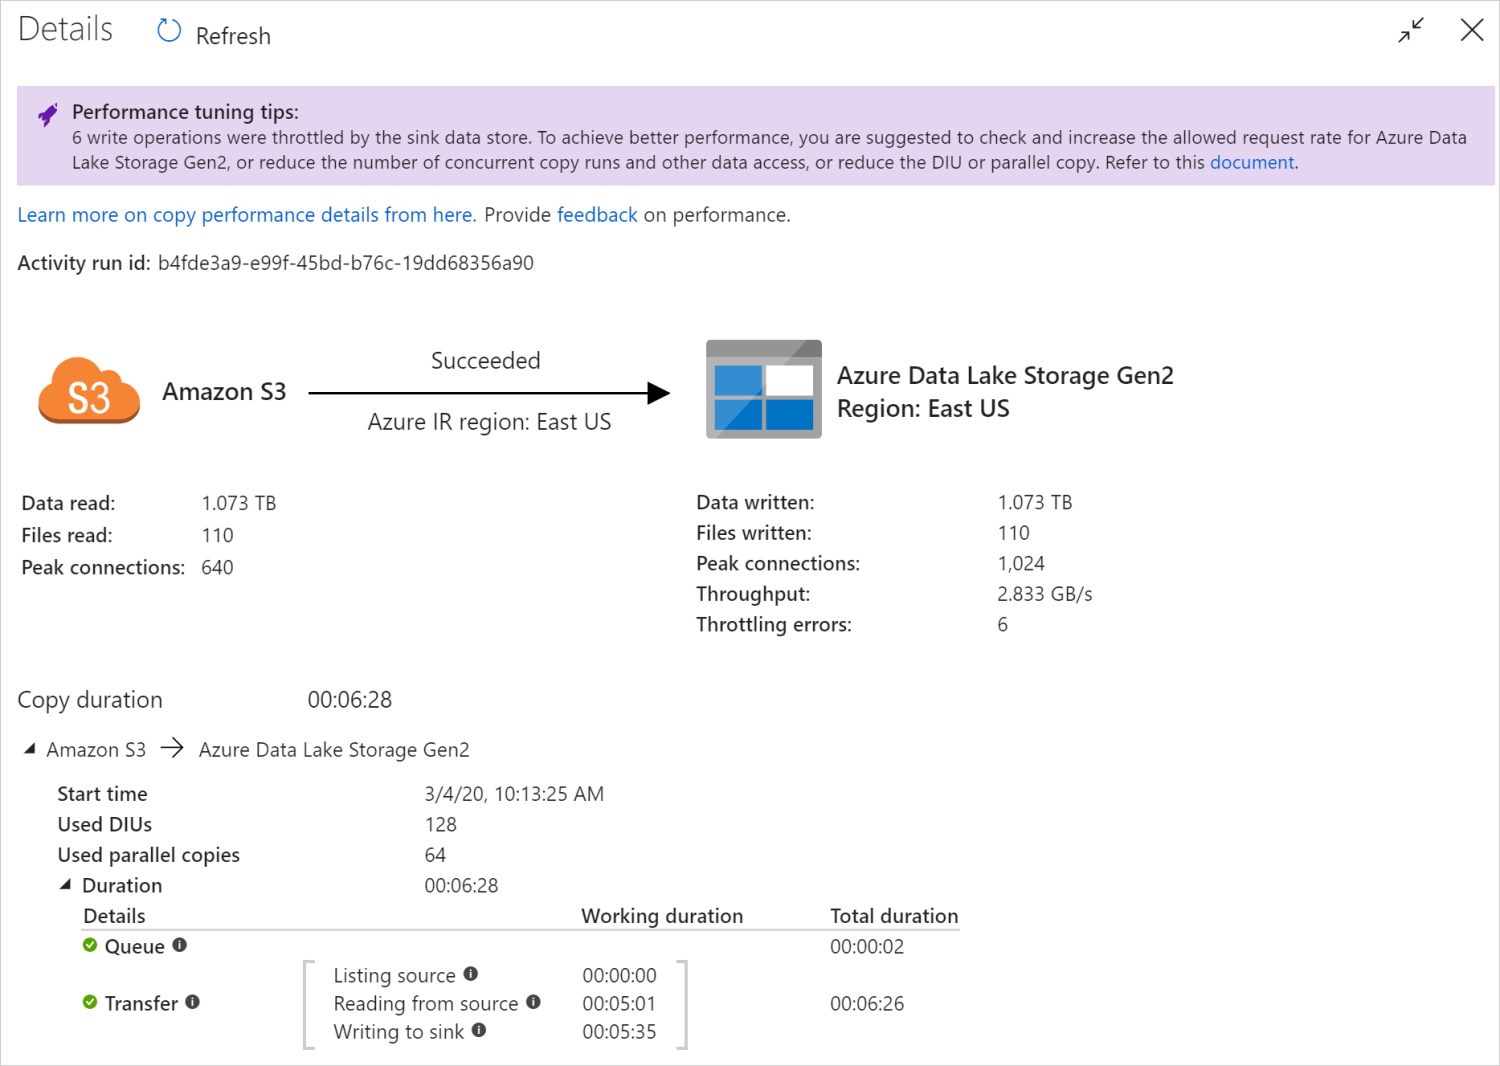
Performance tuning tips
In some scenarios, when you run a copy activity, you see "Performance tuning tips" at the top as shown in the prior image. The tips tell you the bottleneck identified by the service for this particular copy run, along with suggestion on how to boost copy throughput. Try making the recommended change, then run the copy again.
As a reference, currently the performance tuning tips provide suggestions for the following cases:
| Category | Performance tuning tips |
|---|---|
| Data store specific | Loading data into Azure Synapse Analytics: suggest using PolyBase or COPY statement if it's not used. |
| Copying data from/to Azure SQL Database: when DTU is under high utilization, suggest upgrading to higher tier. | |
| Copying data from/to Azure Cosmos DB: when RU is under high utilization, suggest upgrading to larger RU. | |
| Copying data from SAP Table: when copying large amount of data, suggest using SAP connector's partition option to enable parallel load and increase the max partition number. | |
| Ingesting data from Amazon Redshift: suggest using UNLOAD if it's not used. | |
| Data store throttling | If many read/write operations are throttled by the data store during copy, suggest checking and increase the allowed request rate for the data store, or reduce the concurrent workload. |
| Integration runtime | If you use a Self-hosted Integration Runtime (IR) and copy activity waits long in the queue until the IR has available resource to execute, suggest scaling out/up your IR. |
| If you use an Azure Integration Runtime that is in a not optimal region resulting in slow read/write, suggest configuring to use an IR in another region. | |
| Fault tolerance | If you configure fault tolerance and skipping incompatible rows results in slow performance, suggest ensuring source and sink data are compatible. |
| Staged copy | If staged copy is configured but not helpful for your source-sink pair, suggest removing it. |
| Resume | When copy activity is resumed from last failure point but you happen to change the DIU setting after the original run, note the new DIU setting doesn't take effect. |
Understand copy activity execution details
The execution details and durations at the bottom of the copy activity monitoring view describes the key stages your copy activity goes through (see example at the beginning of this article), which is especially useful for troubleshooting the copy performance. The bottleneck of your copy run is the one with the longest duration. Refer to the following table on each stage's definition, and learn how to Troubleshoot copy activity on Azure IR and Troubleshoot copy activity on Self-hosted IR with such info.
| Stage | Description |
|---|---|
| Queue | The elapsed time until the copy activity actually starts on the integration runtime. |
| Precopy script | The elapsed time between copy activity starting on IR and copy activity finishing executing the precopy script in sink data store. Apply when you configure the precopy script for database sinks, for example, when writing data into Azure SQL Database do clean up before copy new data. |
| Transfer | The elapsed time between the end of the previous step and the IR transferring all the data from source to sink. Note the substeps under transfer run in parallel, and some operations aren't shown now for example, parsing/generating file format. - Time to first byte: The time elapsed between the end of the previous step and the time when the IR receives the first byte from the source data store. Applies to non-file-based sources. - Listing source: The amount of time spent on enumerating source files or data partitions. The latter applies when you configure partition options for database sources, for example, when copy data from databases like Oracle/SAP HANA/Teradata/Netezza/etc. -Reading from source: The amount of time spent on retrieving data from source data store. - Writing to sink: The amount of time spent on writing data to sink data store. Note some connectors don't have this metric at the moment, including Azure AI Search, Azure Data Explorer, Azure Table storage, Oracle, SQL Server, Common Data Service, Dynamics 365, Dynamics CRM, Salesforce/Salesforce Service Cloud. |
Troubleshoot copy activity on Azure IR
Follow the Performance tuning steps to plan and conduct performance test for your scenario.
When the copy activity performance doesn't meet your expectation, to troubleshoot single copy activity running on Azure Integration Runtime, if you see performance tuning tips shown up in the copy monitoring view, apply the suggestion and try again. Otherwise, understand copy activity execution details, check which stage has the longest duration, and apply the guidance below to boost copy performance:
"Pre-copy script" experienced long duration: it means the precopy script running on sink database takes long to finish. Tune the specified precopy script logic to enhance the performance. If you need further help on improving the script, contact your database team.
"Transfer - Time to first byte" experienced long working duration: your source query takes a long time to return any data. This could mean the query takes a long time to process on your source because the source is busy with other tasks, or the query is not optimal, or the data is stored in such a way that it takes a long time to retrieve. Consider if other queries are running on that source at the same time, or if there are any updates you could make to your query so it can retrieve data more quickly. If there is a team that manages your data source, contact them to modify your query or check source performance.
"Transfer - Listing source" experienced long working duration: it means enumerating source files or source database data partitions is slow.
When copying data from file-based source, if you use wildcard filter on folder path or file name (
wildcardFolderPathorwildcardFileName), or use file last modified time filter (modifiedDatetimeStartormodifiedDatetimeEnd), note such filter would result in copy activity listing all the files under the specified folder to client side then apply the filter. Such file enumeration could become the bottleneck especially when only small set of files met the filter rule.Check whether you can copy files based on datetime partitioned file path or name. Such way doesn't bring burden on listing source side.
Check if you can use data store's native filter instead, specifically "prefix" for Amazon S3/Azure Blob storage/Azure Files. Those filters are data store server-side filter and would have better performance.
Consider to split single large data set into several smaller data sets, and let those copy jobs run concurrently each tackles portion of data. You can do this with Lookup/GetMetadata + ForEach + Copy. Refer to Copy files from multiple containers or Migrate data from Amazon S3 to ADLS Gen2 solution templates as general example.
Check if the service reports any throttling error on source or if your data store is under high utilization state. If so, either reduce your workloads on the data store, or try contacting your data store administrator to increase the throttling limit or available resource.
Use Azure IR in the same or close to your source data store region.
"Transfer - reading from source" experienced long working duration:
Adopt connector-specific data loading best practice if applies. For example, when copying data from Amazon Redshift, configure to use Redshift UNLOAD.
Check if the service reports any throttling error on source or if your data store is under high utilization. If so, either reduce your workloads on the data store, or try contacting your data store administrator to increase the throttling limit or available resource.
Check your copy source and sink pattern:
If your copy pattern supports larger than four Data Integration Units (DIUs) - refer to this section on details, generally you can try increasing DIUs to get better performance.
Otherwise, consider to split single large data set into several smaller data sets, and let those copy jobs run concurrently each tackles portion of data. You can do this with Lookup/GetMetadata + ForEach + Copy. Refer to Copy files from multiple containers, Migrate data from Amazon S3 to ADLS Gen2, or Bulk copy with a control table solution templates as general example.
Use Azure IR in the same or close to your source data store region.
"Transfer - writing to sink" experienced long working duration:
Adopt connector-specific data loading best practice if applies. For example, when copying data into Azure Synapse Analytics, use PolyBase or COPY statement.
Check if the service reports any throttling error on sink or if your data store is under high utilization. If so, either reduce your workloads on the data store, or try contacting your data store administrator to increase the throttling limit or available resource.
Check your copy source and sink pattern:
If your copy pattern supports larger than four Data Integration Units (DIUs) - refer to this section on details, generally you can try increasing DIUs to get better performance.
Otherwise, gradually tune the parallel copies. Too many parallel copies could even hurt the performance.
Use Azure IR in the same or close to your sink data store region.
Troubleshoot copy activity on Self-hosted IR
Follow the Performance tuning steps to plan and conduct performance test for your scenario.
When the copy performance doesn't meet your expectation, to troubleshoot single copy activity running on Azure Integration Runtime, if you see performance tuning tips shown up in the copy monitoring view, apply the suggestion and try again. Otherwise, understand copy activity execution details, check which stage has the longest duration, and apply the guidance below to boost copy performance:
"Queue" experienced long duration: it means the copy activity waits long in the queue until your Self-hosted IR has resource to execute. Check the IR capacity and usage, and scale up or out according to your workload.
"Transfer - Time to first byte" experienced long working duration: it means your source query takes long to return any data. Check and optimize the query or server. If you need further help, contact your data store team.
"Transfer - Listing source" experienced long working duration: it means enumerating source files or source database data partitions is slow.
Check if the Self-hosted IR machine has low latency connecting to source data store. If your source is in Azure, you can use this tool to check the latency from the Self-hosted IR machine to the Azure region, the less the better.
When copying data from file-based source, if you use wildcard filter on folder path or file name (
wildcardFolderPathorwildcardFileName), or use file last modified time filter (modifiedDatetimeStartormodifiedDatetimeEnd), note such filter would result in copy activity listing all the files under the specified folder to client side then apply the filter. Such file enumeration could become the bottleneck especially when only small set of files met the filter rule.Check whether you can copy files based on datetime partitioned file path or name. Such way doesn't bring burden on listing source side.
Check if you can use data store's native filter instead, specifically "prefix" for Amazon S3/Azure Blob storage/Azure Files. Those filters are data store server-side filter and would have better performance.
Consider to split single large data set into several smaller data sets, and let those copy jobs run concurrently each tackles portion of data. You can do this with Lookup/GetMetadata + ForEach + Copy. Refer to Copy files from multiple containers or Migrate data from Amazon S3 to ADLS Gen2 solution templates as general example.
Check if the service reports any throttling error on source or if your data store is under high utilization state. If so, either reduce your workloads on the data store, or try contacting your data store administrator to increase the throttling limit or available resource.
"Transfer - reading from source" experienced long working duration:
Check if the Self-hosted IR machine has low latency connecting to source data store. If your source is in Azure, you can use this tool to check the latency from the Self-hosted IR machine to the Azure regions, the less the better.
Check if the Self-hosted IR machine has enough inbound bandwidth to read and transfer the data efficiently. If your source data store is in Azure, you can use this tool to check the download speed.
Check the Self-hosted IR's CPU and memory usage trend in Azure portal -> your data factory or Synapse workspace -> overview page. Consider to scale up/out IR if the CPU usage is high or available memory is low.
Adopt connector-specific data loading best practice if it's applicable. For example:
When copying data from Oracle, Netezza, Teradata, SAP HANA, SAP Table, and SAP Open Hub), enable data partition options to copy data in parallel.
When copying data from HDFS, configure to use DistCp.
When copying data from Amazon Redshift, configure to use Redshift UNLOAD.
Check if the service reports any throttling error on source or if your data store is under high utilization. If so, either reduce your workloads on the data store, or try contacting your data store administrator to increase the throttling limit or available resource.
Check your copy source and sink pattern:
If you copy data from partition-option-enabled data stores, consider to gradually tune the parallel copies. Too many parallel copies could even hurt the performance.
Otherwise, consider to split single large data set into several smaller data sets, and let those copy jobs run concurrently each tackles portion of data. You can do this with Lookup/GetMetadata + ForEach + Copy. Refer to Copy files from multiple containers, Migrate data from Amazon S3 to ADLS Gen2, or Bulk copy with a control table solution templates as general example.
"Transfer - writing to sink" experienced long working duration:
Adopt connector-specific data loading best practice if applies. For example, when copying data into Azure Synapse Analytics, use PolyBase or COPY statement.
Check if the Self-hosted IR machine has low latency connecting to sink data store. If your sink is in Azure, you can use this tool to check the latency from the Self-hosted IR machine to the Azure region, the less the better.
Check if the Self-hosted IR machine has enough outbound bandwidth to transfer and write the data efficiently. If your sink data store is in Azure, you can use this tool to check the upload speed.
Check if the Self-hosted IR's CPU and memory usage trend in Azure portal -> your data factory or Synapse workspace -> overview page. Consider to scale up/out IR if the CPU usage is high or available memory is low.
Check if the service reports any throttling error on sink or if your data store is under high utilization. If so, either reduce your workloads on the data store, or try contacting your data store administrator to increase the throttling limit or available resource.
Consider to gradually tune the parallel copies. Too many parallel copies could even hurt the performance.
Connector and IR performance
This section explores some performance troubleshooting guides for particular connector type or integration runtime.
Activity execution time varies using Azure IR vs Azure virtual network IR
Activity execution time varies when the dataset is based on different Integration Runtime.
Symptoms: Simply toggling the Linked Service dropdown in the dataset performs the same pipeline activities, but has drastically different run-times. When the dataset is based on the Managed Virtual Network Integration Runtime, it takes more time on average than the run when based on the Default Integration Runtime.
Cause: Checking the details of pipeline runs, you can see that the slow pipeline is running on Managed virtual network (Virtual Network) IR while the normal one is running on Azure IR. By design, Managed virtual network IR takes longer queue time than Azure IR as we aren't reserving one compute node per service instance, so there's a warm-up for each copy activity to start, and it occurs primarily on virtual network join rather than Azure IR.
Low performance when loading data into Azure SQL Database
Symptoms: Copying data in to Azure SQL Database turns to be slow.
Cause: The root cause of the issue is mostly triggered by the bottleneck of Azure SQL Database side. Following are some possible causes:
Azure SQL Database tier isn't high enough.
Azure SQL Database DTU usage is close to 100%. You can monitor the performance and consider to upgrade the Azure SQL Database tier.
Indexes aren't set properly. Remove all the indexes before data load and recreate them after load complete.
WriteBatchSize isn't large enough to fit schema row size. Try to enlarge the property for the issue.
Instead of bulk insert, stored procedure is being used, which is expected to have worse performance.
Time-out or slow performance when parsing large Excel file
Symptoms:
When you create Excel dataset and import schema from connection/store, preview data, list, or refresh worksheets, you could encounter a time-out error if the excel file is large in size.
When you use copy activity to copy data from large Excel file (>= 100 MB) into other data store, you could experience slow performance or OOM issue.
Cause:
For operations like importing schema, previewing data, and listing worksheets on excel dataset. The time-out is 100 s and static. For large Excel file, these operations might not finish within the time-out value.
The copy activity reads the whole Excel file into memory then locate the specified worksheet and cells to read data. This behavior is due to the underlying SDK the service uses.
Resolution:
For importing schema, you can generate a smaller sample file, which is a subset of original file, and choose "import schema from sample file" instead of "import schema from connection/store".
For listing worksheet, in the worksheet dropdown, you can select "Edit" and input the sheet name/index instead.
To copy large excel file (>100 MB) into other store, you can use Data Flow Excel source which sport streaming read and perform better.
The OOM Issue of reading large JSON/Excel/XML files
Symptoms: When you read large JSON/Excel/XML files, you meet the out of memory (OOM) issue during the activity execution.
Cause:
- For large XML files: The OOM issue of reading large XML files is by design. The cause is that the whole XML file must be read into memory as it is a single object, then the schema is inferred, and the data is retrieved.
- For large Excel files: The OOM issue of reading large Excel files is by design. The cause is that the SDK (POI/NPOI) used must read the whole excel file into memory, then infer the schema and get data.
- For large JSON files: The OOM issue of reading large JSON files is by design when the JSON file is a single object.
Recommendation: Apply one of the following options to solve your issue.
- Option-1: Register an online self-hosted integration runtime with powerful machine (high CPU/memory) to read data from your large file through your copy activity.
- Option-2: Use optimized memory and big size cluster (for example, 48 cores) to read data from your large file through the mapping data flow activity.
- Option-3: Split the large file into small ones, then use copy or mapping data flow activity to read the folder.
- Option-4: If you're stuck or meet the OOM issue during copy the XML/Excel/JSON folder, use the foreach activity + copy/mapping data flow activity in your pipeline to handle each file or subfolder.
- Option-5: Others:
- For XML, use Notebook activity with memory optimized cluster to read data from files if each file has the same schema. Currently, Spark has different implementations to handle XML.
- For JSON, use different document forms (for example, Single document, Document per line and Array of documents) in JSON settings under mapping data flow source. If the JSON file content is Document per line, it consumes little memory.
Other references
Here's performance monitoring and tuning references for some of the supported data stores:
- Azure Blob storage: Scalability and performance targets for Blob storage and Performance and scalability checklist for Blob storage.
- Azure Table storage: Scalability and performance targets for Table storage and Performance and scalability checklist for Table storage.
- Azure SQL Database: You can monitor the performance and check the Database Transaction Unit (DTU) percentage.
- Azure Synapse Analytics: Its capability is measured in Data Warehouse Units (DWUs). See Manage compute power in Azure Synapse Analytics (Overview).
- Azure Cosmos DB: Performance levels in Azure Cosmos DB.
- SQL Server: Monitor and tune for performance.
- On-premises file server: Performance tuning for file servers.
Related content
See the other copy activity articles: