磁贴适用于在工作簿中呈现摘要数据。 以下示例显示磁贴的常见用例,应用级别摘要位于详细网格的顶部。

工作簿磁贴支持显示标题、副标题、大文本、图标、基于指标的渐变、迷你图或条形图、以及页脚等项。
添加磁贴
选择“编辑”工具栏按钮,将工作簿切换到编辑模式。
要将日志查询控件添加到工作簿,请选择添加>添加查询。
请在“查询类型”中选择“日志”。 对于资源类型,选择例如“Application Insights”,然后选择要作为目标的资源。
使用查询编辑器输入用于分析的 KQL。
requests | summarize Requests = count() by appName, name | top 7 by Requests desc将“大小”设置为“完整”。
将“可视化效果”设置为“磁贴”。
选择磁贴设置按钮以打开磁贴设置窗格。
- 在“标题”中,设置:
-
使用列:
name
-
使用列:
- 在“左侧”中,设置:
-
使用列:
Requests -
列呈现器:
Big Number -
调色板:
Green to Red - 最小值:
-
使用列:
- 在“底部”中,设置:
-
使用列:
appName
-
使用列:
- 在“标题”中,设置:
选择窗格底部的“保存并关闭”按钮。

读取模式下的磁贴:

磁贴中的 Spark 行
通过在工具栏上选择“编辑”,将工作簿切换到编辑模式。
添加一个名为
TimeRange的时间范围参数。- 选择添加>添加参数。
- 在参数控件中,选择“添加参数”。
- 在“参数名称”字段中,输入 。 对于参数类型,选择
Time range picker。 - 选择窗格顶部的“保存”,然后在参数控件中选择“完成编辑”。
选择“添加”>和“添加查询”,以在参数控件下添加日志查询控件。
请在“查询类型”中选择“日志”。 对于资源类型,选择例如“Application Insights”,然后选择要作为目标的资源。
使用查询编辑器输入用于分析的 KQL。
let topRequests = requests
| summarize Requests = count() by appName, name
| top 7 by Requests desc;
let topRequestNames = topRequests | project name;
requests
| where name in (topRequestNames)
| make-series Trend = count() default = 0 on timestamp from {TimeRange:start} to {TimeRange:end} step {TimeRange:grain} by name
| join (topRequests) on name
| project-away name1, timestamp
选择“运行查询”。 在运行查询之前将
TimeRange设置为所选的值。将“可视化效果”设置为“磁贴”。
将“大小”设置为“完整”。
选择“磁贴设置”:
- 在 Tile 中进行设置:
-
使用列:
name
-
使用列:
- 在“子磁贴”中,设置:
-
使用列:
appNAme
-
使用列:
- 在“左侧”中,设置:
-
使用列:
Requests -
列呈现器:
Big Number -
调色板:
Green to Red - 最小值:
-
使用列:
- 在“底部”中,设置:
-
使用列:
Trend -
列呈现器:
Spark line -
调色板:
Green to Red - 最小值:
-
使用列:
- 在 Tile 中进行设置:
选择窗格底部的“保存并关闭”按钮。

磁贴大小
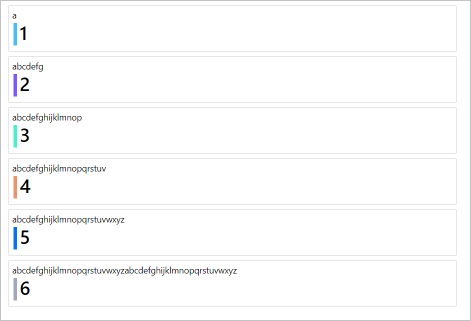
可以选择在磁贴设置中设置磁贴宽度:
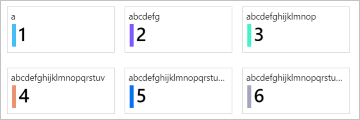
fixed(默认值)图块的默认行为是具有相同的固定宽度(大约 160 像素宽)以及图块周围的空间。
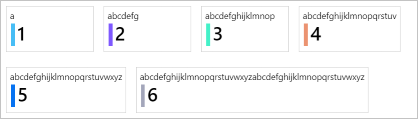
auto每个标题都会缩小或扩大以适应其内容。 磁贴仅限于磁贴视图的宽度(无水平滚动)。
full size每个标题始终占据图块视图的整个宽度,每行只有一个标题。